1. Introduction
Endometriosis is a common disease among women of reproductive age and a major contributor to pelvic pain and subfertility causing disability and significantly compromised quality of life [
1]. It affects up to 10% of women of reproductive age, 50–60% of women and two-thirds of teenage girls with pelvic pain and dysmenorrhea, and up to 50% of women with infertility [
2,
3]. Because of its wide and non-specific clinical symptoms and difficult diagnosis, endometriosis is frequently underdiagnosed or diagnosed in later, more severe stages [
4]. Diagnostic lead marks could be put together from the patient’s history, gynecological examination containing ultrasound, and a few specific laboratory markers such as CA125 (cancer antigen 125, known as MUC16). Until now, there is no biomarker from the endometrium, blood, or urine or combined non-invasive tests specific enough to be used in clinical practice. Therefore, laparoscopy remains the gold standard for the diagnosis of endometriosis, and using non-invasive tests should only be undertaken in a research setting [
1,
5,
6,
7,
8].
As the etiology and pathophysiology of endometriosis is still not fully understood, and more theories are being studied, it is challenging to discover a highly specific and sensitive preoperative diagnostic tool. Furthermore, it is necessary to validate the diagnostic accuracy of every promising test prospectively in an independent symptomatic patient population with subfertility and/or pain without clear ultrasound evidence of endometriosis and with a clinical indication for surgery, divided into cases with laparoscopically and histologically confirmed endometriosis and controls with laparoscopically confirmed absence of endometriosis [
9].
To ensure a full understanding of the hypothesis of circulating endometrial cells (CECs), the lymphovascular spread (also called embolization, metastasis, transplantation) theory must be introduced first. It was first published by Halban in 1925 [
10], who detected endometrial cells in the lymphatic system of the uterus in patients with endometriosis. Meanwhile, Sampson studied the volume and shape of the uterine cavity in normal and pathologic conditions. When injecting the uterus with a suspension, he found the injected mass to escape from uterine veins, which led him to believe that the endometrial cells would enter circulation in the same way [
11]. This theory was further studied in an experiment in 1940, when Hobbs and Bortnick injected endometrial cells into the circulation of rabbits. He found endometrial lesions in the lungs and pleura of these animals later during dissection [
12]. In 1952, Javert followed up on Sampson’s work and detected endometrial cells in the pelvic veins of patients with endometriosis [
13].
More than half a century later, CECs were described by Bobek et al. [
14] in accordance with the same vascular spread theory. Endometrial cells from peripheral blood (PB) and peritoneal washings (PW) in patients with endometriosis were successfully isolated by a size-based separation method (Metacell
®). The endometrial origin of the captured cells was proven by immunohistochemistry [
14]. Later, Chan et al. used immunofluorescence staining and separation via microfluidic chips for CEC detection. The results indicated that CECs could be a promising biomarker with great potential in the diagnosis of endometriosis [
15].
The aim of this study was to isolate CECs in patients with different types of endometriosis and clinical symptoms and to characterize these cells by molecular analysis. In agreement with the innovative stem cell-based concept of endometriosis origin [
16], CECs molecular analysis might fulfil the puzzle of endometriosis pathogenesis.
The results of CECs cytomorphological analysis and gene expression profiling were correlated with patients’ clinical data. Further analysis was conducted in patients with multiple sampling throughout the menstrual cycle (MC) to understand the characteristics of CECs in each phase of MC. New information on the possible pathophysiology and development of endometriosis was brought through comparisons of molecular profiles of endometrial lesions obtained during gynecological surgeries and CECs.
2. Material and Methods
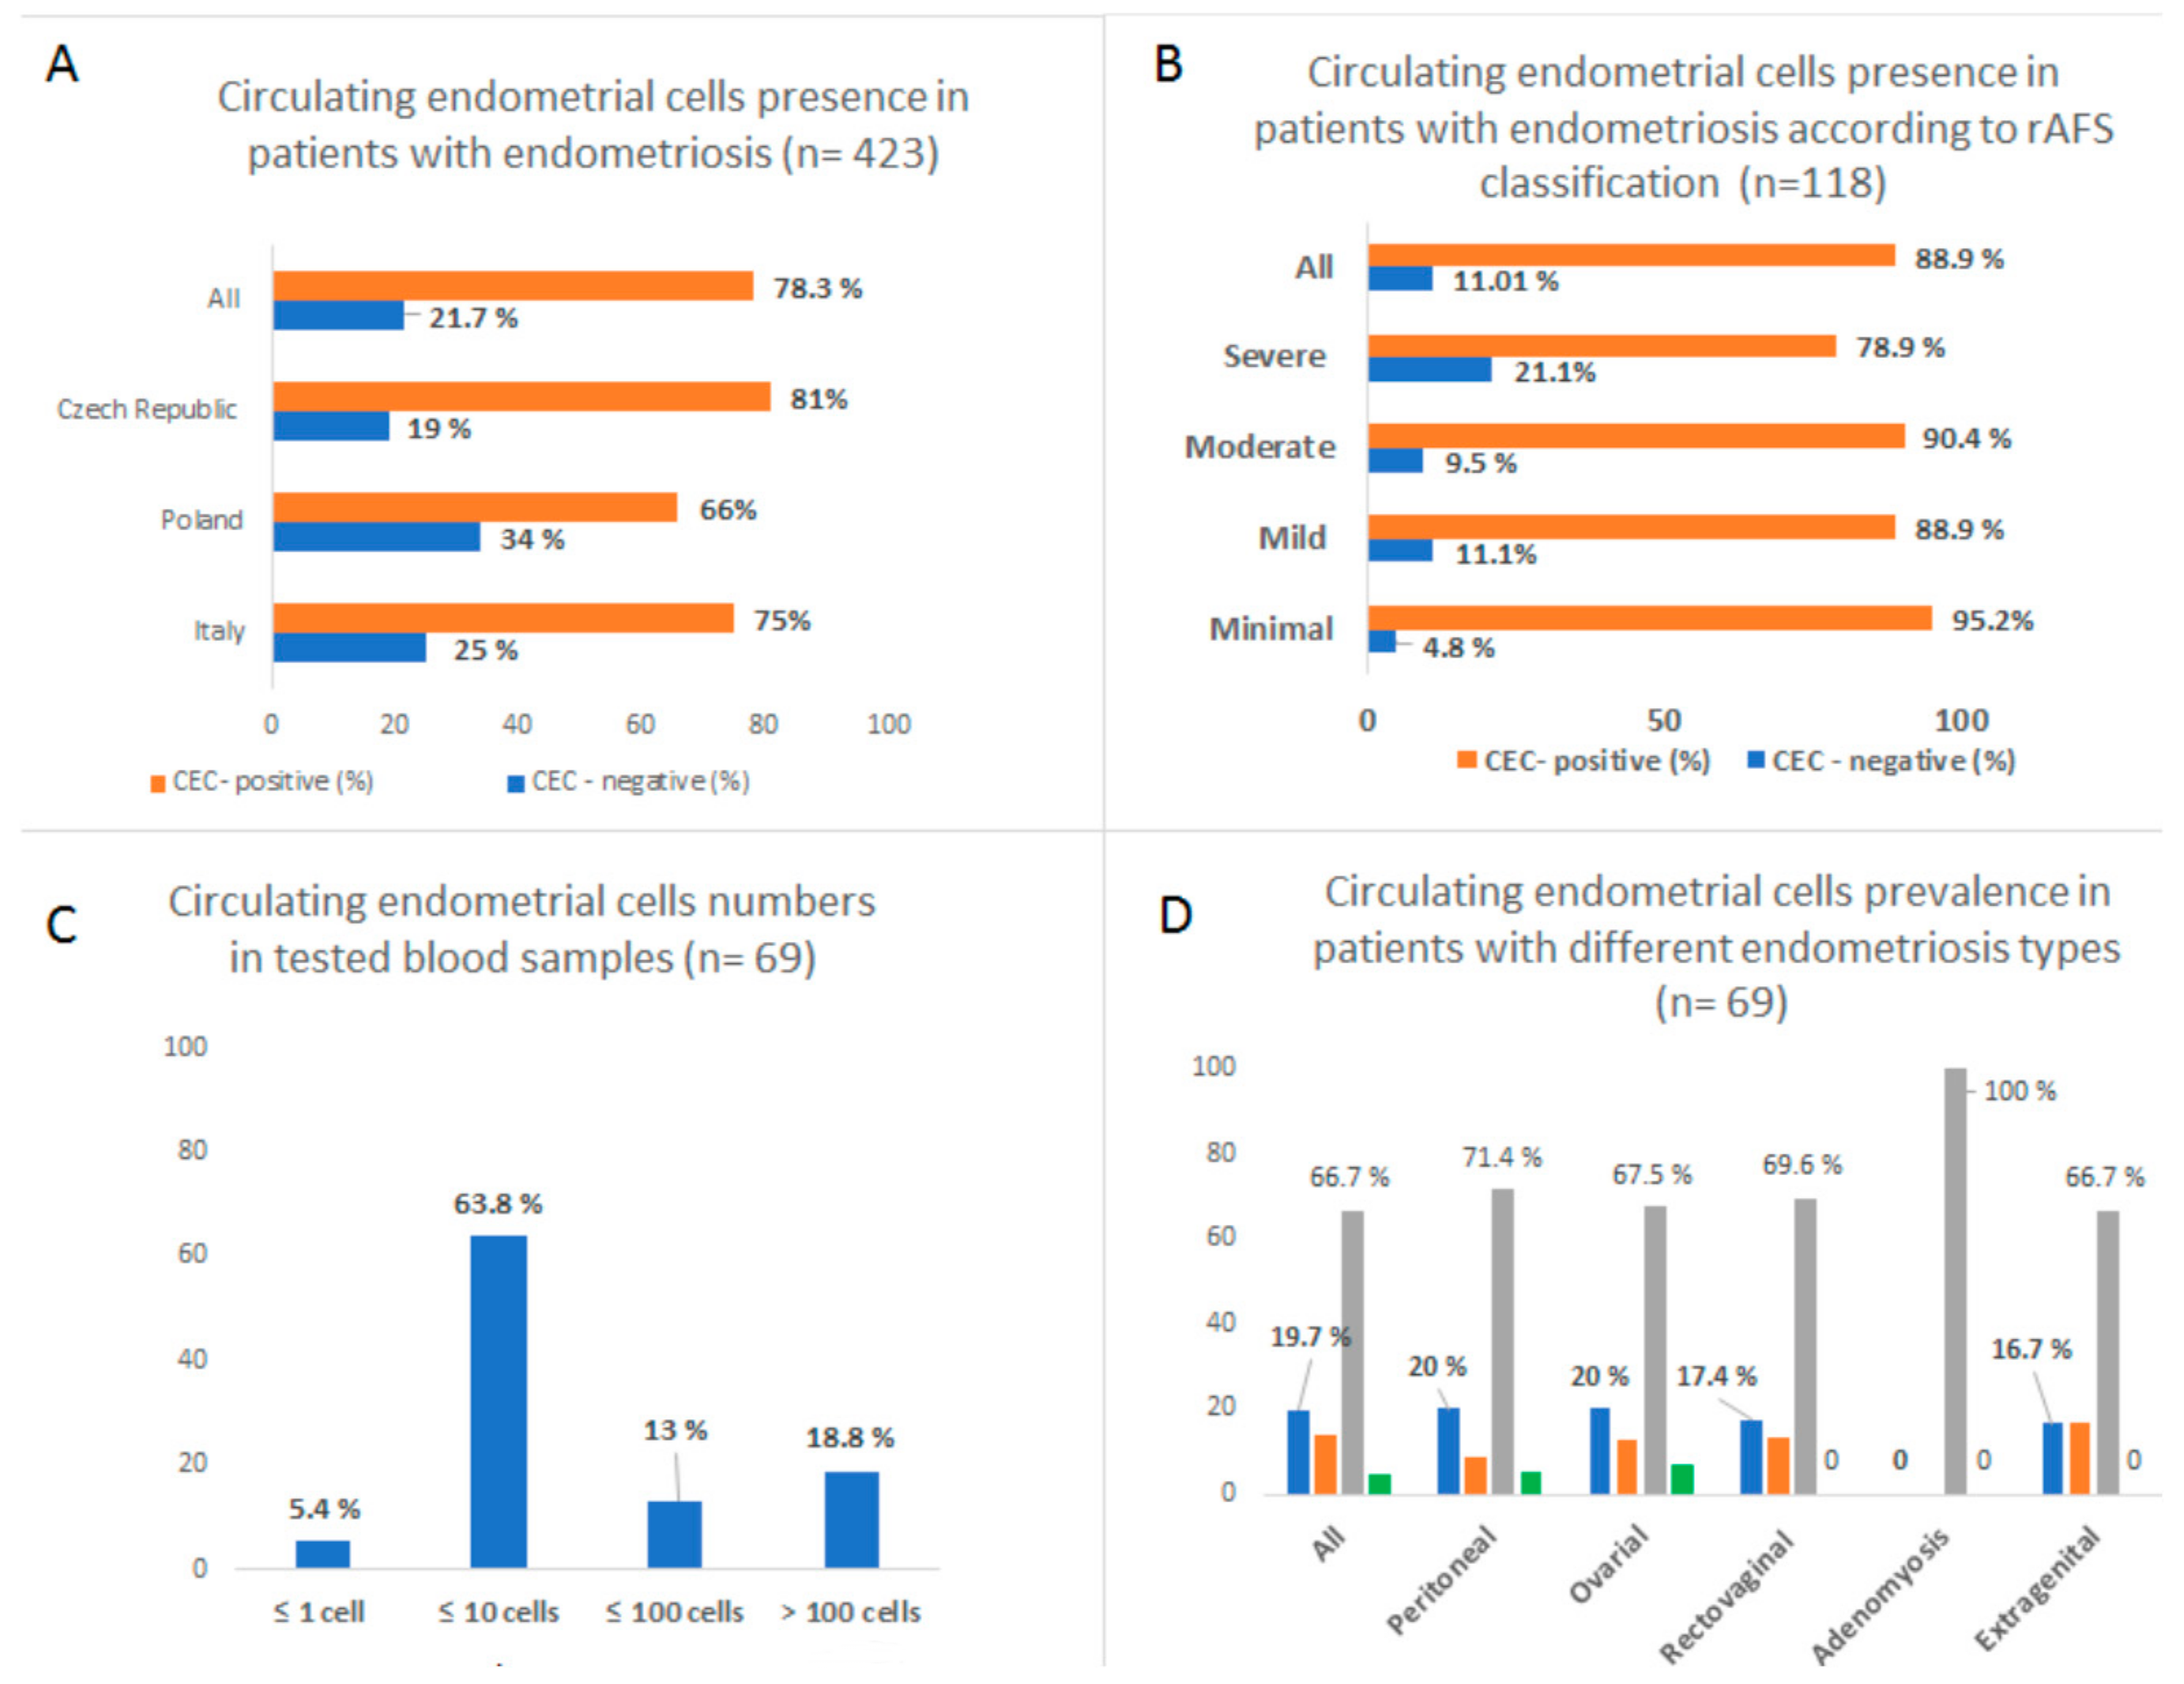
A multi-center prospective study was initiated to collect blood samples from women with endometriosis. The inclusion criterion was that all the patients had a histologically proven history of endometriosis. A form was filled for each patient containing her detailed data, i.e., information about the menstruation cycle, hormonal therapy if any, type of endometriosis (ovarian, peritoneal, recto-vaginal septum, adenomyosis, extragenital), classification by revised American Fertility Society (rAFS), symptoms, and signs (pelvic pain, dysmenorrhea, dyspareunia, metrorrhagia, hypermenorrhea, sterility, infertility, gastrointestinal problems). A supplementary table reporting the clinical data is available. Samples were obtained from 423 patients. The protocol for this study was approved by the Ethical Committee of University hospital Kralovske Vinohrady in Prague, Czech Republic (EK-VP/20/0/2015) and the Ethical Committee of Medical University Wroclaw, Poland (Nr.KB-242/2015 part of study and grant SUB.C280.19.050).
As the samples were collected from various centers nationally and internationally, a possible bias in results due to different transport conditions was considered. The sample was marked CEC-positive if endometrial-like cells were detected. Subsequently, we divided the positive samples into categories based on CEC quantity (low positivity—up to 10 cells, medium positivity—up to 100 cells, high positivity—more than 100 cells). Samples with high positivity (n = 13) were subjected to molecular analysis. To be able to analyze the molecular character of CECs during the MC, we obtained multiple samples from 11 patients during their menstrual cycle (2 × 48 samples in total). A minimum of four samples were taken for every patient to correspond to different phases of the cycle (menstruation, proliferative phase, ovulation, secretory phase). The phase was calculated from the last menstrual bleeding and verified by ultrasound examination of the endometrium.
To enrich CECs, approximately 2 × 8 mL of PB was drawn from the antecubital veins and placed into S-Monovette tubes (Sarstedt AG & Co., Numbrecht, Germany) containing 1.6 mg EDTA/mL blood as an anticoagulant. The samples were processed at room temperature using an isolation procedure completed within 36 h of the blood draw. The ethics committees of the participating universities and hospitals approved the study protocol according to the Declaration of Helsinki. Size- based filtration and an in vitro culture method (MetaCell
®, Ostrava, Czech Republic) were used to enrich CECs. [
14]. The captured cells grew in the fetal bovine serum -enriched RPMI medium (10%) (Merck KGaD, Darmstadt, Germany) for the period of a minimum of 7–14 days on the separation membrane. The cultured cells were analyzed by vital fluorescent microscopy using unspecific nuclear (NucBlue
TM, ThermoFisherScientific, Waltham, U.S.) and cytoplasmatic (Celltracker
TM, ThermoFisherScientific, Waltham, U.S.) staining. Cells on the membrane were later put into RLT buffer lysis (Qiagen, Hilden, Germany) and kept in the freezer for further analysis.
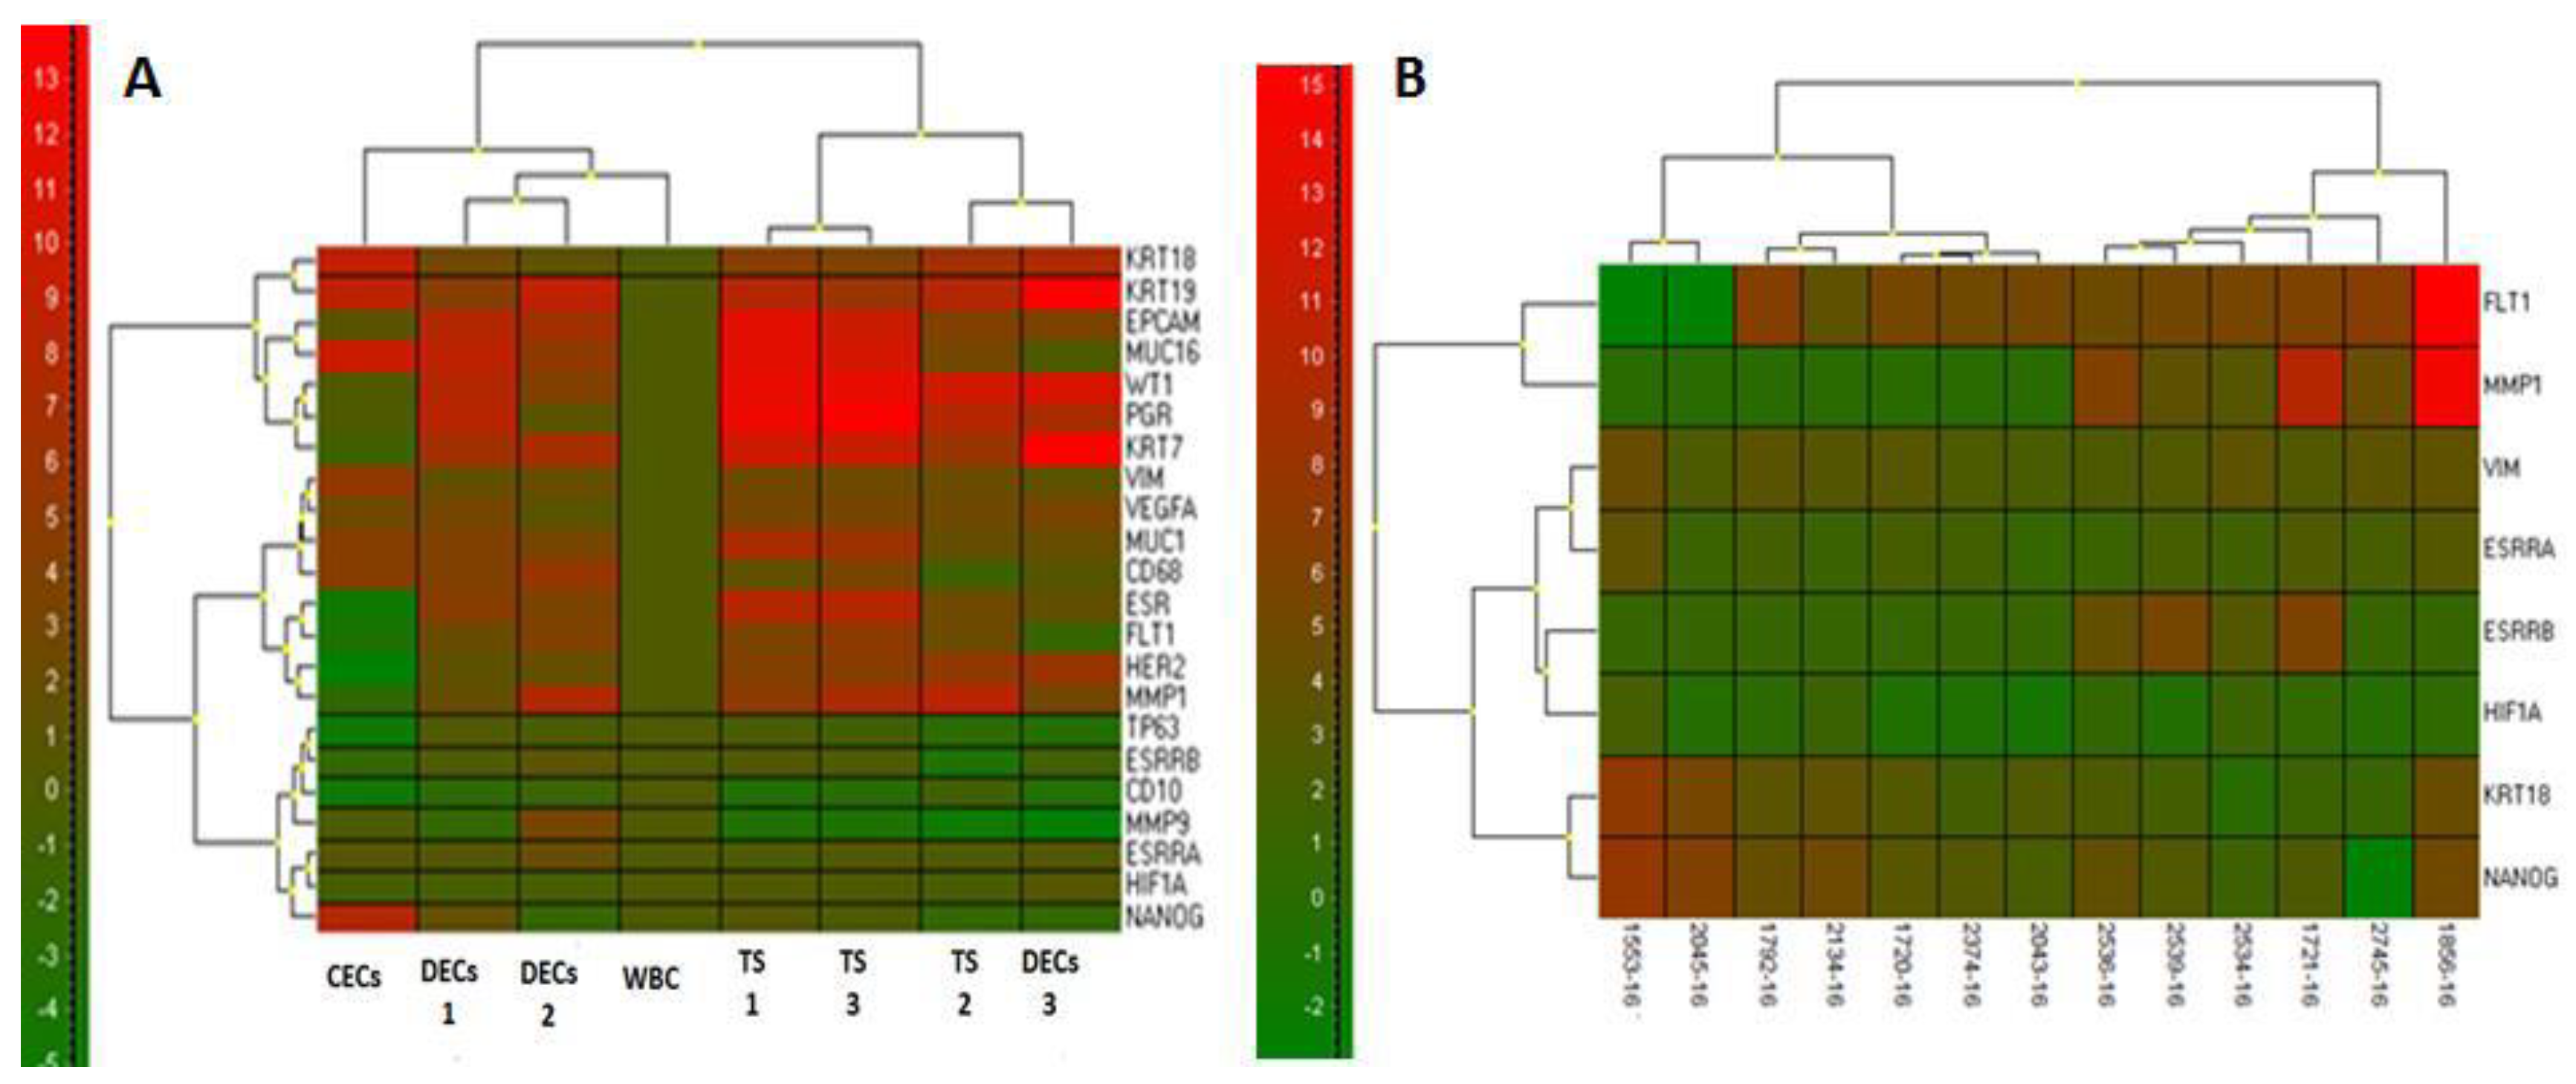
As mentioned earlier, further molecular analysis was initiated in the single site sample group with the highest number of CECs (2 × 13 samples in total). To confirm the origin of the cells on the separation membrane, CECs gene expression analysis was performed. Gene expression analysis (GEA) allowed up to 20 endometriosis-associated markers in RNA from different cell fractions to be tested within a single quantitative polymerase chain reaction (qPCR) run. Differential diagnostic markers for the qPCR test were chosen in concordance with the expected diagnosis. The key purpose of GEA was to compare gene expression of endometriosis-associated markers in the CECs enriched fractions to that in the whole blood.
Soon after, RNA was isolated from the whole blood’s white blood cell fraction (WBC) and CEC-enriched fraction on the membrane. Finally, the CECs gene expression analysis allowed identification of the relative amount of endometriosis-associated markers in the whole blood and in CEC-enriched fractions. The RNA from the whole blood was isolated with a modified procedure, and the quality/concentration of RNA was measured by NanoDrop (ThermoFisherScientific, Waltham, U.S.). As there were only a few hundred cells on the membrane, the median concentration of RNA was quite low (5–10 ng/μL). A High-Capacity complementary DNA (cDNA) Reverse Transcription Kit (ThermoFisherScientific, Waltham, U.S.) was used for cDNA production. qPCR analysis was performed using Taqman chemistry with hydrolysis probes for all the tested genes (ThermoFisherScientific, Waltham, U.S.). The tested genes which were thought to be endometrial-associated were CD68, EpCAM, KRT7, KRT18, KRT19, MUC1, MUC16, VIM, VEGFA, WT1, ESR1, PGR, HER2, CD10, FLT1, MMP1, MMP9, TP63, ESSRA, ESSRB, HIF1A, and NANOG.
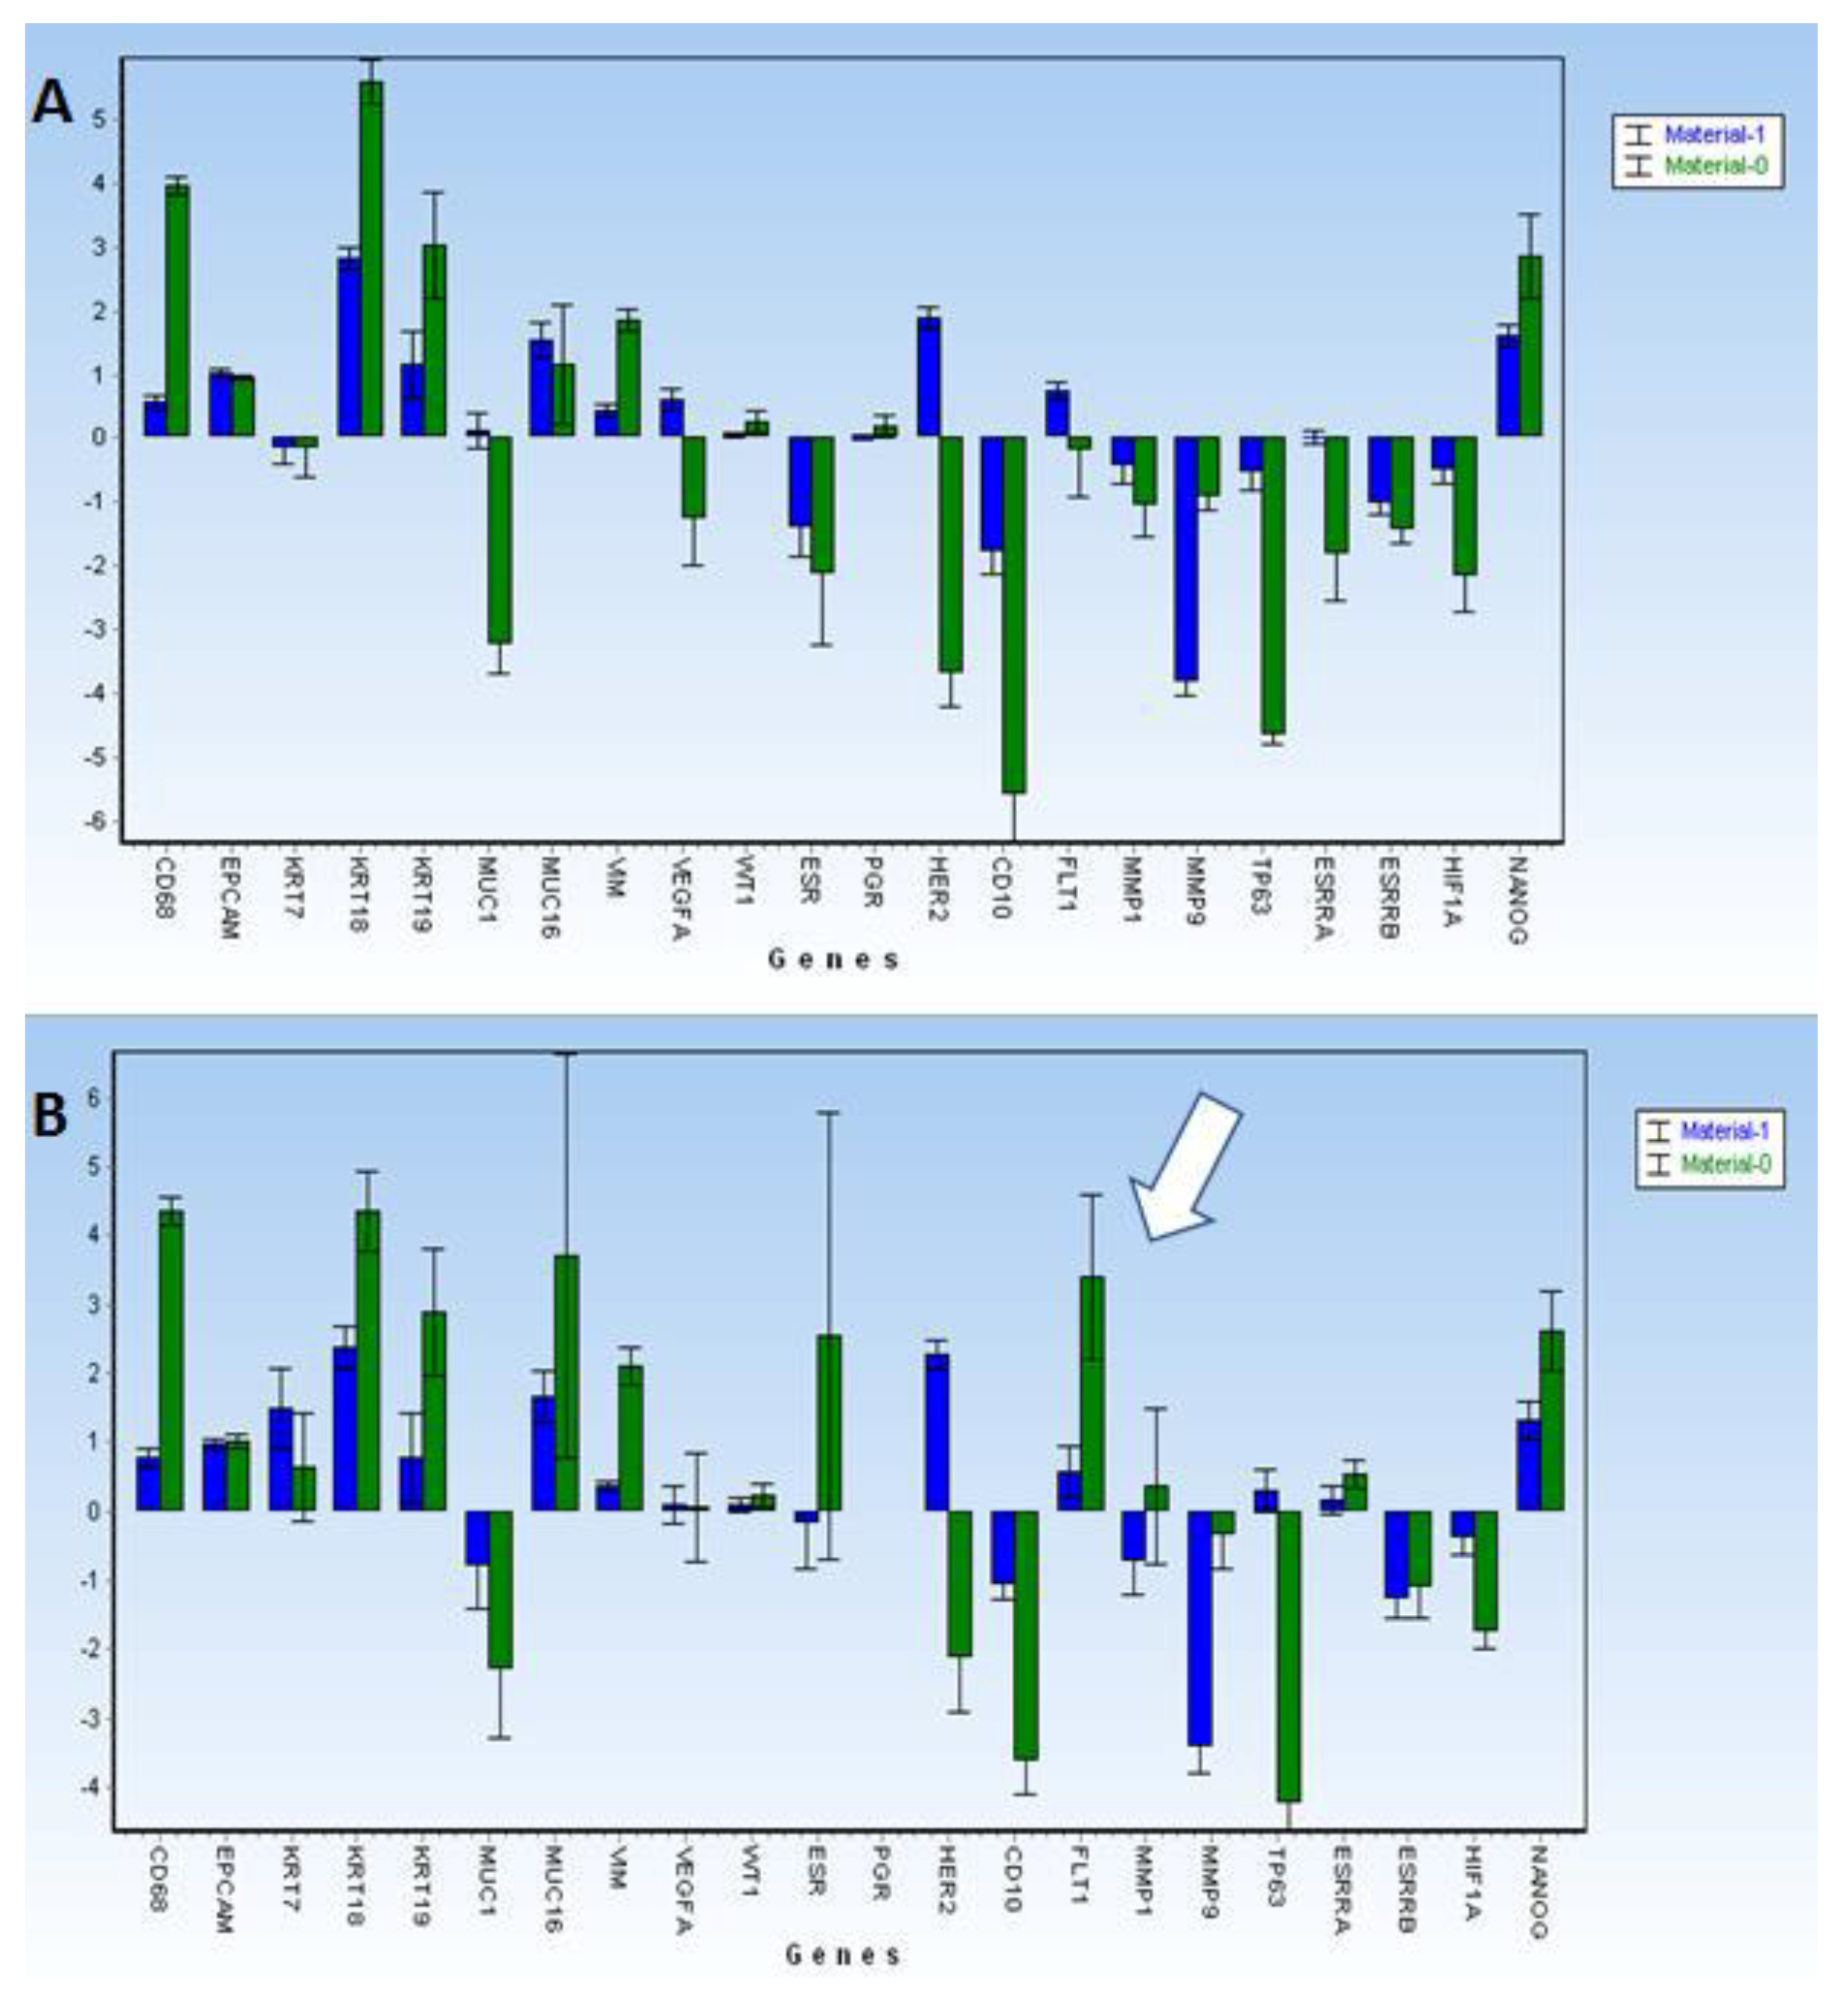
To ectopically analyze growing endometrial cells in tissues, we obtained several layers of histologically proven endometrioma (n = 11) from two patients during gynecological surgeries. Both patients had procedures planned because of pelvic pain and had a cystic adnexal tumor diagnosed during ultrasound examination. The perioperative findings in the first patient were bilateral massive endometriomas of the ovaries with no peritoneal or other lesions. The second patient had one-sided endometrioma forming a convolute consisting of the ovary and fallopian tube, severe peritoneal lesions of the urinary bladder, sacrouterine ligaments, and Douglas pouch. Eutopic endometrial tissue during menstruation bleeding was acquired from a healthy control. All tissues were further analyzed using the same qPCR protocol as for the CECs samples.
Gene expression analysis was conducted using Genex v. 6 (MultiD, Sweden) software to enable normalization and statistical analysis (cluster analysis, Mann–Whitney tests) for qPCR-generated data. The relative RNA amounts are reported for tested groups in comparisons to white blood cell fractions (WBC) or endometriosis tissue.
4. Discussion
Our study confirmed the presence of CECs in most patients with histologically proven endometriosis. The CECs occurrence was confirmed during all phases of the menstrual cycle, but the CECs cytomorphology differed depending on the changing hormone levels. The cytomorphological changes were accompanied by differences in the gene expression profile, as shown by the presented data.
Subsequently, the gene expression profiling of the endometriosis lesions and of the parallel CECs samples from PB identified a range of potential biomarkers which could be used to identify CECs in patients with undiagnosed endometriosis. Early detection of CECs in women with pelvic pain or other symptoms, in addition to objective gynecological examination suspecting endometriosis, could accelerate and improve diagnosis.
The shedding of CECs into PB could be ascribed to the well-known physiology of decidualization. The process of decidualization of the uterine lining denotes the transformation of endometrial stromal fibroblasts into specialized secretory decidual cells that provide a nutritive and immune-privileged matrix essential for embryo implantation and placental development. Decidualization of the human endometrium is driven by the postovulatory rise in progesterone levels and increasing local cAMP production. In response to falling progesterone levels, spontaneous decidualization causes menstrual shedding and cyclic regeneration of the endometrium. Under endometriosis conditions, the decidualizing cells tend to be progesterone non-responsive, which results in the need for a different energy [
17].
Endometrial-derived stem-cell vascular metastasis, as described in the study of Li F et al. [
18], might provide a valuable explanation for cases of distant, deep infiltration and recurrent endometriosis. It was shown that circulating endometriosis stem cells propagate endometriosis through vascular dissemination and may also serve as biomarkers of active lesion establishment. Furthermore, endometriosis-derived circulating cells were consistently found in the blood of animals with endometriosis, and their number increased during new lesion establishment in the mouse endometriosis model [
18]. A similar study using a mouse endometriosis model showed that donor bone marrow-derived circulating endothelial progenitor cells were found to be elevated acutely after endometriosis induction [
19]. The abovementioned circulating cell types with different expression profiles may be involved in endometriosis establishment and could serve as biomarkers of active disease.
Implementing the theory of somatic stem cells, endometriosis may be regarded as a stem-cell disease [
20,
21]; these endometrial stem cells differentiate into local tissue types, but cells may also differentiate into the epithelium, glands, and stroma to form functional ectopic endometrial tissue [
22,
23]. All of the mentioned cell types were detected in different frequencies in enriched CEC samples in our study.
However, the following questions still remain: What are the characteristics of CECs causing endometriosis? What markers might be used to identify CECs with some level of certainty? The CEC-positive samples displayed elevated gene expression of KRT18, KRT19, NANOG, and VIM in most of the tested samples. The CEC cells characterized in our cohort did not express PGR (progesterone receptor) and, in at least half of the cases, ESR1 was also not present. Does this mean that mostly hormone non-responsive CECs are shed into circulation?
The histological appearance of the endometrium was referred to as predecidua in several previous publications [
18,
24]. In parallel with the predecidua changes, various CEC types isolated from patients with endometriosis in our cohort showed different gene expression profiles, represented by typically elevated gene expression of
KRT18,
NANOG, and
VIM or of
KRT19 and
ESR1.
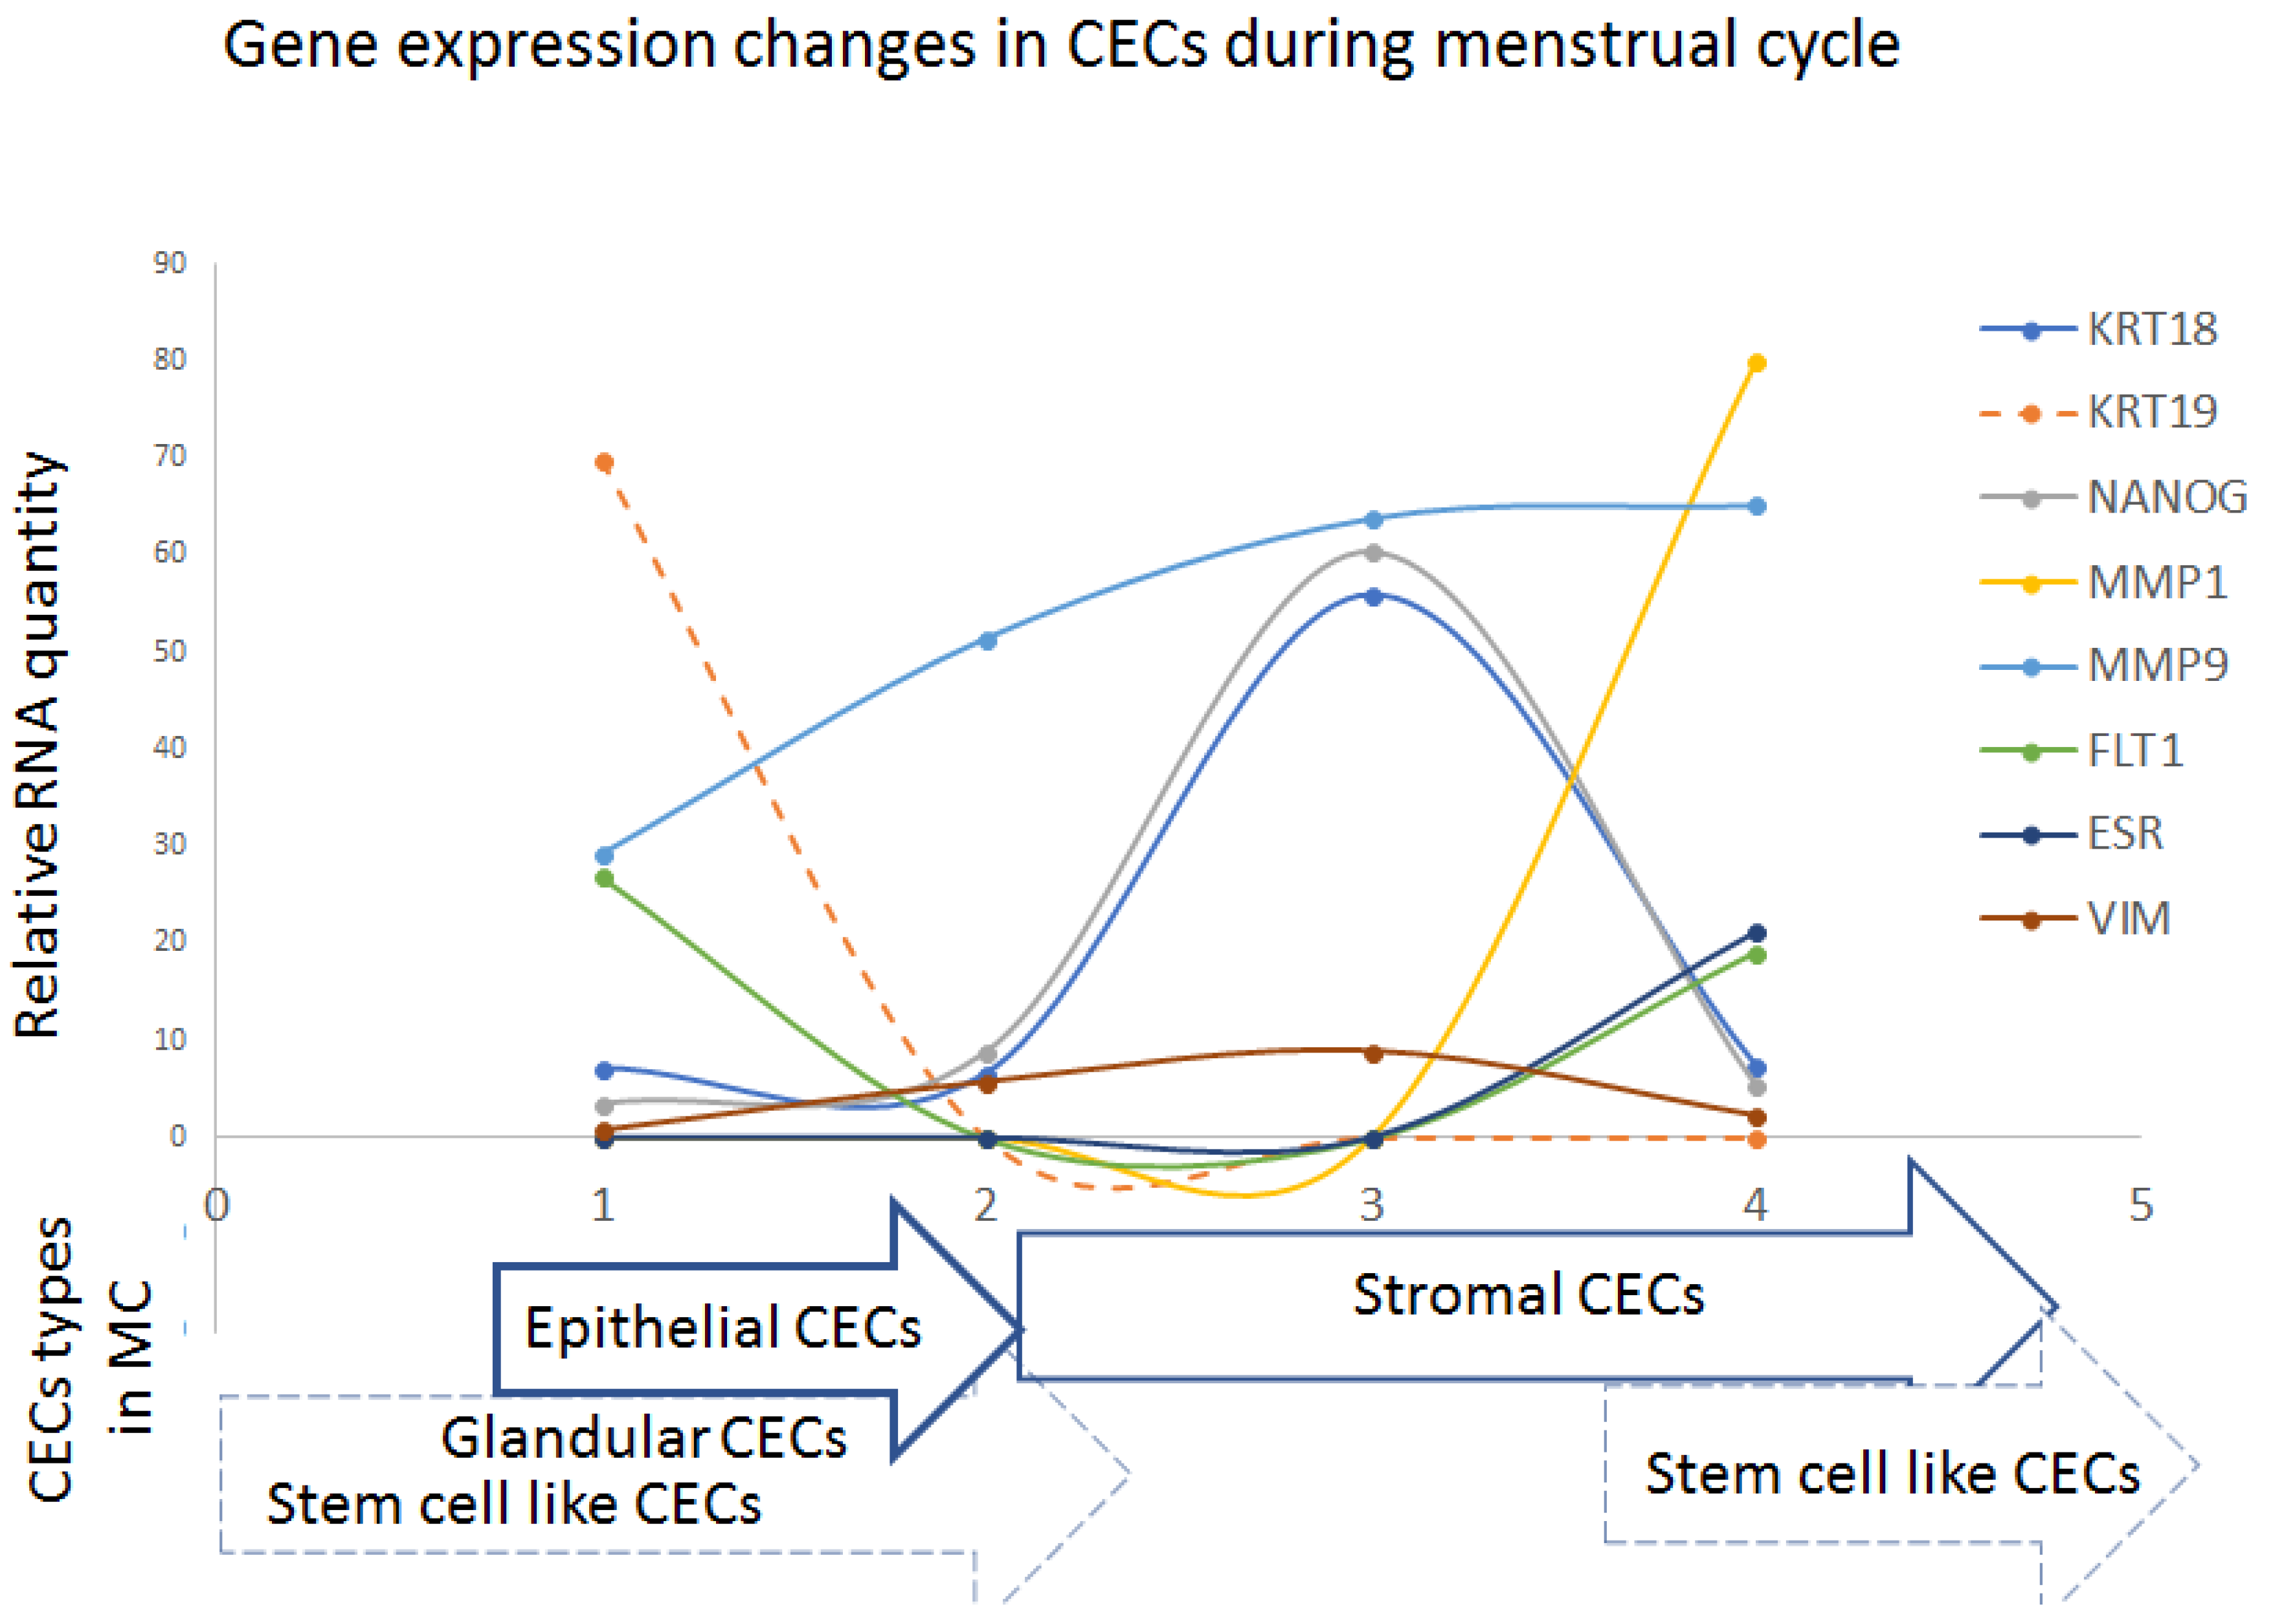
Interestingly,
KRT18,
VIM, and
NANOG were elevated in the secretory phases of the menstrual cycle, while
KRT19 and
ESR1 were observed in the proliferative MC phases. Angiogenesis might be driven by elevated
FLT1 and
MMP1 in the late secretory phases. Our results mirror data reviewed by Wang et al. [
16], summarizing the probable pathogenesis of endometriosis. In short, the proliferative phases of MC are presented by relatively high keratin expression, ascribed to the quickly proliferating epithelial cells. Upon epithelization, the process of lining decidualization is supported by a stem cell and/or mesenchymal cell supply. It was shown that somatic stem cells may originate from different tissue stem-cell reservoirs and/or directly from bone marrow. As shown by the distinct gene expression profiles, there were also cells with mesenchymal characteristics (
VIM-positive) on the way to the endometrium. Similarly, circulating stromal cells (
CD10+ cells) but no epithelial cells in the circulating blood of endometriosis patients were detected using another size-based separation approach (ScreenCell
®) [
25], who reported the presence of only circulating stromal cells. One of their explanations for the absence of epithelial circulating cells in their study was that cells smaller than 8 µm could have been missed using this filtration technique.
Our data showed that, during the MC, there is often elevated KRT19 and ESR1 detected in CECs in the proliferative phase, and that, during the whole MC, KRT18, NANOG (a stem-cell marker), and VIM (mesenchymal marker) are present in different levels in enriched CECs.
The results discussed in this paper offer a chance to identify CEC subtypes circulating in PB and may facilitate the management of preoperative and postoperative endometriosis therapy in the future, using the CEC characteristics and their hormone non-responsiveness. Further studies are necessary to fully understand the advantages of CEC application and its use in clinical practice.


 ,
, 


