Health-Related Quality of Life in Chronic Liver Diseases: A Strong Impact of Hand Grip Strength

Abstract
1. Introduction
2. Patients and Methods
2.1. Patients
2.2. Questionnaire
2.3. Measurement of HGS and SMI
2.4. Statistical Considerations
3. Results
3.1. Patient Baseline Data
3.2. Impact of HGS and SMM on the SF-36 Scores for all Cases
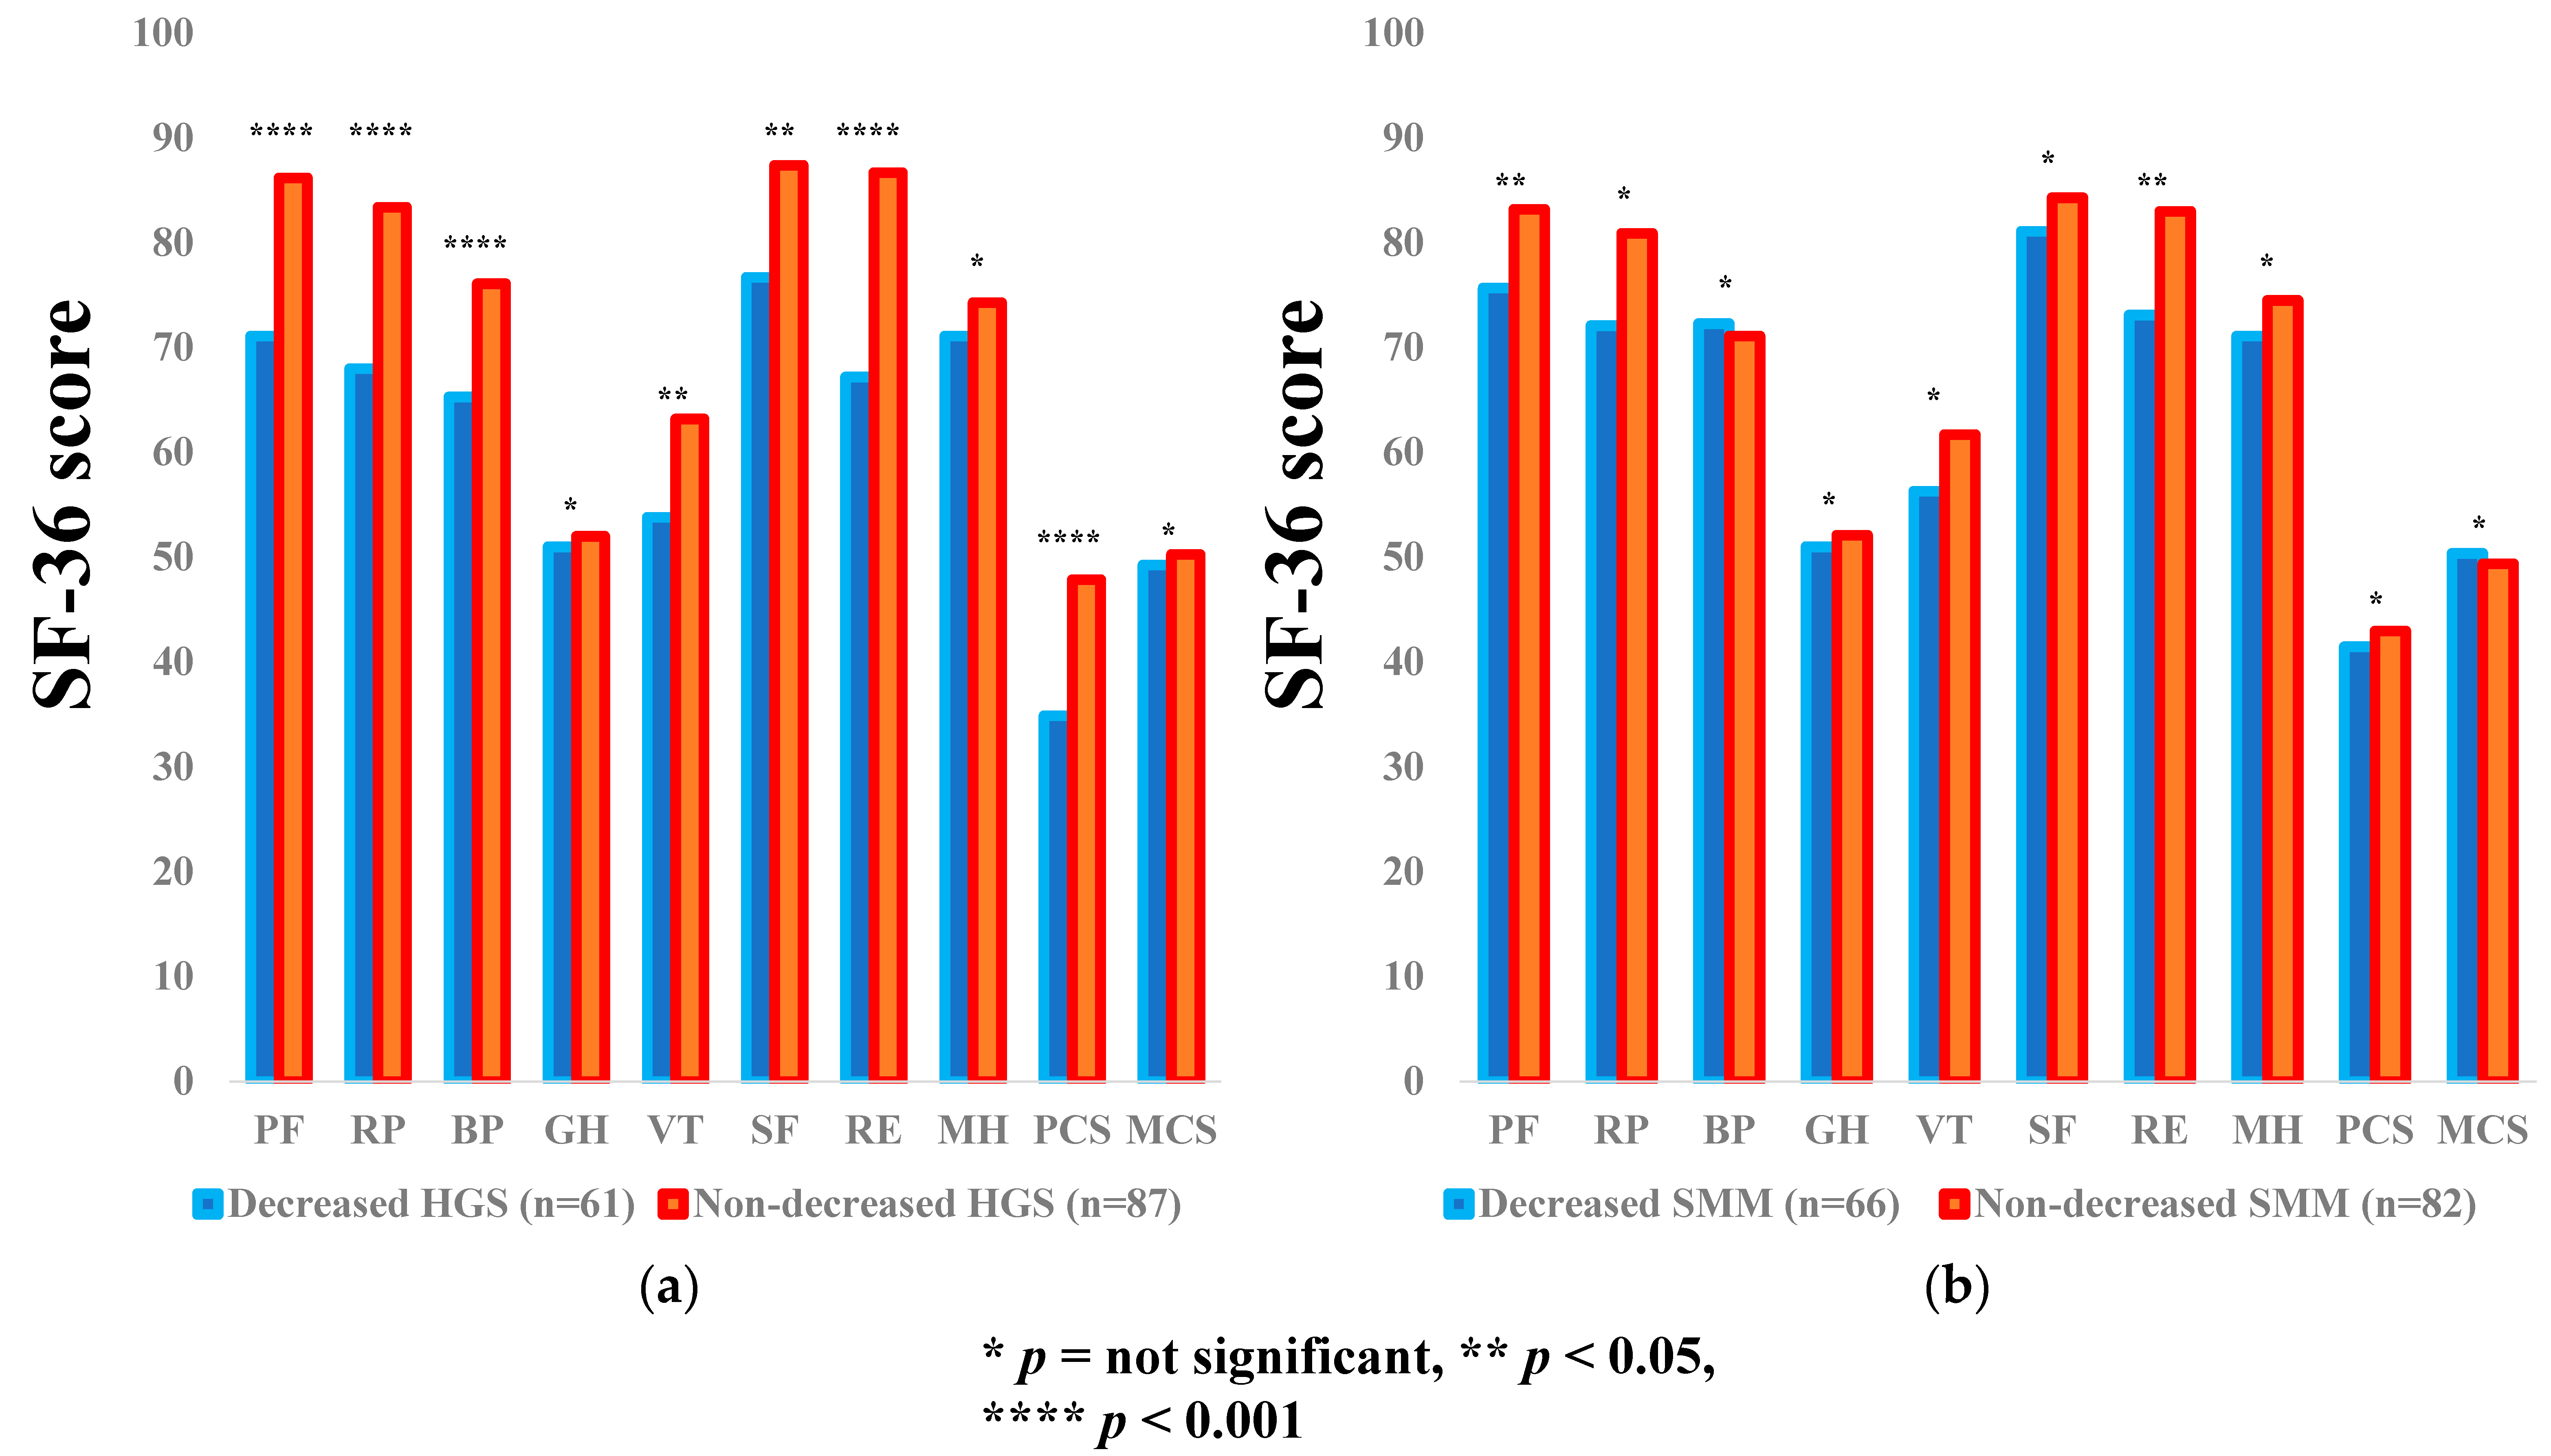
3.3. Subgroup Analysis 1: Impact of HGS and SMM on the SF-36 Scores for LC Patients
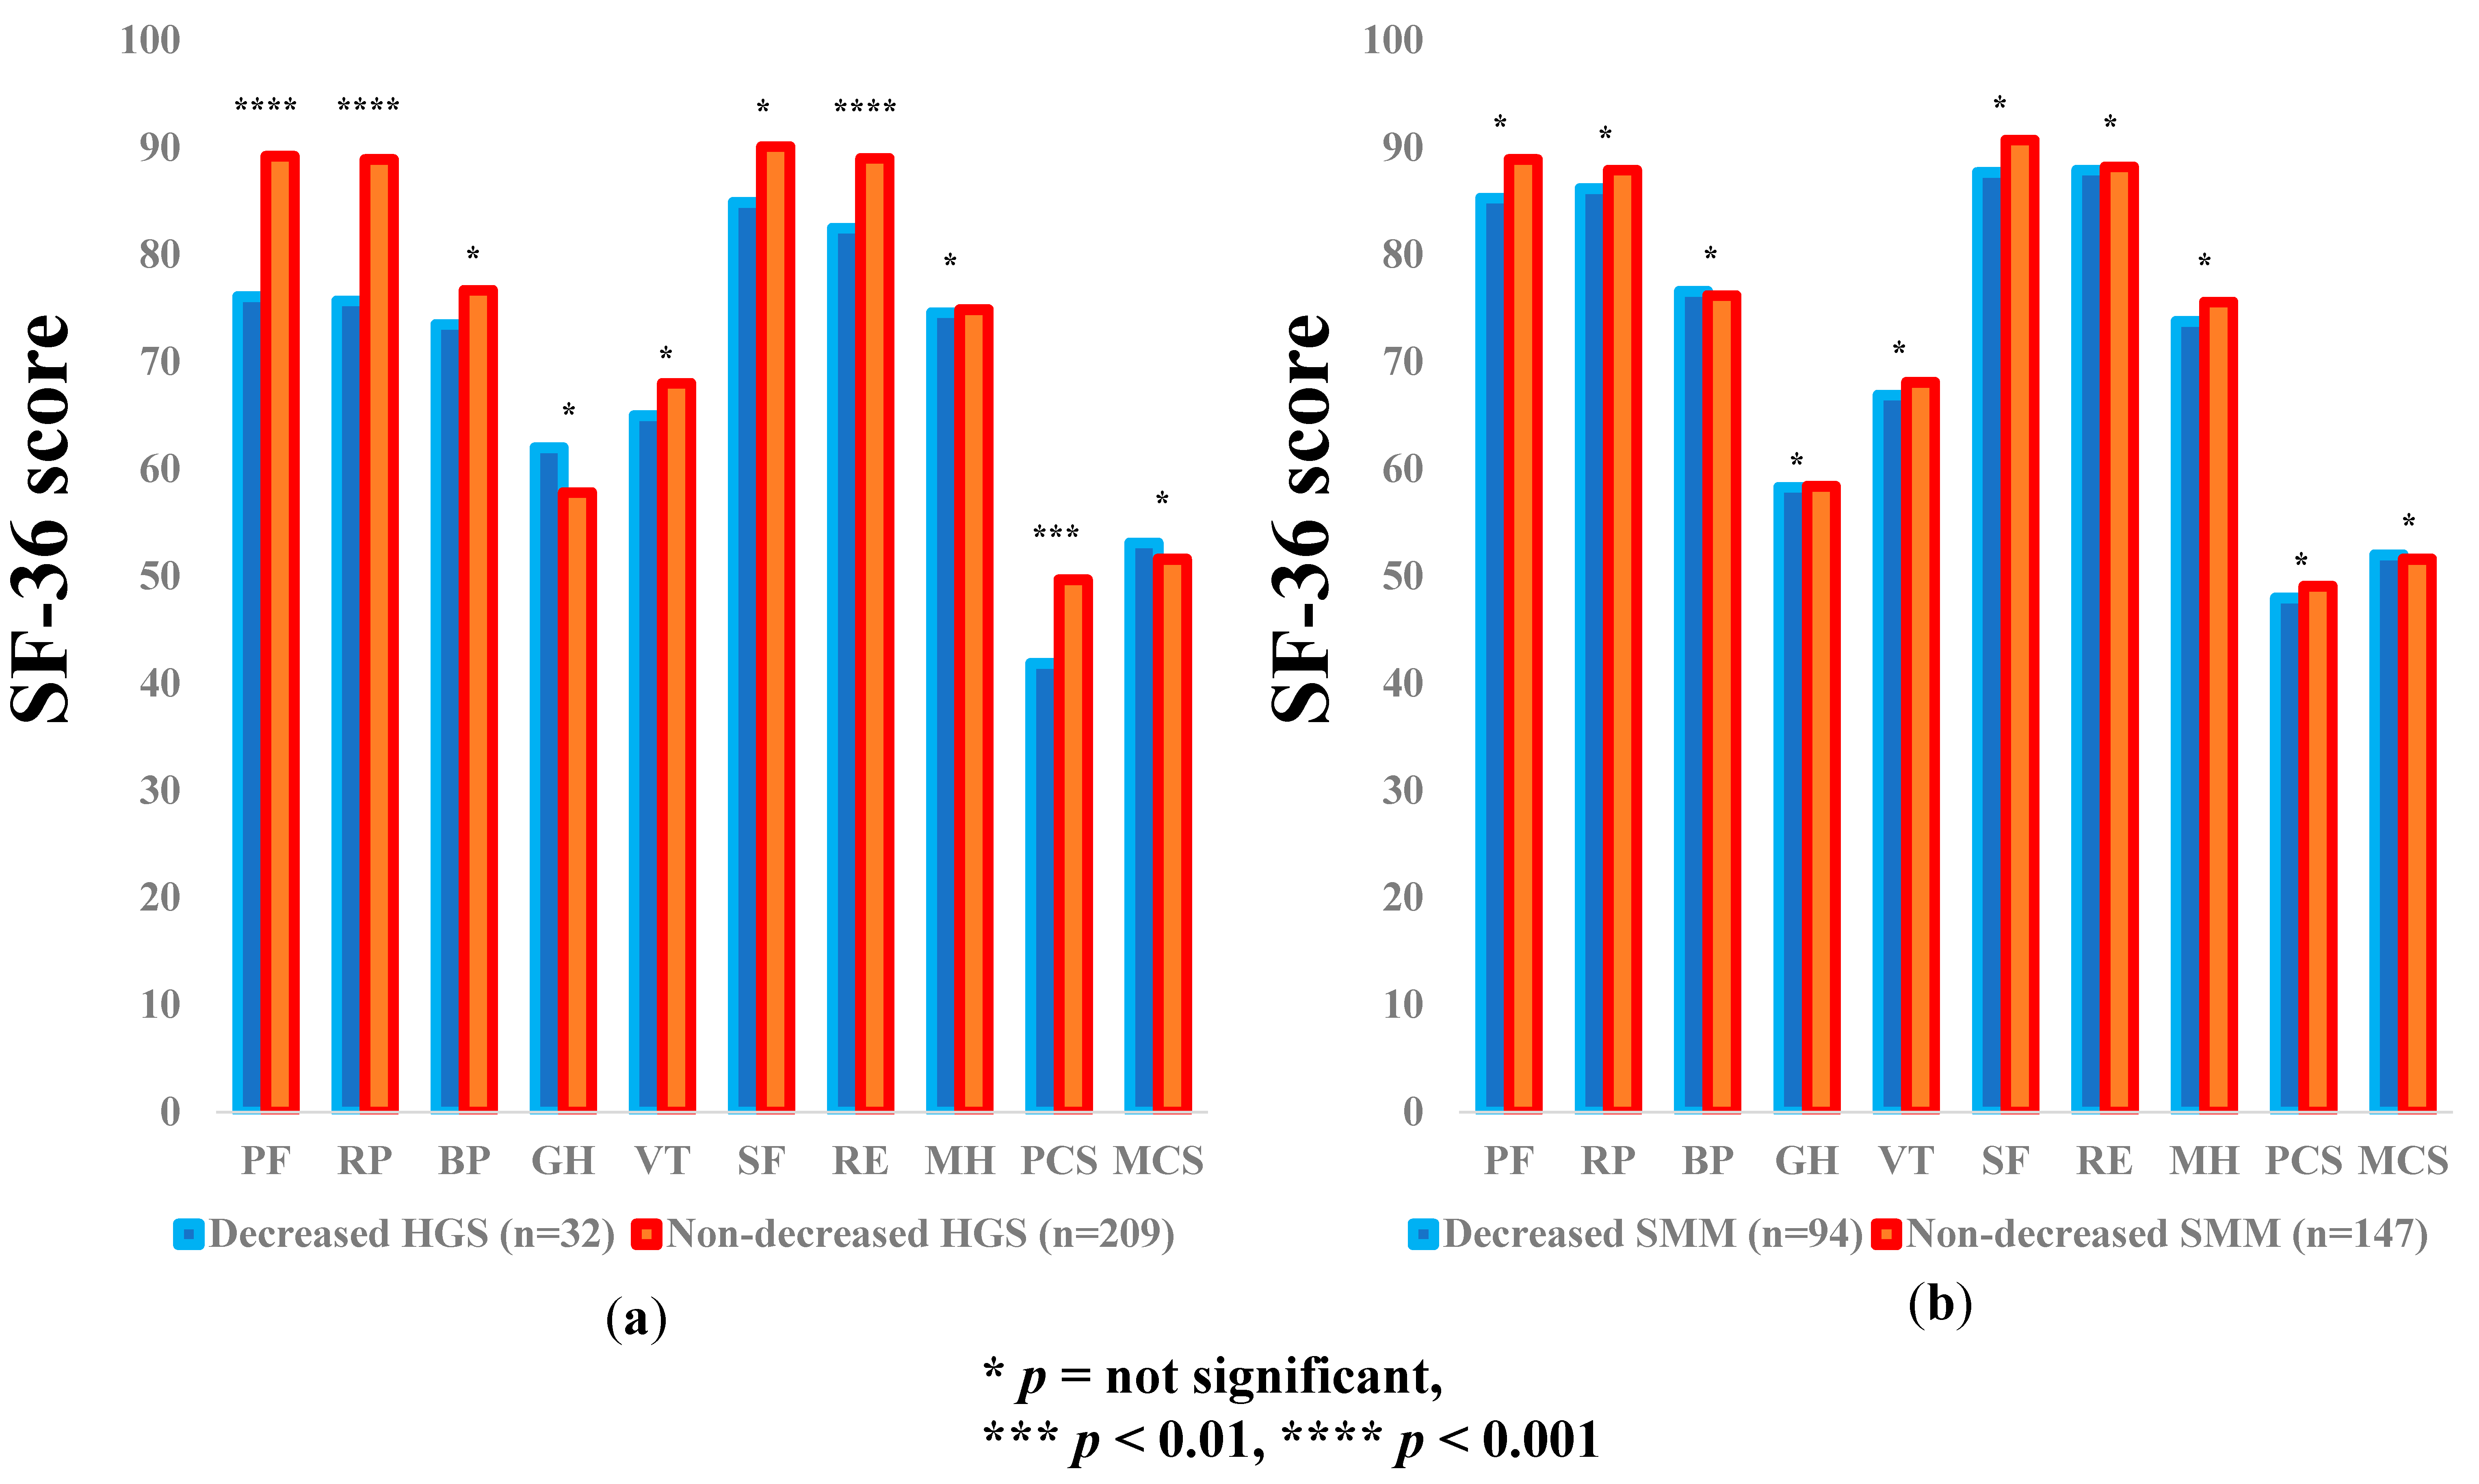
3.4. Subgroup Analysis 2: Impact of HGS and SMM on the SF-36 Scores for Non-LC Patients
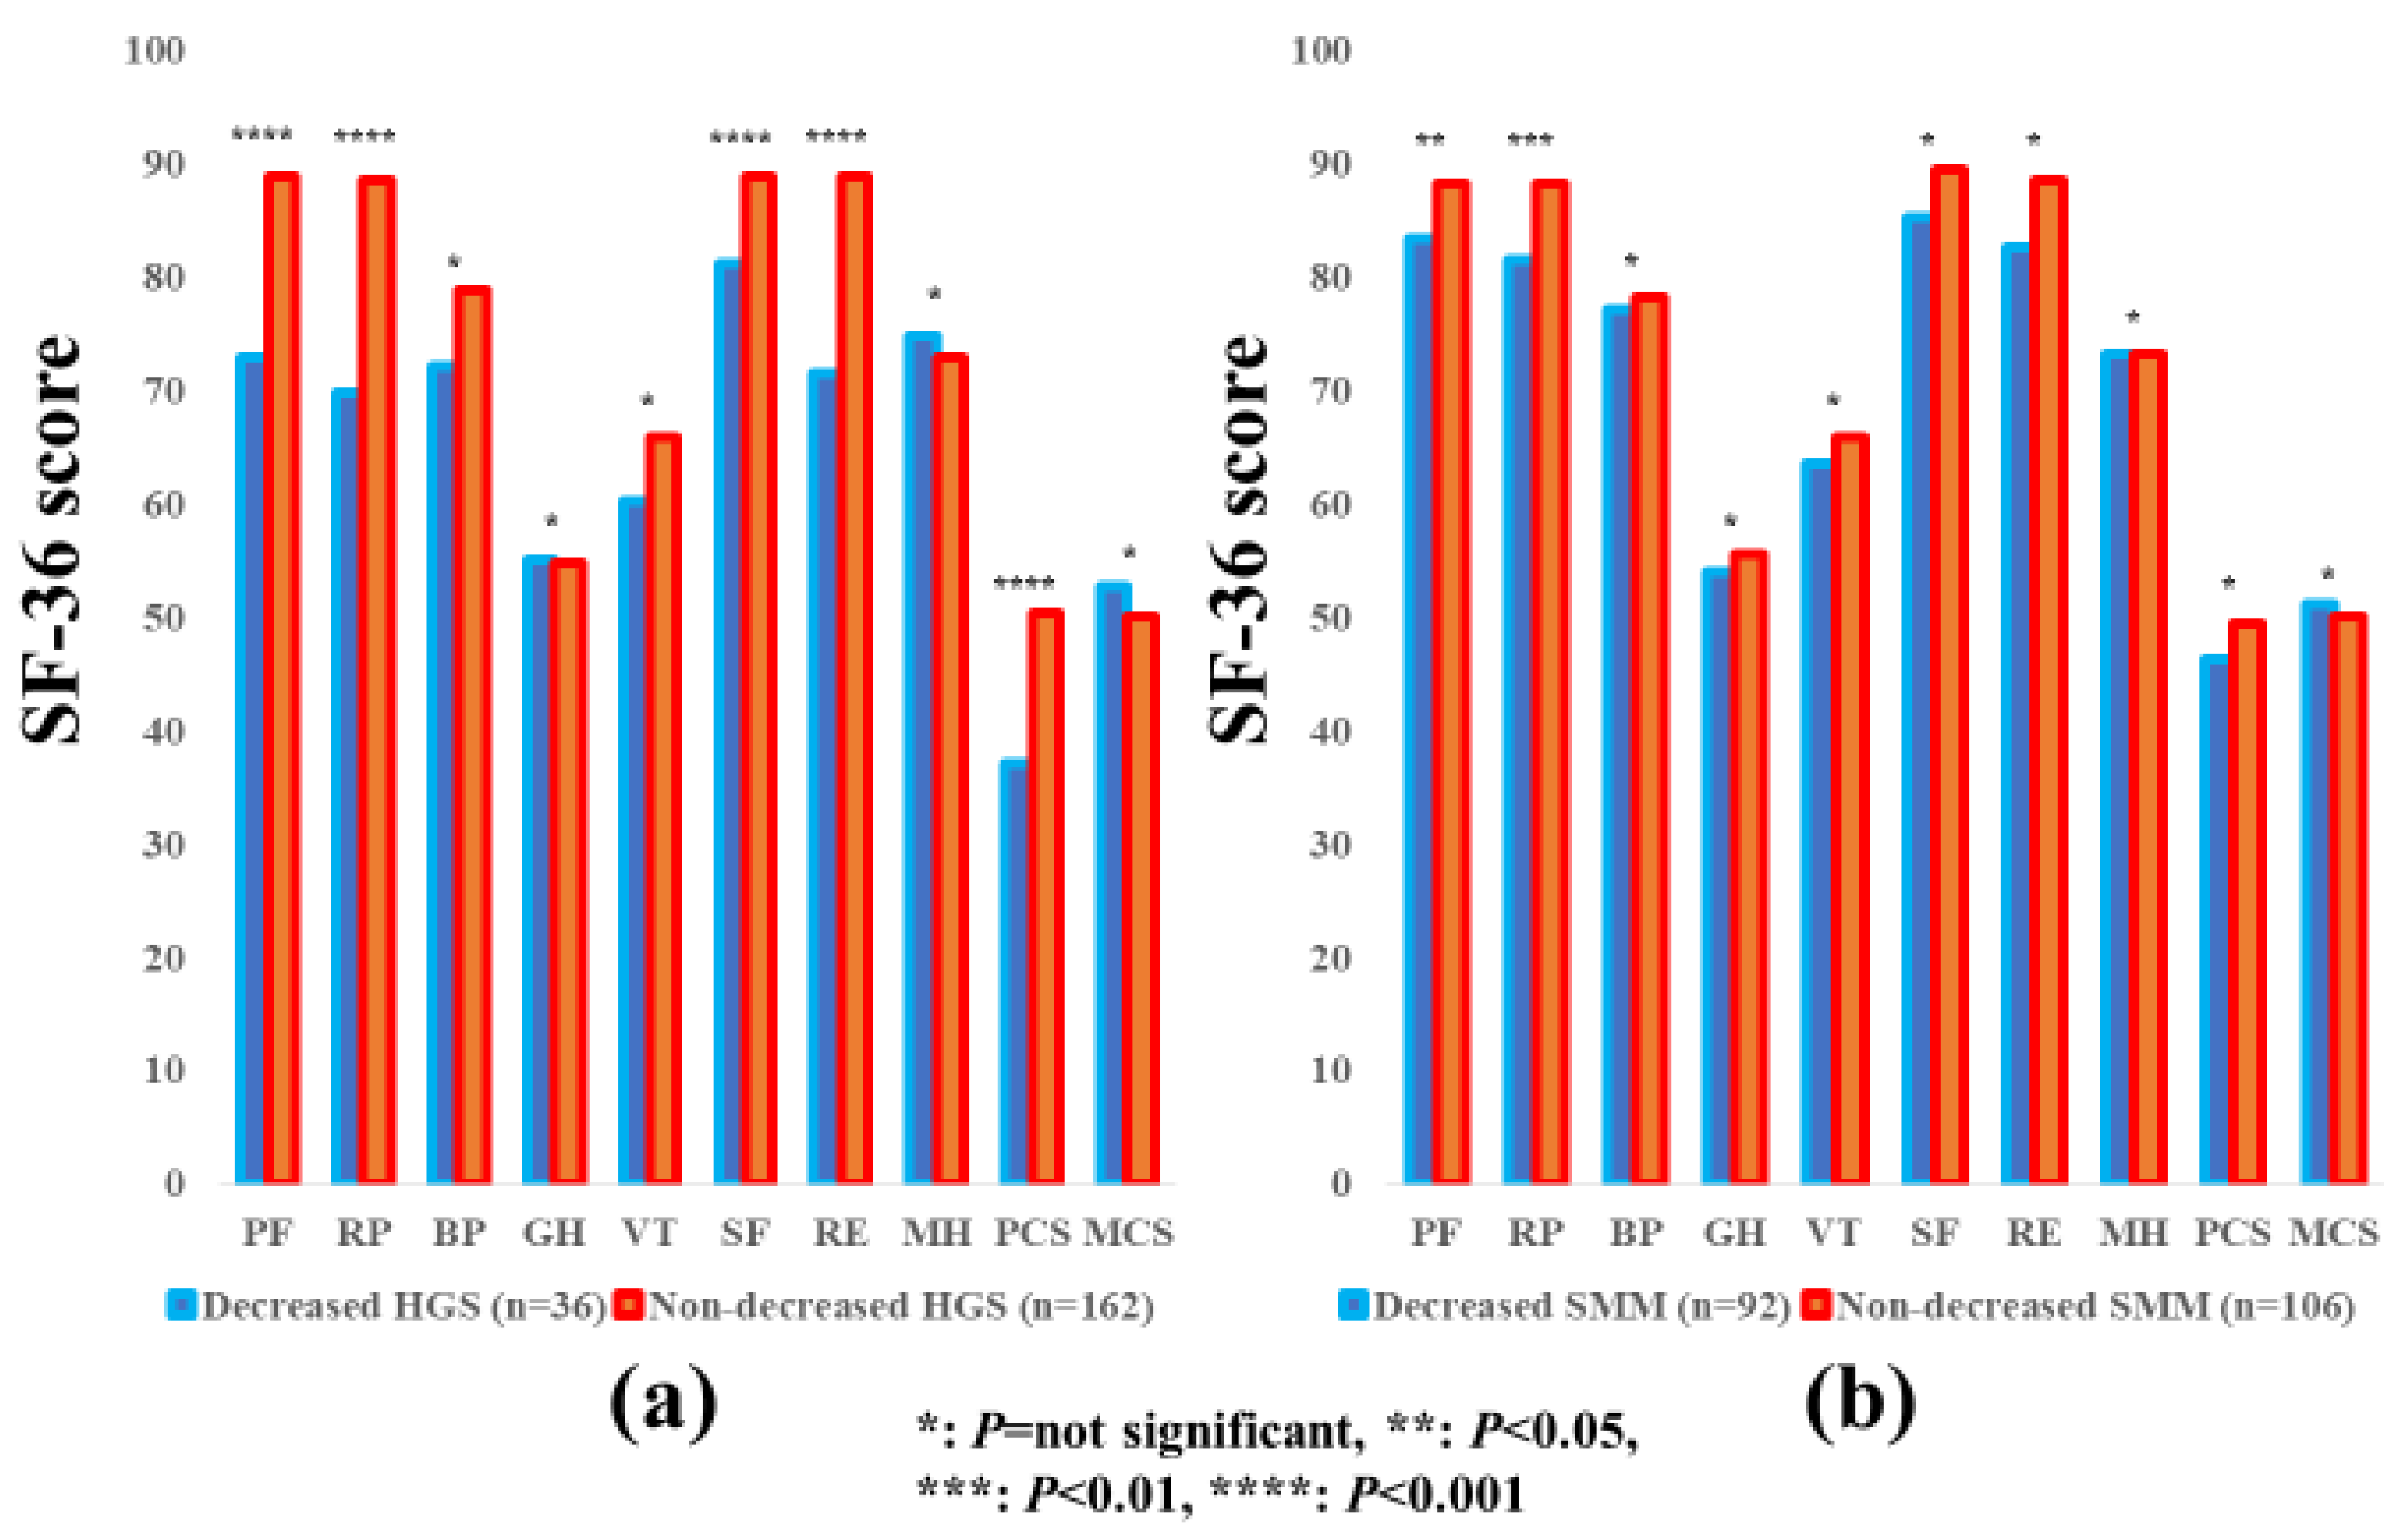
3.5. Subgroup Analysis 3: Impact of HGS and SMM on the SF-36 Scores for Male Patients
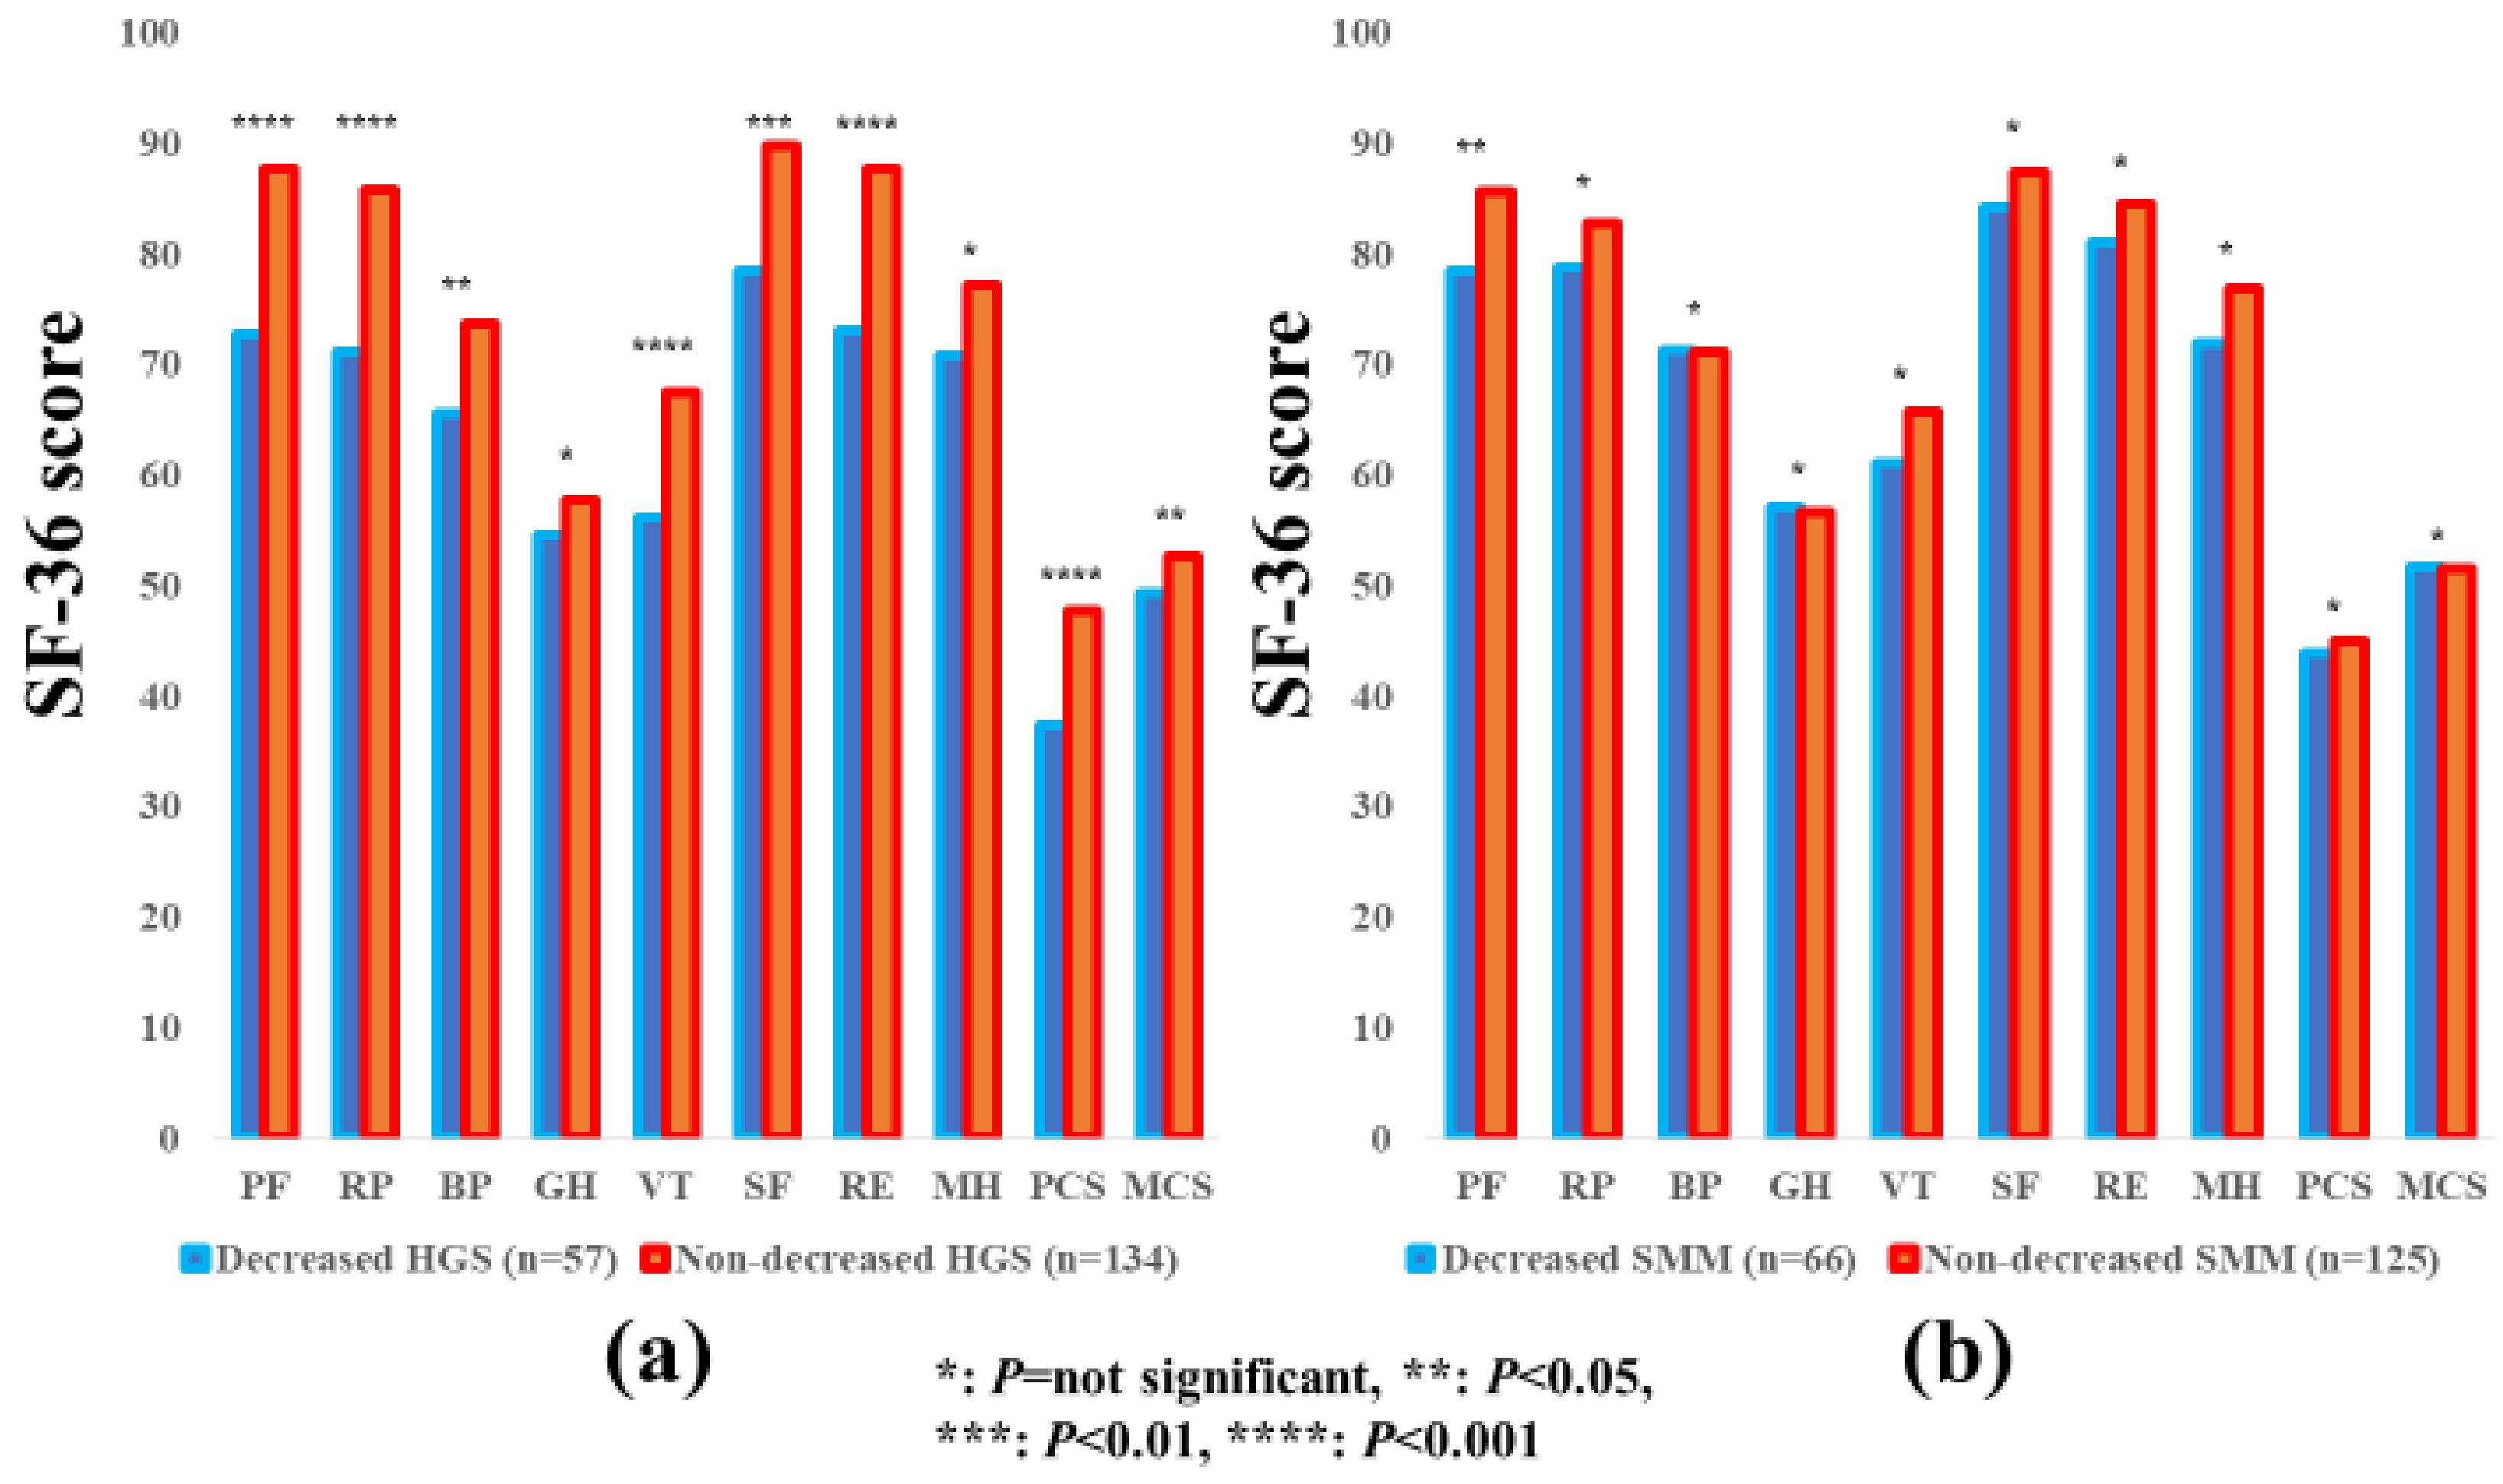
3.6. Subgroup Analysis 4: Impact of HGS and SMM on the SF-36 Scores for Female Patients
3.7. Subgroup Analysis 5: Impact of HGS and SMM on the SF-36 Scores for Patients Aged ≥65 Years
3.8. Subgroup Analysis 6: Impact of HGS and SMM on the SF-36 Scores for Patients Aged <65 Years
3.9. Relationship between the SF-36 Scores and Baseline Parameters in Male Patients and Female Patients
3.10. Multivariate Analyses of Factors Linked to the SF-36 Scores in Male Patients and Female Patients
4. Discussion
5. Conclusions
Author Contributions
Funding
Acknowledgments
Conflicts of Interest
Abbreviation
| H-QOL | health-related quality of life |
| CLD | chronic liver disease |
| SF-36 | 36-Item Short Form Health Survey |
| SMM | skeletal muscle mass |
| JSH | Japanese Society of Hepatology |
| HGS | hand grip strength |
| d-HGS | decreased HGS |
| nd-HGS | non-decreased HGS |
| BIA | bioimpedance analysis |
| BMI | body mass index |
| SMI | skeletal muscle mass index |
| d-SMM | decreased SMM |
| nd-SMM | non-decreased SMM |
| LC | liver cirrhosis |
| CONUT score | controlling nutritional score |
| PF | physical functioning |
| RP | role physical |
| BP | bodily pain |
| GH | general health perception |
| VT | vitality |
| SF | social functioning |
| RE | role emotion |
| MH | mental health |
| PCS | physical component summary score |
| MCS | mental component summary score |
| SD | standard deviation |
| CI | confidence interval |
References
- Lloyd, A.; Sawyer, W.; Hopkinson, P. Impact of long-term complications on quality of life in patients with type 2 diabetes not using insulin. Value Health 2001, 4, 392–400. [Google Scholar] [CrossRef] [PubMed]
- Zambroski, C.H.; Moser, D.K.; Bhat, G.; Ziegler, C. Impact of symptom prevalence and symptom burden on quality of life in patients with heart failure. Eur. J. Cardiovasc. Nurs. 2005, 4, 198–206. [Google Scholar] [CrossRef]
- Rebollo, P.; Ortega, F.; Baltar, J.M.; Díaz-Corte, C.; Navascués, R.A.; Naves, M.; Ureña, A.; Badía, X.; Alvarez-Ude, F.; Alvarez-Grande, J. Health-related quality of life (HRQOL) in end stage renal disease (ESRD) patients over 65 years. Geriatr. Nephrol. Urol. 1998, 8, 85–94. [Google Scholar] [CrossRef] [PubMed]
- Bottomley, A.; Pe, M.; Sloan, J.; Basch, E.; Bonnetain, F.; Calvert, M.; Campbell, A.; Cleeland, C.; Cocks, K.; Collette, L.; et al. Setting International Standards in Analyzing Patient-Reported Outcomes and Quality of Life Endpoints Data (SISAQOL) consortium. Setting International Standards in Analyzing Patient-Reported Outcomes and Quality of Life Endpoints Data (SISAQOL) consortium. Analysing data from patient-reported outcome and quality of life endpoints for cancer clinical trials: A start in setting international standards. Lancet Oncol. 2016, 17, e510–e514. [Google Scholar] [PubMed]
- Spiegel, B.M.; Younossi, Z.M.; Hays, R.D.; Revicki, D.; Robbins, S.; Kanwal, F. Impact of hepatitis C on health-related quality of life: A systematic review and quantitative assessment. Hepatology 2005, 41, 790–800. [Google Scholar] [CrossRef]
- Younossi, Z.M.; Stepanova, M.; Younossi, I.; Pan, C.Q.; Janssen, H.L.A.; Papatheodoridis, G.; Nader, F. Long-term Effects of Treatment for Chronic HBV Infection on Patient-Reported Outcomes. Clin. Gastroenterol. Hepatol. 2018, in press. [Google Scholar] [CrossRef] [PubMed]
- Schramm, C.; Wahl, I.; Weiler-Normann, C.; Voigt, K.; Wiegard, C.; Glaubke, C.; Brähler, E.; Löwe, B.; Lohse, A.W.; Rose, M. Health-related quality of life, depression, and anxiety in patients with autoimmune hepatitis. J. Hepatol. 2014, 60, 618–624. [Google Scholar] [CrossRef]
- Dyson, J.K.; Wilkinson, N.; Jopson, L.; Mells, G.; Bathgate, A.; Heneghan, M.A.; Neuberger, J.; Hirschfield, G.M.; Ducker, S.J.; UK-PBC Consortium; et al. The inter-relationship of symptom severity and quality of life in 2055 patients with primary biliary cholangitis. Aliment. Pharmacol. Ther. 2016, 44, 1039–1050. [Google Scholar] [CrossRef]
- Younossi, Z.M. Patient-reported Outcomes and the Economic Effects of Non-Alcoholic Fatty Liver Disease and Non-alcoholic Steatohepatitis—The Value Proposition. Hepatology 2018, in press. [Google Scholar] [CrossRef]
- Gao, F.; Gao, R.; Li, G.; Shang, Z.M.; Hao, J.Y. Health-related quality of life and survival in Chinese patients with chronic liver disease. Health Qual. Life Outcomes 2013, 11, 131. [Google Scholar] [CrossRef]
- Li, L.; Yeo, W. Value of quality of life analysis in liver cancer: A clinician’s perspective. World J. Hepatol. 2017, 9, 867–883. [Google Scholar] [CrossRef]
- Aber, A.; Howard, A.; Woods, H.B.; Jones, G.; Michaels, J. Impact of Carotid Artery Stenosis on Quality of Life: A Systematic Review. Patient 2018, in press. [Google Scholar] [CrossRef] [PubMed]
- Mikdashi, J. Measuring and monitoring health-related quality of life responsiveness in systemic lupus erythematosus patients: Current perspectives. Patient Relat. Outcome Meas. 2018, 9, 339–343. [Google Scholar] [CrossRef] [PubMed]
- Gerth, A.M.J.; Hatch, R.A.; Young, J.D.; Watkinson, P.J. Changes in health-related quality of life after discharge from an intensive care unit: A systematic review. Anaesthesia 2018, in press. [Google Scholar] [CrossRef]
- Paracha, N.; Abdulla, A.; MacGilchrist, K.S. Systematic review of health state utility values in metastatic non-small cell lung cancer with a focus on previously treated patients. Health Qual. Life Outcomes 2018, 16, 179. [Google Scholar] [CrossRef] [PubMed]
- Behboodi Moghadam, Z.; Fereidooni, B.; Saffari, M.; Montazeri, A. Measures of health-related quality of life in PCOS women: A systematic review. Int. J. Womens Health 2018, 10, 397–408. [Google Scholar] [CrossRef] [PubMed]
- Goodpaster, B.H.; Park, S.W.; Harris, T.B.; Kritchevsky, S.B.; Nevitt, M.; Schwartz, A.V.; Simonsick, E.M.; Tylavsky, F.A.; Visser, M.; Newman, A.B. The loss of skeletal muscle strength, mass, and quality in older adults: The health, aging and body composition study. J. Gerontol. A Biol. Sci. Med. Sci. 2006, 61, 1059–1064. [Google Scholar] [CrossRef]
- Nishikawa, H.; Shiraki, M.; Hiramatsu, A.; Moriya, K.; Hino, K.; Nishiguchi, S. Japan Society of Hepatology guidelines for sarcopenia in liver disease (1st edition): Recommendation from the working group for creation of sarcopenia assessment criteria. Hepatol. Res. 2016, 46, 951–963. [Google Scholar] [CrossRef] [PubMed]
- Montano-Loza, A.J. Clinical relevance of sarcopenia in patients with cirrhosis. World J. Gastroenterol. 2014, 20, 8061–8071. [Google Scholar] [CrossRef]
- Cruz-Jentoft, A.J.; Landi, F.; Schneider, S.M.; Zúñiga, C.; Arai, H.; Boirie, Y.; Chen, L.K.; Fielding, R.A.; Martin, F.C.; Michel, J.P.; et al. Prevalence of and interventions for sarcopenia in ageing adults: A systematic review. Report of the International Sarcopenia Initiative (EWGSOP and IWGS). Age Ageing 2014, 43, 748–759. [Google Scholar] [CrossRef]
- Sinclair, M.; Gow, P.J.; Grossmann, M.; Angus, P.W. Review article: Sarcopenia in cirrhosis—Aetiology, implications and potential therapeutic interventions. Aliment. Pharmacol. Ther. 2016, 43, 765–777. [Google Scholar] [CrossRef] [PubMed]
- Chen, L.K.; Liu, L.K.; Woo, J.; Assantachai, P.; Auyeung, T.W.; Bahyah, K.S.; Chou, M.Y.; Chen, L.Y.; Hsu, P.S.; Krairit, O.; et al. Sarcopenia in Asia: Consensus Report of the Asian Working Group for Sarcopenia. J. Am. Med. Dir. Assoc. 2014, 15, 95–101. [Google Scholar] [CrossRef] [PubMed]
- Nishikawa, H.; Enomoto, H.; Ishii, A.; Iwata, Y.; Miyamoto, Y.; Ishii, N.; Yuri, Y.; Hasegawa, K.; Nakano, C.; Nishimura, T.; et al. Elevated serum myostatin level is associated with worse survival in patients with liver cirrhosis. J. Cachexia. Sarcopenia. Muscle 2017, 8, 915–925. [Google Scholar] [CrossRef] [PubMed]
- Norman, K.; Otten, L. Financial impact of sarcopenia or low muscle mass—A short review. Clin. Nutr. 2018, in press. [Google Scholar] [CrossRef] [PubMed]
- Shirai, H.; Kaido, T.; Hamaguchi, Y.; Kobayashi, A.; Okumura, S.; Yao, S.; Yagi, S.; Kamo, N.; Taura, K.; Okajima, H.; et al. Preoperative Low Muscle Mass and Low Muscle Quality Negatively Impact on Pulmonary Function in Patients Undergoing Hepatectomy for Hepatocellular Carcinoma. Liver Cancer 2018, 7, 76–89. [Google Scholar] [CrossRef] [PubMed]
- De Bandt, J.P.; Jegatheesan, P.; Tennoune-El-Hafaia, N. Muscle Loss in Chronic Liver Diseases: The Example of Nonalcoholic Liver Disease. Nutrients 2018, in press. [Google Scholar] [CrossRef] [PubMed]
- Chang, K.V.; Chen, J.D.; Wu, W.T.; Huang, K.C.; Hsu, C.T.; Han, D.S. Association between Loss of Skeletal Muscle Mass and Mortality and Tumor Recurrence in Hepatocellular Carcinoma: A Systematic Review and Meta-Analysis. Liver Cancer 2018, 7, 90–103. [Google Scholar] [CrossRef]
- Anderson, L.J.; Liu, H.; Garcia, J.M. Sex Differences in Muscle Wasting. Adv. Exp. Med. Biol 2017, 1043, 153–197. [Google Scholar]
- Tsugawa, A.; Ogawa, Y.; Takenoshita, N.; Kaneko, Y.; Hatanaka, H.; Jaime, E.; Fukasawa, R.; Hanyu, H. Decreased muscle strength and quality in diabetes-related dementia. Dement. Geriatr. Cogn. Dis. Extra 2017, 7, 454–462. [Google Scholar] [CrossRef]
- Cantarero-Villanueva, I.; Fernández-Lao, C.; Díaz-Rodríguez, L.; Fernández-de-Las-Peñas, C.; Ruiz, J.R.; Arroyo-Morales, M. The handgrip strength test as a measure of function in breast cancer survivors: Relationship to cancer-related symptoms and physical and physiologic parameters. Am. J. Phys. Med. Rehabil. 2012, 91, 774–782. [Google Scholar] [CrossRef]
- Tada, T.; Kumada, T.; Toyoda, H.; Kiriyama, S.; Tanikawa, M.; Hisanaga, Y.; Kanamori, A.; Kitabatake, S.; Yama, T.; Tanaka, J. Long-term prognosis of patients with chronic hepatitis C who did not receive interferon-based therapy: Causes of death and analysis based on the FIB-4 index. J. Gastroenterol. 2016, 51, 380–389. [Google Scholar] [CrossRef] [PubMed]
- González-Madroño, A.; Mancha, A.; Rodríguez, F.J.; Culebras, J.; de Ulibarri, J.I. Confirming the validity of the CONUT system for early detection and monitoring of clinical undernutrition: Comparison with two logistic regression models developed using SGA as the gold standard. Nutr. Hosp. 2012, 27, 564–571. [Google Scholar] [PubMed]
- Fukuhara, S.; Ware, J.E., Jr.; Kosinski, M.; Wada, S.; Gandek, B. Psychometric and clinical tests of validity of the Japanese SF-36 Health Survey. J. Clin. Epidemiol. 1998, 51, 1045–1053. [Google Scholar] [CrossRef]
- Anand, A.C. Nutrition and muscle in cirrhosis. J. Clin. Exp. Hepatol. 2017, 7, 340–357. [Google Scholar] [CrossRef] [PubMed]
- Hanai, T.; Shiraki, M.; Miwa, T.; Watanabe, S.; Imai, K.; Suetsugu, A.; Takai, K.; Moriwaki, H.; Shimizu, M. Effect of loop diuretics on skeletal muscle depletion in patients with liver cirrhosis. Hepatol. Res. 2018, in press. [Google Scholar] [CrossRef] [PubMed]
- Fukui, H.; Saito, H.; Ueno, Y.; Uto, H.; Obara, K.; Sakaida, I.; Shibuya, A.; Seike, M.; Nagoshi, S.; Segawa, M.; et al. Evidence-based clinical practice guidelines for liver cirrhosis 2015. J. Gastroenterol. 2016, 51, 629–650. [Google Scholar] [CrossRef] [PubMed]
- Vidot, H.; Carey, S.; Allman-Farinelli, M.; Shackel, N. Systematic review: The treatment of muscle cramps in patients with cirrhosis. Aliment. Pharmacol. Ther. 2014, 40, 221–232. [Google Scholar] [CrossRef]
- Tandon, P.; Ismond, K.P.; Riess, K.; Duarte-Rojo, A.; Al-Judaibi, B.; Dunn, M.A.; Holman, J.; Howes, N.; Haykowsky, M.J.F.; Josbeno, D.A.; et al. Exercise in cirrhosis: Translating evidence and experience to practice. J. Hepatol. 2018, 69, 1164–1177. [Google Scholar] [CrossRef]
- Iwasa, M.; Karino, Y.; Kawaguchi, T.; Nakanishi, H.; Miyaaki, H.; Shiraki, M.; Nakajima, T.; Sawada, Y.; Yoshiji, H.; Okita, K.; et al. Relationship of muscle cramps to quality of life and sleep disturbance in patients with chronic liver diseases: A nationwide study. Liver Int. 2018, in press. [Google Scholar] [CrossRef]
- Sinclair, M.; Grossmann, M.; Hoermann, R.; Angus, P.W.; Gow, P.J. Testosterone therapy increases muscle mass in men with cirrhosis and low testosterone: A randomised controlled trial. J. Hepatol. 2016, 65, 906–913. [Google Scholar] [CrossRef]
- Durazzo, M.; Belci, P.; Collo, A.; Prandi, V.; Pistone, E.; Martorana, M.; Gambino, R.; Bo, S. Gender specific medicine in liver diseases: A point of view. World J. Gastroenterol. 2014, 20, 2127–2135. [Google Scholar] [CrossRef] [PubMed]


| Variables | All Cases (n = 389) | Decreased HGS (n = 93) | Non-Decreased HGS (n = 296) | p Value | Decreased SMM (n = 159) | Non-decreased SMM (n = 230) | p Value |
|---|---|---|---|---|---|---|---|
| Age (years) | 62.0 ± 12.8 | 69.7 ± 10.6 | 59.5 ± 12.5 | <0.0001 | 66.7 ± 12.2 | 58.7 ± 12.2 | <0.0001 |
| Gender, male/female | 198/191 | 36/57 | 162/134 | 0.0087 | 93/66 | 105/125 | 0.0135 |
| Etiology, HBV/HCV/HBV, and HCV/NBNC | 61/234/8/86 | 10/60/2/21 | 51/174/6/65 | 0.5130 | 21/101/5/32 | 40/133/3/54 | 0.3102 |
| Presence of LC, yes/no | 148/241 | 61/32 | 87/209 | <0.0001 | 65/94 | 83/147 | 0.3416 |
| Body mass index (kg/m2) | 23.2 ± 3.8 | 22.7 ± 3.3 | 23.3 ± 4.0 | 0.1554 | 20.9 ± 2.4 | 24.8 ± 3.8 | <0.0001 |
| Total bilirubin (mg/dL) | 0.96 ± 0.58 | 0.96 ± 0.62 | 0.96 ± 0.57 | 0.9545 | 0.86 ± 0.39 | 1.02 ± 0.68 | 0.0718 |
| Serum albumin (g/dL) | 4.1 ± 0.5 | 3.9 ± 0.57 | 4.2 ± 0.45 | <0.0001 | 4.2 ± 0.48 | 4.1 ± 0.52 | 0.2688 |
| Prothrombin time (%) | 86.7 ± 16.6 | 84.1 ± 17.1 | 87.5 ± 16.3 | 0.0790 | 87.5 ± 16.9 | 86.1 ± 16.3 | 0.4112 |
| Platelet count (×104/mm3) | 16.8 ± 6.9 | 15.1 ± 6.5 | 17.3 ± 6.9 | 0.0081 | 16.7 ± 6.2 | 16.8 ± 7.3 | 0.7315 |
| White blood cell (/mm3) | 5165 ± 1614 | 5193 ± 1659 | 5156 ± 1602 | 0.8455 | 5240 ± 1466 | 5113 ± 1710 | 0.3114 |
| Lymphocyte count (/mm3) | 3112 ± 958 | 1395 ± 598 | 1627 ± 613 | 0.0015 | 1513 ± 542 | 1613 ± 661 | 0.2045 |
| Total cholesterol (mg/dL) | 181.3 ± 41.3 | 170.5 ± 47.2 | 184.7 ± 38.8 | 0.0038 | 182.0 ± 43.9 | 180.8 ± 39.5 | 0.7775 |
| CONUT score | 1.9 ± 1.9 | 2.7 ± 2.5 | 1.6 ± 1.6 | 0.0003 | 1.9 ± 1.7 | 1.9 ± 2.0 | 0.8450 |
| AST (IU/L) | 37.7 ± 27.3 | 40.3 ± 29.2 | 36.8 ± 26.6 | 0.2886 | 36.9 ± 26.1 | 38.2 ± 28.1 | 0.6286 |
| ALT (IU/L) | 37.3 ± 37.3 | 35.0 ± 38.4 | 38.1 ± 37.0 | 0.4966 | 35.4 ± 36.3 | 38.7 ± 38.0 | 0.3828 |
| FIB-4 index | 3.3 ± 3.3 | 4.0 ± 2.8 | 3.1 ± 3.4 | 0.0142 | 3.2 ± 2.2 | 3.4 ± 3.9 | 0.0215 |
| Serum creatinine (mg/dL) | 0.73 ± 0.54 | 0.76 ± 0.53 | 0.72 ± 0.55 | 0.4769 | 0.81 ± 0.81 | 0.67 ± 0.18 | 0.0095 |
| HbA1c (NGSP) | 5.9 ± 0.88 | 5.9 ± 0.80 | 5.8 ± 0.90 | 0.7085 | 5.9 ± 0.84 | 5.8 ± 0.90 | 0.7085 |
| Serum sodium (mmol/L) | 140.1 ± 2.3 | 139.9 ± 2.5 | 140.2 ± 2.3 | 0.2330 | 140.3 ± 2.4 | 140.0 ± 2.3 | 0.3413 |
| HGS (kg), male | 33.6 ± 8.7 | 22.0 ± 3.9 | 36.3 ± 6.4 | <0.0001 | 29.4 ± 6.9 | 37.4 ± 7.5 | <0.0001 |
| HGS (kg), female | 20.9 ± 5.2 | 14.8 ± 3.1 | 23.3 ± 3.6 | <0.0001 | 18.2 ± 4.1 | 22.4 ± 5.1 | <0.0001 |
| SMI (kg/m2), male | 7.5 ± 1.1 | 7.0 ± 0.97 | 7.6 ± 1.09 | 0.0039 | 6.8 ± 0.43 | 8.1 ± 1.13 | <0.0001 |
| SMI (kg/m2), female | 6.0 ± 0.7 | 5.6 ± 0.74 | 6.1 ± 0.68 | <0.0001 | 5.2 ± 0.39 | 6.4 ± 0.50 | <0.0001 |
| ALL Cases | LC Patients (n = 148) | Non-LC Patients (n = 241) | p Value |
|---|---|---|---|
| PF | 79.9 ± 20.2 [76.6, 83.2] | 87.5 ± 15.8 [85.5, 89.5] | <0.0001 |
| RP | 77.0 ± 30.7 [72.0, 82.0] | 87.2 ± 21.4 [84.5, 90.0] | 0.0005 |
| BP | 71.6 ± 26.1 [67.3, 75.9] | 76.3 ± 23.9 [73.3, 79.3] | 0.0709 |
| GH | 51.6 ± 19.7 [48.4, 54.8] | 58.4 ± 19.1 [55.9, 60.9] | 0.0011 |
| VT | 59.3 ± 22.6 [55.6, 63.0] | 67.6 ± 20.5 [65.0, 70.2] | 0.0002 |
| SF | 82.9 ± 25.1 [78.8, 87.0] | 89.4 ± 19.4 [86.9, 91.9] | 0.0004 |
| RE | 78.6 ± 28.3 [74.0, 83.3] | 88.1 ± 21.4 [85.4, 90.8] | <0.0001 |
| MH | 73.0 ± 20.6 [69.6, 76.4] | 74.9 ± 20.7 [72.2, 77.5] | 0.3845 |
| PCS | 42.3 ± 16.2 [39.6, 45.1] | 48.7 ± 11.9 [47.1, 50.2] | <0.0001 |
| MCS | 49.9 ± 10.1 [48.2, 51.6] | 51.8 ± 10.4 [50.4, 53.1] | 0.0891 |
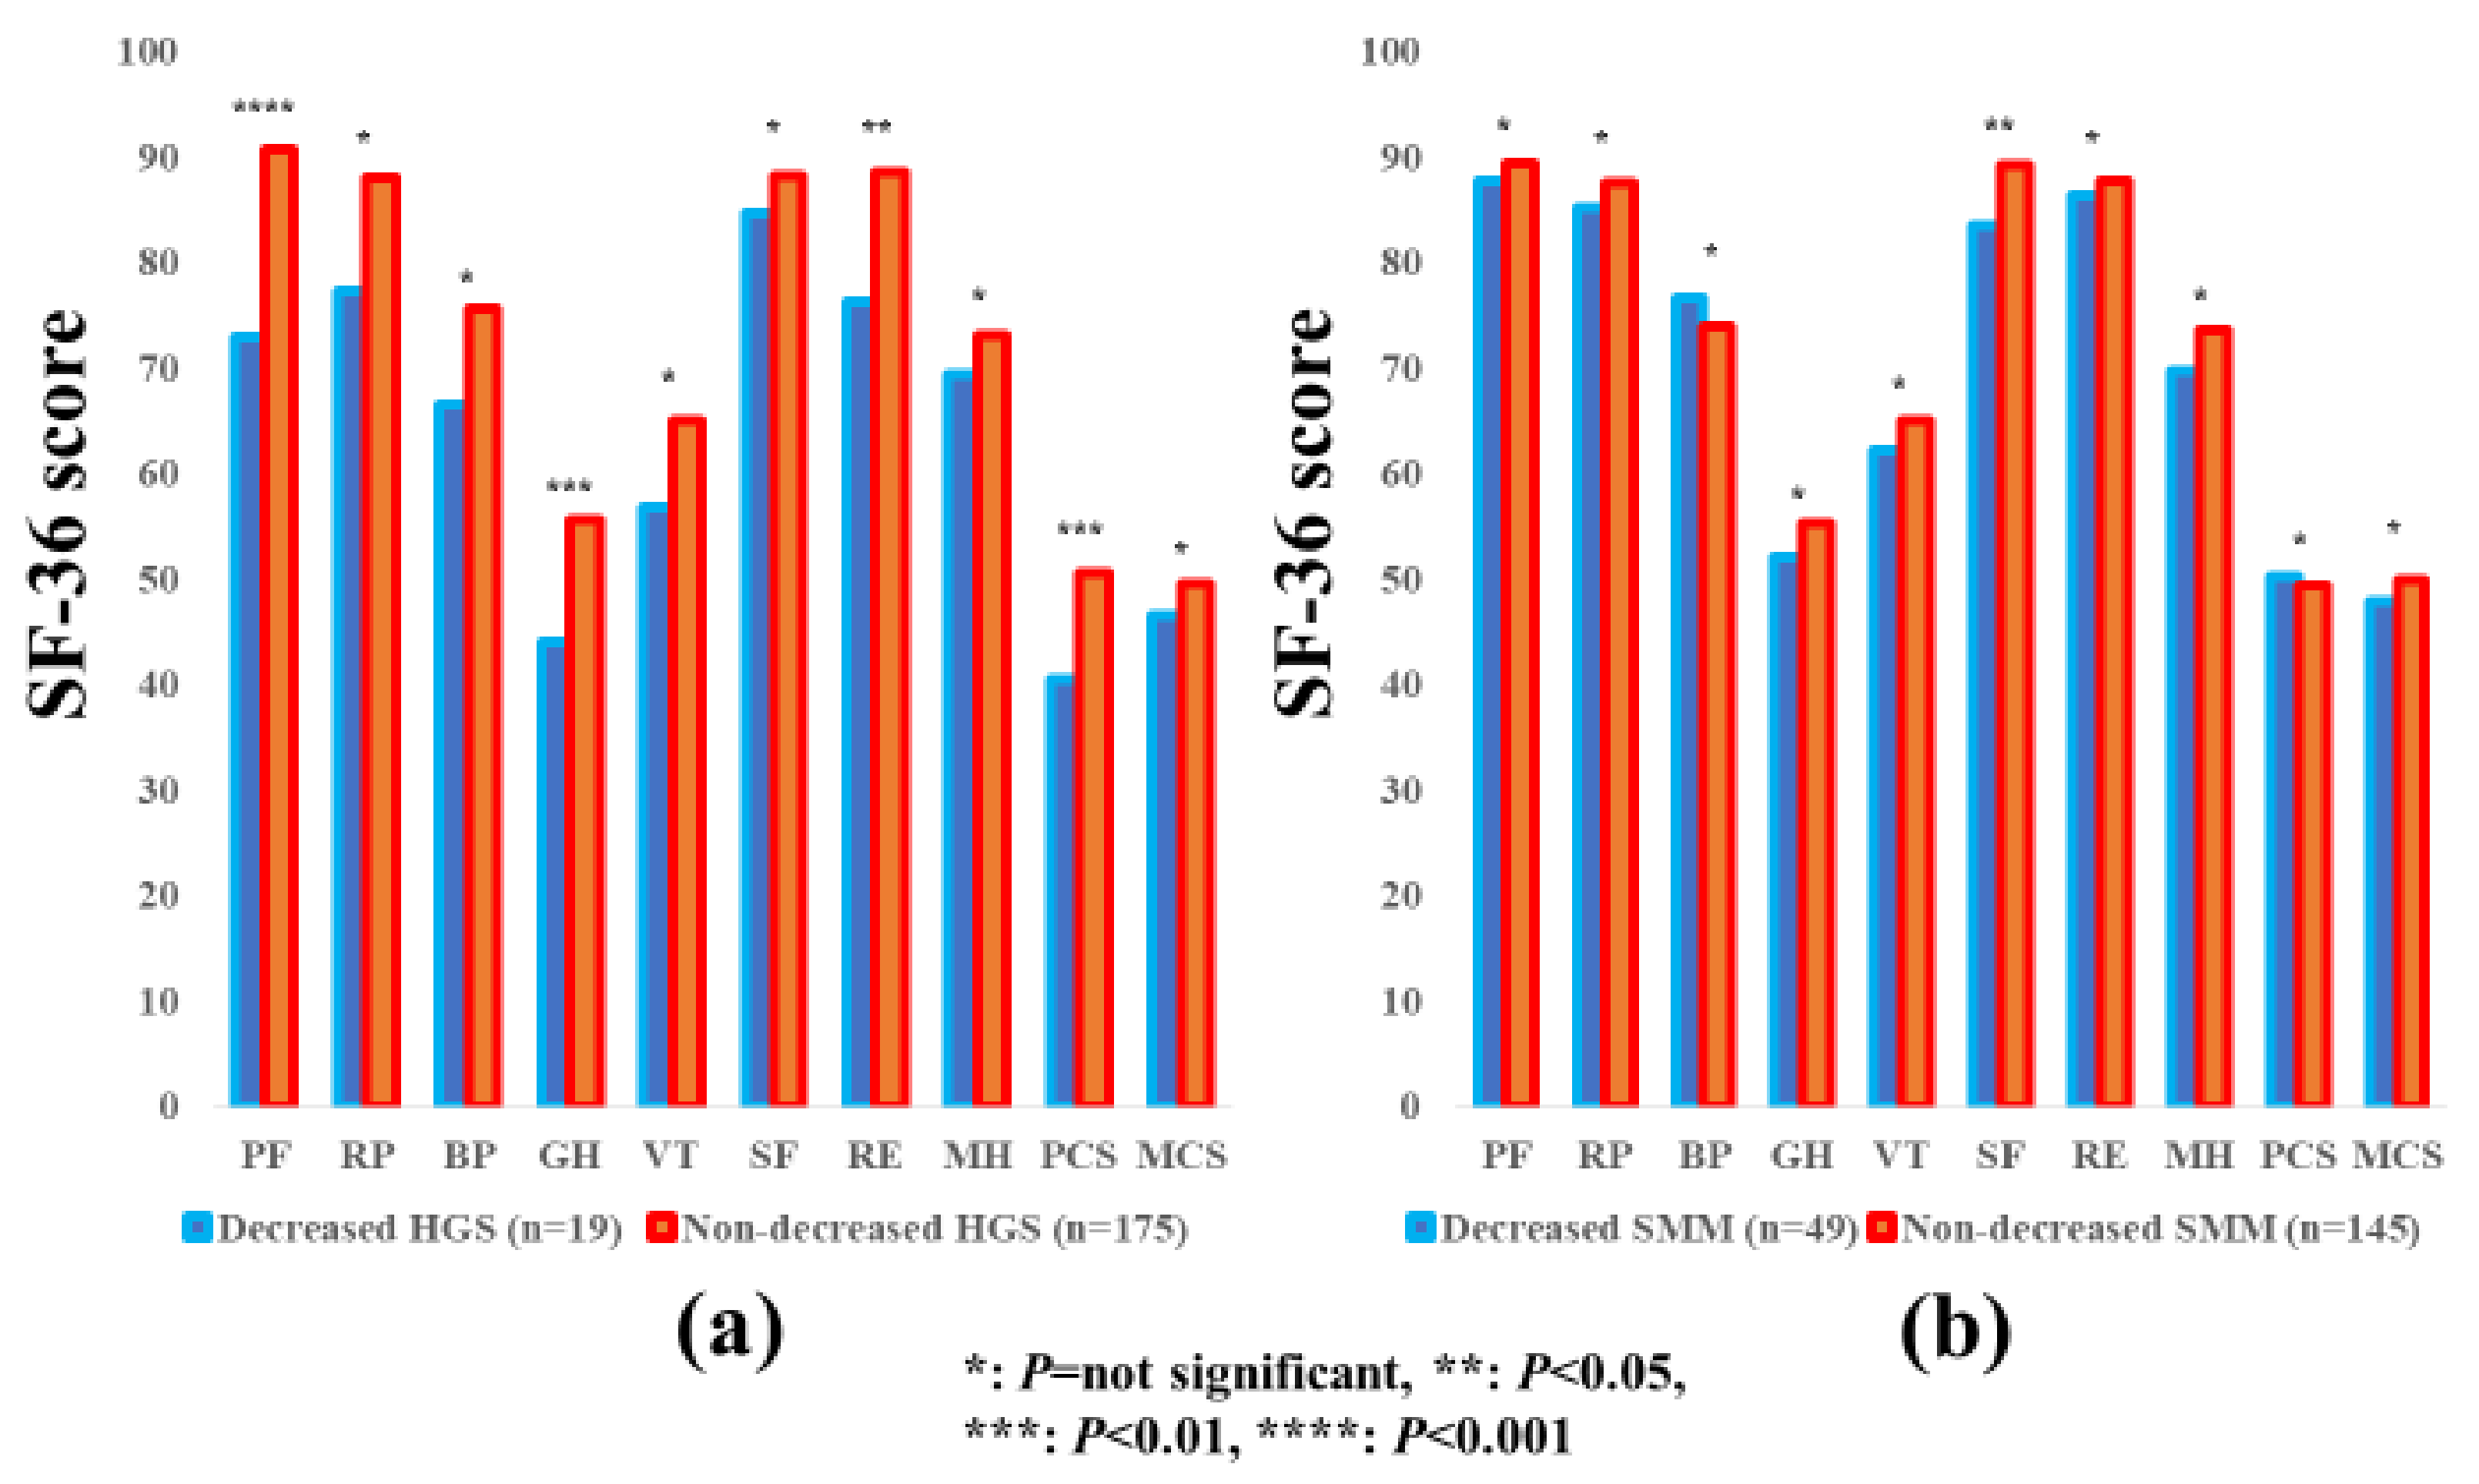
| ALL Cases | Decreased HGS (n = 93) | Non-Decreased HGS (n = 296) | p Value |
| PF | 72.8 ± 22.6 [68.1, 77.5] | 88.3 ± 14.3 [86.7, 90.0] | <0.0001 |
| RP | 70.6 ± 33.1 [63.7, 77.4] | 87.3 ± 21.7 [84.8, 89.8] | <0.0001 |
| BP | 68.1 ± 24.0 [63.2, 73.1] | 76.5 ± 24.8 [73.7, 79.4] | 0.0043 |
| GH | 54.8 ± 22.7 [50.1, 59.5] | 56.1 ± 18.5 [53.9, 58.2] | 0.6190 |
| VT | 57.7 ± 25.1 [52.5, 62.9] | 66.6 ± 20.0 [64.3, 68.9] | 0.0011 |
| SF | 79.5 ± 25.4 [74.2, 84.8] | 89.3 ± 20.2 [86.9, 91.6] | <0.0001 |
| RE | 72.4 ± 30.3 [66.1, 78.8] | 88.3 ± 21.2 [85.9, 90.7] | <0.0001 |
| MH | 72.3 ± 24.1 [67.3, 77.3] | 74.7 ± 19.4 [72.5, 77.0] | 0.7439 |
| PCS | 37.3 ± 16.7 [33.8, 40.8] | 49.2 ± 11.7 [47.8, 50.6] | <0.0001 |
| MCS | 50.5 ± 11.0 [48.2, 52.9] | 51.2 ± 10.1 [50.5, 52.4] | 0.5941 |
| ALL Cases | Decreased SMM (n = 159) | Non-Decreased SMM (n = 230) | p Value |
| PF | 81.3 ± 18.1 [78.5, 84.2] | 86.8 ± 17.5 [84.6, 89.1] | 0.0032 |
| RP | 80.4 ± 27.2 [76.2, 84.7] | 85.3 ± 24.7 [82.1, 88.6] | 0.0660 |
| BP | 74.7 ± 25.1 [70.8, 78.7] | 74.4 ± 24.6 [71.2, 77.6] | 0.8891 |
| GH | 55.2 ± 20.4 [52.0, 58.5] | 56.1 ± 19.1 [53.6, 58.7] | 0.6656 |
| VT | 62.6 ± 23.6 [58.9, 66.3] | 65.8 ± 20.2 [63.2, 68.4] | 0.3364 |
| SF | 84.9 ± 24.7 [80.9, 88.8] | 88.3 ± 19.7 [85.7, 91.0] | 0.0031 |
| RE | 82.0 ± 26.6 [77.8, 86.1] | 86.4 ± 23.0 [83.3, 89.4] | 0.0030 |
| MH | 72.7 ± 22.4 [69.2, 76.2] | 75.2 ± 19.3 [72.7, 77.7] | 0.4683 |
| PCS | 45.3 ± 14.2 [43.0, 47.6] | 47.0 ± 13.9 [45.1, 48.8] | 0.2610 |
| MCS | 51.3 ± 10.5 [49.6, 53.0] | 50.8 ± 10.1 [49.5, 52.2] | 0.6601 |
| LC | Decreased HGS (n = 61) | Non-Decreased HGS (n = 87) | p Value |
| PF | 71.1 ± 23.1 [65.2, 77.1] | 86.2 ± 15.0 [82.9, 89.4] | 0.0002 |
| RP | 68.0 ± 34.0 [59.3, 76.7] | 83.4 ± 26.5 [77.7, 89.1] | 0.0006 |
| BP | 65.3 ± 22.8 [59.5, 71.2] | 76.1 ± 27.5 [70.2, 82.0] | 0.0002 |
| GH | 51.0 ± 19.9 [46.0, 56.1] | 52.0 ± 19.7 [47.7, 56.3] | 0.7691 |
| VT | 53.8 ± 23.7 [47.7, 59.9] | 63.2 ± 21.1 [58.7, 67.7] | 0.0132 |
| SF | 76.7 ± 26.8 [69.8, 83.6] | 87.4 ± 22.9 [82.4, 92.3] | 0.0112 |
| RE | 67.2 ± 30.9 [59.3, 75.2] | 86.7 ± 23.3 [81.7, 91.7] | <0.0001 |
| MH | 71.1 ± 22.8 [65.2, 77.0] | 74.3 ± 18.9 [70.3, 78.4] | 0.3514 |
| PCS | 34.9 ± 16.5 [30.7, 39.2] | 47.9 ± 13.7 [44.8, 50.9] | <0.0001 |
| MCS | 49.3 ± 9.7 [46.8, 51.8] | 50.3 ± 10.5 [48.0, 52.7] | 0.5382 |
| LC | Decreased SMM (n = 66) | Non-Decreased SMM (n = 82) | p Value |
| PF | 75.7 ± 20.7 [70.5, 80.8] | 83.2 ± 19.2 [79.0, 87.4] | 0.0252 |
| RP | 72.1 ± 31.6 [64.3, 80.0] | 80.9 ± 29.6 [74.4, 87.4] | 0.0867 |
| BP | 72.3 ± 26.1 [65.8, 78.8] | 71.1 ± 26.3 [65.3, 76.8] | 0.7832 |
| GH | 51.0 ± 20.0 [46.1, 56.0] | 52.1 ± 19.6 [47.7, 56.4] | 0.7589 |
| VT | 56.3 ± 24.3 [50.2, 62.4] | 61.7 ± 21.0 [57.1, 66.3] | 0.1519 |
| SF | 81.1 ± 28.4 [74.1, 88.3] | 84.3 ± 22.1 [79.4, 89.2] | 0.4615 |
| RE | 73.1 ± 31.9 [65.2, 81.1] | 83.0 ± 24.4 [77.6, 88.4] | 0.0131 |
| MH | 71.1 ± 23.7 [65.2, 77.0] | 74.5 ± 17.8 [70.6, 78.4] | 0.6602 |
| PCS | 41.5 ± 17.2 [37.2, 45.8] | 43.0 ± 15.5 [39.5, 46.6] | 0.5729 |
| MCS | 50.4 ± 10.4 [47.8, 53.1] | 49.4 ± 9.9 [47.2, 51.7] | 0.5615 |
| Non-LC | Decreased HGS (n = 32) | Non-Decreased HGS (n = 209) | p Value |
| PF | 76.1 ± 21.6 [68.1, 84.0] | 89.2 ± 14.0 [87.3, 91.1] | <0.0001 |
| RP | 75.7 ± 30.9 [64.4, 87.1] | 88.9 ± 19.2 [86.3, 91.6] | <0.0001 |
| BP | 73.5 ± 25.6 [64.3, 82.7] | 76.7 ± 23.6 [73.5, 79.9] | 0.4782 |
| GH | 62.0 ± 26.2 [52.5, 71.5] | 57.8 ± 17.7 [55.3, 60.3] | 0.0876 |
| VT | 65.0 ± 26.5 [55.5, 74.6] | 68.0 ± 19.4 [65.4, 70.7] | 0.4422 |
| SF | 84.9 ± 22.1 [76.8, 93.0] | 90.1 ± 18.9 [87.5, 92.7] | 0.1629 |
| RE | 82.5 ± 27.0 [72.6, 92.4] | 89.0 ± 20.3 [86.2, 91.7] | 0.0002 |
| MH | 74.6 ± 26.6 [65.0, 84.2] | 74.9 ± 19.7 [72.2, 77.6] | 0.4130 |
| PCS | 41.9 ± 16.4 [35.8, 48.0] | 49.7 ± 10.6 [48.2, 51.2] | 0.0018 |
| MCS | 53.1 ± 13.1 [48.2, 58.0] | 51.6 ± 9.9 [40.2, 52.9] | 0.3525 |
| Non-LC | Decreased SMM (n = 94) | Non-Decreased SMM (n = 147) | p Value |
| PF | 85.3 ± 14.9 [82.2, 88.3] | 88.9 ± 16.2 [86.3, 91.5] | 0.0830 |
| RP | 86.2 ± 21.9 [81.7, 90.7] | 87.9 ± 21.2 [84.4, 91.3] | 0.5689 |
| BP | 76.6 ± 24.4 [71.4, 81.5] | 76.2 ± 23.6 [72.4, 80.1] | 0.9476 |
| GH | 58.3 ± 20.2 [54.0, 62.5] | 58.4 ± 18.5 [55.4, 61.5] | 0.9482 |
| VT | 66.9 ± 22.2 [62.4, 71.5] | 68.1 ± 19.4 [64.9, 71.2] | 0.6748 |
| SF | 87.7 ± 21.5 [83.0, 91.9] | 90.7 ± 17.8 [87.7, 93.6] | 0.2185 |
| RE | 87.9 ± 20.5 [83.8, 92.1] | 88.2 ± 22.0 [84.6, 91.8] | 0.9205 |
| MH | 73.8 ± 21.5 [69.3, 78.2] | 75.6 ± 20.2 [72.3, 78.9] | 0.5102 |
| PCS | 48.0 ± 11.1 [45.7, 50.3] | 49.1 ± 12.4 [47.1, 51.2] | 0.4689 |
| MCS | 52.0 ± 10.6 [49.7, 54.2] | 51.6 ± 10.2 [49.9, 53.3] | 0.8203 |
| Male | Decreased HGS (n = 36) | Non-Decreased HGS (n = 162) | p Value |
| PF | 72.9 ± 23.7 [64.9, 80.9] | 88.9 ± 13.9 [86.7, 91.1] | <0.0001 |
| RP | 69.8 ± 34.9 [58.0, 81.6] | 88.6 ± 20.1 [85.4, 91.7] | <0.0001 |
| BP | 72.2 ± 26.0 [63.4, 81.0] | 78.9 ± 23.6 [75.2, 82.5] | 0.1328 |
| GH | 55.1 ± 23.1 [47.3, 62.9] | 54.7 ± 18.3 [51.8, 57.6] | 0.9145 |
| VT | 60.2 ± 26.3 [51.1, 69.2] | 65.8 ± 20.5 [62.7, 69.0] | 0.1614 |
| SF | 81.2 ± 27.2 [71.8, 90.5] | 88.9 ± 20.3 [85.7, 92.1] | <0.0001 |
| RE | 71.5 ± 33.2 [60.1, 82.9] | 88.9 ± 20.8 [85.6, 92.1] | <0.0001 |
| MH | 74.8 ± 24.0 [66.6, 83.1] | 72.9 ± 20.0 [69.7, 76.0] | 0.6112 |
| PCS | 37.0 ± 18.7 [30.6, 43.4] | 50.4 ± 11.6 [48.5, 52.3] | <0.0001 |
| MCS | 52.7 ± 11.5 [48.8, 56.7] | 50.1 ± 10.3 [48.4, 51.7] | 0.1817 |
| Male | Decreased SMM (n = 92) | Non-Decreased SMM (n = 106) | p Value |
| PF | 83.4 ± 16.5 [80.0. 86.8] | 88.3 ± 17.5 [84.9, 91.7] | 0.0451 |
| RP | 81.6 ± 26.8 [76.1, 87.1] | 88.3 ± 21.8 [84.1, 92.6] | 0.0035 |
| BP | 77.1 ± 24.8 [72.0, 82.2] | 78.2 ± 23.6 [73.6, 82.7] | 0.7508 |
| GH | 53.9 ± 20.9 [49.6, 58.3] | 55.5 ± 17.8 [52.0, 59.0] | 0.5712 |
| VT | 63.6 ± 24.5 [58.6, 68.7] | 65.9 ± 18.9 [62.2, 69.5] | 0.9880 |
| SF | 85.3 ± 25.0 [80.1, 90.5] | 89.5 ± 18.6 [85.8, 93.1] | 0.0507 |
| RE | 82.6 ± 27.1 [77.0, 88.2] | 88.5 ± 21.3 [84.4, 92.7] | 0.0904 |
| MH | 73.2 ± 22.5 [68.6, 77.9] | 73.2 ± 19.2 [69.5, 76.9] | 0.9942 |
| PCS | 46.3 ± 14.6 [43.3, 49.4] | 49.4 ± 13.7 [46.6, 52.1] | 0.1419 |
| MCS | 51.1 ± 11.2 [48.7, 53.4] | 50.1 ± 10.1 [48.1, 52.1] | 0.5428 |
| Female | Decreased HGS (n = 57) | Non-Decreased HGS (n = 134) | p Value |
| PF | 72.7 ± 22.1 [66.8, 78.7] | 87.6 ± 14.9 [85.0, 90.1] | <0.0001 |
| RP | 71.1 ± 32.2 [62.5, 79.7] | 85.8 ± 23.4 [81.8, 89.8] | <0.0001 |
| BP | 65.6 ± 22.5 [59.6, 71.6] | 73.6 ± 25.9 [69.2, 78.1] | 0.0432 |
| GH | 54.6 ± 22.7 [48.6, 60.6] | 57.8 ± 18.6 [54.5, 61.0] | 0.3266 |
| VT | 56.2 ± 24.5 [49.7, 62.7] | 67.5 ± 19.4 [64.2, 70.9] | 0.0006 |
| SF | 78.4 ± 24.5 [71.9, 85.0] | 89.7 ± 20.1 [86.2, 93.3] | 0.0012 |
| RE | 73.0 ± 8.7 [65.3, 80.7] | 87.6 ± 21.7 [83.9, 91.3] | <0.0001 |
| MH | 70.8 ± 24.3 [64.3, 77.2] | 77.1 ± 18.5 [73.9, 80.3] | 0.1394 |
| PCS | 37.4 ± 15.5 [33.2, 41.6] | 47.7 ± 11.6 [45.7, 49.8] | <0.0001 |
| MCS | 49.2 ± 10.5 [46.3, 52.0] | 52.6 ± 9.6 [50.9, 54.3] | 0.0326 |
| Female | Decreased SMM (n = 66) | Non-Decreased SMM (n = 125) | p Value |
| PF | 78.5 ± 19.9 [73.6, 83.5] | 85.6 ± 17.5 [82.5, 88.7] | 0.0124 |
| RP | 78.8 ± 27.8 [71.9, 85.7] | 82.8 ± 26.7 [78.1, 87.6] | 0.3273 |
| BP | 71.3 ± 25.3 [65.0, 77.6] | 71.1 ± 25.2 [66.7, 75.6] | 0.9672 |
| GH | 57.1 ± 19.7 [52.2, 62.0] | 56.6 ± 20.2 [53.0, 60.3] | 0.8853 |
| VT | 61.1 ± 22.3 [55.6, 66.6] | 65.7 ± 21.2 [61.9, 69.5] | 0.1652 |
| SF | 84.2 ± 24.5 [78.2, 90.3] | 87.4 ± 20.6 [83.7, 91.2] | 0.3527 |
| RE | 81.0 ± 26.2 [74.6, 87.5] | 84.5 ± 24.1 [80.3, 88.8] | 0.3546 |
| MH | 71.9 ± 22.4 [66.4, 77.5] | 76.9 ± 19.4 [73.4, 80.3] | 0.1161 |
| PCS | 43.9 ± 13.7 [40.4, 47.3] | 45.0 ± 13.8 [42.5, 47.5] | 0.5979 |
| MCS | 51.7 ± 9.7 [49.3, 54.1] | 51.5 ± 10.2 [49.6, 53.3] | 0.8719 |
| ≥65 years | Decreased HGS (n = 74) | Non-Decreased HGS (n = 121) | p Value |
| PF | 72.8 ± 23.5 [67.3, 78.3] | 84.9 ± 14.0 [82.3, 87.4] | 0.0001 |
| RP | 68.8 ± 34.6 [60.8, 76.9] | 86.3 ± 20.6 [82.6, 90.1] | <0.0001 |
| BP | 68.8 ± 24.3 [63.2, 74.4] | 78.0 ± 24.1 [73.6, 82.4] | 0.0111 |
| GH | 57.6 ± 23.3 [52.2, 63.0] | 56.8 ± 18.9 [53.3, 60.3] | 0.7950 |
| VT | 57.9 ± 25.7 [52.0. 63.9] | 68.9 ± 19.8 [65.3, 72.5] | 0.0021 |
| SF | 78.3 ± 25.1 [72.5, 84.1] | 91.1 ± 18.3 [87.7, 94.4] | <0.0001 |
| RE | 71.5 ± 30.6 [64.4, 78.7] | 88.0 ± 20.5 [84.2, 91.7] | <0.0001 |
| MH | 73.0 ± 25.1 [67.2, 78.8] | 77.4 ± 17.9 [74.1, 80.6] | 0.5509 |
| PCS | 36.5 ± 17.6 [32.4, 40.6] | 47.2 ± 10.1 [45.3, 49.1] | <0.0001 |
| MCS | 51.5 ± 11.2 [48.9, 54.1] | 53.5 ± 9.2 [51.8, 55.2] | 0.1822 |
| ≥65 years | Decreased SMM (n = 110) | Non-Decreased SMM (n = 85) | p Value |
| PF | 78.5 ± 18.6 [75.0, 82.1] | 82.6 ± 19.4 [78.4, 86.8] | 0.1435 |
| RP | 78.3 ± 28.6 [72.8, 83.7] | 81.6 ± 27.4 [75.6, 87.5] | 0.4226 |
| BP | 73.9 ± 26.2 [68.9, 78.9] | 75.2 ± 22.4 [70.3, 80.0] | 0.7338 |
| GH | 56.6 ± 21.9 [52.4, 60.8] | 57.8 ± 19.0 [53.6, 62.0] | 0.6926 |
| VT | 62.8 ± 24.4 [58.2, 67.4] | 67.2 ± 20.6 [62.8, 71.7] | 0.1809 |
| SF | 85.5 ± 23.8 [80.9, 90.0] | 86.9 ± 19.5 [82.6, 91.2] | 0.6548 |
| RE | 80.1 ± 27.3 [74.9, 85.2] | 83.9 ± 24.2 [78.6, 89.3] | 0.3090 |
| MH | 74.0 ± 22.3 [69.8, 78.2] | 77.9 ± 19.1 [73.8, 82.1] | 0.1972 |
| PCS | 43.3 ± 14.1 [40.6, 45.9] | 42.7 ± 15.2 [39.3, 46.1] | 0.7951 |
| MCS | 52.8 ± 10.1 [50.9, 54.7] | 52.6 ± 10.1 [50.4, 54.9] | 0.9288 |
| <65 years | Decreased HGS (n = 19) | Non-Decreased HGS (n = 175) | p Value |
| PF | 72.8 ± 19.6 [63.3, 82.2] | 90.7 ± 14.1 [88.6, 92.8] | <0.0001 |
| RP | 77.3 ± 25.9 [64.8, 89.8] | 88.0 ± 22.4 [84.6, 91.3] | 0.0530 |
| BP | 65.5 ± 23.1 [54.4, 76.7] | 75.5 ± 25.2 [71.8, 79.3] | 0.0990 |
| GH | 44.0 ± 16.9 [35.8, 52.1] | 55.6 ± 18.3 [52.8, 58.4] | 0.0088 |
| VT | 56.8 ± 23.2 [45.3, 68.3] | 65.0 ± 20.0 [62.0, 68.0] | 0.1042 |
| SF | 84.6 ± 27.1 [70.7, 98.6] | 88.1 ± 21.3 [84.9, 91.3] | 0.5338 |
| RE | 76.2 ± 29.8 [61.4, 91.0] | 88.5 ± 21.7 [85.3, 91.8] | 0.0281 |
| MH | 69.4 ± 20.2 [59.3, 79.4] | 73.0 ± 20.3 [70.0, 76.0] | 0.4708 |
| PCS | 40.5 ± 11.8 [34.4, 46.6] | 50.5 ± 12.5 [48.6, 52.4] | 0.0018 |
| MCS | 46.5 ± 9.4 [41.7, 51.3] | 49.6 ± 10.3 [48.1, 51.2] | 0.2286 |
| <65 years | Decreased SMM (n = 49) | Non-Decreased SMM (n = 145) | p Value |
| PF | 87.7 ± 15.1 [83.4, 92.1] | 89.3 ± 15.8 [86.7, 91.9] | 0.5386 |
| RP | 85.2 ± 23.3 [78.6, 91.9] | 87.5 ± 22.8 [83.8, 91.3] | 0.5501 |
| BP | 76.5 ± 22.8 [69.9, 83.0] | 73.9 ± 25.9 [69.7, 78.2] | 0.5389 |
| GH | 52.0 ± 16.1 [47.3, 56.8] | 55.2 ± 19.1 [52.0, 58.4] | 0.3182 |
| VT | 62.2 ± 21.9 [55.8, 68.5] | 65.0 ± 19.9 [61.7, 68.2] | 0.4133 |
| SF | 83.4 ± 26.9 [75.5, 91.4] | 89.2 ± 19.8 [85.9, 92.5] | 0.0286 |
| RE | 86.3 ± 24.8 [79.1, 93.5] | 87.7 ± 22.2 [84.1, 91.4] | 0.7097 |
| MH | 69.7 ± 22.5 [63.2, 76.3] | 73.6 ± 19.4 [70.4, 76.8] | 0.2510 |
| PCS | 50.2 ± 13.6 [46.1, 54.3] | 49.4 ± 12.5 [47.3, 51.5] | 0.7120 |
| MCS | 47.9 ± 10.9 [44.6, 51.1] | 49.8 ± 10.0 [48.2, 51.5] | 0.2593 |
| Male | PF | RP | BP | GH | VT | |||||
| r | p Value | r | p Value | r | p Value | r | p Value | r | p Value | |
| Age | −0.21 | 0.0036 | −0.12 | 0.0939 | −0.12 | 0.0869 | 0.11 | 0.1298 | 0.069 | 0.3346 |
| BMI | −0.057 | 0.4246 | −0.051 | 0.4740 | −0.047 | 0.5091 | 0.039 | 0.5925 | −0.044 | 0.5394 |
| HGS | 0.32 | <0.0001 | 0.25 | 0.0007 | 0.048 | 0.5242 | −0.016 | 0.8924 | 0.0058 | 0.9383 |
| SMI | −0.0066 | 0.9268 | −0.0028 | 0.9685 | −0.081 | 0.2577 | −0.00035 | 0.9961 | −0.062 | 0.3920 |
| Albumin | 0.42 | <0.0001 | 0.38 | <0.0001 | 0.21 | 0.0025 | 0.18 | 0.0143 | 0.25 | 0.0005 |
| Bilirubin | 0.011 | 0.8784 | −0.021 | 0.7731 | −0.041 | 0.5686 | −0.061 | 0.4026 | −0.0278 | 0.7018 |
| PT | 0.26 | 0.0002 | 0.16 | 0.0245 | 0.063 | 0.3773 | 0.17 | 0.0209 | 0.19 | 0.0086 |
| Platelet | 0.11 | 0.1250 | 0.042 | 0.5583 | −0.031 | 0.6653 | 0.11 | 0.1449 | 0.020 | 0.7802 |
| CONUT | −0.4 | <0.0001 | −0.30 | <0.0001 | −0.12 | 0.0924 | −0.17 | 0.0164 | −0.17 | 0.0181 |
| AST | −0.01 | 0.1626 | −0.27 | 0.0013 | −0.15 | 0.0412 | −0.21 | 0.0030 | −0.16 | 0.0220 |
| ALT | −0.027 | 0.7035 | −0.18 | 0.0104 | −0.11 | 0.1393 | −0.17 | 0.0189 | −0.13 | 0.0707 |
| Male | SF | RE | MH | PCS | MCS | |||||
| r | p Value | r | p Value | r | p Value | r | p Value | r | p Value | |
| Age | −0.019 | 0.7916 | −0.064 | 0.3732 | 0.14 | 0.0509 | −0.24 | 0.0011 | 0.22 | 0.0030 |
| BMI | −0.046 | 0.5294 | 0.055 | 0.4441 | 0.031 | 0.6637 | −0.083 | 0.260 | 0.0099 | 0.8930 |
| HGS | 0.10 | 0.1827 | 0.16 | 0.0324 | −0.10 | 0.1772 | 0.29 | 0.0001 | −0.16 | 0.0353 |
| SMI | −0.043 | 0.5601 | 0.056 | 0.4391 | 0.046 | 0.5193 | −0.050 | 0.4976 | −0.02 | 0.7834 |
| Albumin | 0.27 | 0.0002 | 0.33 | <0.0001 | 0.086 | 0.2273 | 0.46 | <0.0001 | 0.046 | 0.5348 |
| Bilirubin | −0.064 | 0.3845 | −0.0071 | 0.9215 | 0.067 | 0.3569 | −0.02 | 0.7925 | −0.035 | 0.6371 |
| PT | 0.16 | 0.0286 | 0.10 | 0.1503 | 0.020 | 0.7849 | 0.19 | 0.0088 | 0.069 | 0.3468 |
| Platelet | 0.10 | 0.1614 | −0.040 | 0.5762 | −0.1243 | 0.0818 | 0.051 | 0.4905 | −0.023 | 0.7590 |
| CONUT | −0.19 | 0.0091 | −0.21 | 0.0031 | 0.026 | 0.7197 | 0.36 | <0.0001 | 0.011 | 0.8773 |
| AST | −0.070 | 0.3345 | −0.19 | 0.0071 | −0.13 | 0.0675 | −0.16 | 0.0286 | −0.12 | 0.1021 |
| ALT | −0.025 | 0.7311 | −0.20 | 0.0050 | −0.15 | 0.0331 | 0.10 | 0.1650 | −0.11 | 0.1172 |
| Female | PF | RP | BP | GH | VT | |||||
| r | p Value | r | p Value | r | p Value | r | p Value | r | p Value | |
| Age | −0.25 | 0.0004 | −0.15 | 0.0384 | 0.051 | 0.4835 | 0.077 | 0.2987 | −0.035 | 0.6346 |
| BMI | −0.037 | 0.6128 | −0.0065 | 0.9292 | −0.025 | 0.7329 | −0.0248 | 0.7383 | 0.0059 | 0.9357 |
| HGS | 0.35 | <0.0001 | 0.18 | 0.0195 | 0.098 | 0.1953 | 0.054 | 0.4815 | 0.23 | 0.0022 |
| SMI | 0.20 | 0.0053 | 0.10 | 0.1677 | −0.048 | 0.5136 | −0.0055 | 0.9409 | 0.096 | 0.1877 |
| Albumin | 0.24 | 0.0011 | 0.27 | 0.0002 | 0.15 | 0.0407 | 0.16 | 0.0351 | 0.20 | 0.0058 |
| Bilirubin | −0.078 | 0.2909 | −0.18 | 0.0133 | −0.13 | 0.0711 | −0.092 | 0.2216 | −0.11 | 0.1427 |
| PT | 0.021 | 0.7759 | 0.12 | 0.0978 | 0.066 | 0.3663 | 0.088 | 0.2349 | 0.14 | 0.0552 |
| Platelet | 0.11 | 0.1247 | 0.13 | 0.080 | 0.069 | 0.3444 | 0.040 | 0.5908 | 0.083 | 0.2585 |
| CONUT | −0.2 | 0.0051 | −0.27 | 0.0002 | −0.16 | 0.0246 | −0.19 | 0.0088 | −0.15 | 0.0423 |
| AST | −0.11 | 0.1441 | −0.12 | 0.1023 | −0.10 | 0.1521 | −0.094 | 0.2403 | −0.17 | 0.0181 |
| ALT | −0.03 | 0.6782 | −0.039 | 0.5944 | −0.14 | 0.0507 | −0.087 | 0.2403 | −0.13 | 0.0662 |
| Female | SF | RE | MH | PCS | MCS | |||||
| r | p Value | r | p Value | r | p Value | r | p Value | r | p Value | |
| Age | 0.017 | 0.8212 | −0.11 | 0.1373 | −0.021 | 0.7774 | −0.20 | 0.0066 | 0.097 | 0.1948 |
| BMI | −0.012 | 0.8759 | −0.0045 | 0.9511 | −0.0075 | 0.9186 | −0.062 | 0.4035 | −0.044 | 0.5541 |
| HGS | 0.18 | 0.0179 | 0.19 | 0.0112 | 0.17 | 0.0222 | 0.28 | 0.0003 | 0.15 | 0.0446 |
| SMI | 0.025 | 0.7319 | 0.11 | 0.1375 | 0.057 | 0.4395 | 0.087 | 0.2433 | −0.060 | 0.4255 |
| Albumin | 0.20 | 0.0072 | 0.19 | 0.0098 | 0.12 | 0.0878 | 0.30 | <0.0001 | 0.15 | 0.0481 |
| Bilirubin | −0.18 | 0.0148 | −0.16 | 0.0304 | −0.04 | 0.5927 | −0.21 | 0.0043 | −0.074 | 0.3295 |
| PT | 0.14 | 0.0503 | 0.13 | 0.0766 | 0.12 | 0.1036 | 0.12 | 0.1030 | 0.19 | 0.0119 |
| Platelet | 0.098 | 0.1837 | 0.12 | 0.1067 | 0.12 | 0.1103 | 0.16 | 0.0311 | 0.093 | 0.2115 |
| CONUT | −0.17 | 0.0253 | −0.17 | 0.0206 | 0.081 | 0.2708 | −0.31 | <0.0001 | −0.11 | 0.1407 |
| AST | −0.16 | 0.0336 | −0.13 | 0.0719 | −0.16 | 0.0245 | −0.11 | 0.1386 | −0.17 | 0.0206 |
| ALT | −0.084 | 0.2597 | −0.051 | 0.4811 | −0.98 | 0.1817 | −0.025 | 0.7397 | −0.15 | 0.0462 |
| Male | Parameter (Significant Factor Only) | Estimates | Standard Error | p Value |
| PF | HGS | 0.494 | 0.104 | 0.0031 |
| Serum albumin | 9.008 | 3.152 | 0.0048 | |
| CONUT score | −1.656 | 0.796 | 0.0389 | |
| RP | HGS | 0.579 | 0.244 | 0.0185 |
| Serum albumin | 17.593 | 4.899 | 0.0004 | |
| BP | NA | NA | NA | NA |
| GH | NA | NA | NA | NA |
| VT | Serum albumin | 8.944 | 4.158 | 0.0327 |
| SF | Serum albumin | 10.456 | 3.929 | 0.0085 |
| RE | Serum albumin | 18.765 | 4.891 | 0.0002 |
| ALT | −0.245 | 0.0845 | 0.0042 | |
| MH | NA | NA | NA | NA |
| PCS | HGS | 0.288 | 0.141 | 0.0421 |
| Serum albumin | 11.016 | 2.692 | <0.0001 | |
| MCS | NA | NA | NA | NA |
| Female | Parameter (significant factor only) | Estimates | Standard error | p Value |
| PF | HGS | 0.958 | 0.322 | 0.0034 |
| RP | NA | NA | NA | NA |
| BP | NA | NA | NA | NA |
| GH | NA | NA | NA | NA |
| VT | HGS | 0.851 | 0.346 | 0.0150 |
| SF | NA | NA | NA | NA |
| RE | HGS | 0.729 | 0.36 | 0.0422 |
| MH | AST | −0.124 | 0.0609 | 0.0440 |
| PCS | HGS | 0.521 | 0.22 | 0.0191 |
| MCS | NA | NA | NA | NA |
© 2018 by the authors. Licensee MDPI, Basel, Switzerland. This article is an open access article distributed under the terms and conditions of the Creative Commons Attribution (CC BY) license (http://creativecommons.org/licenses/by/4.0/).
Share and Cite
Nishikawa, H.; Enomoto, H.; Yoh, K.; Iwata, Y.; Sakai, Y.; Kishino, K.; Ikeda, N.; Takashima, T.; Aizawa, N.; Takata, R.; et al. Health-Related Quality of Life in Chronic Liver Diseases: A Strong Impact of Hand Grip Strength. J. Clin. Med. 2018, 7, 553. https://doi.org/10.3390/jcm7120553
Nishikawa H, Enomoto H, Yoh K, Iwata Y, Sakai Y, Kishino K, Ikeda N, Takashima T, Aizawa N, Takata R, et al. Health-Related Quality of Life in Chronic Liver Diseases: A Strong Impact of Hand Grip Strength. Journal of Clinical Medicine. 2018; 7(12):553. https://doi.org/10.3390/jcm7120553
Chicago/Turabian StyleNishikawa, Hiroki, Hirayuki Enomoto, Kazunori Yoh, Yoshinori Iwata, Yoshiyuki Sakai, Kyohei Kishino, Naoto Ikeda, Tomoyuki Takashima, Nobuhiro Aizawa, Ryo Takata, and et al. 2018. "Health-Related Quality of Life in Chronic Liver Diseases: A Strong Impact of Hand Grip Strength" Journal of Clinical Medicine 7, no. 12: 553. https://doi.org/10.3390/jcm7120553
APA StyleNishikawa, H., Enomoto, H., Yoh, K., Iwata, Y., Sakai, Y., Kishino, K., Ikeda, N., Takashima, T., Aizawa, N., Takata, R., Hasegawa, K., Ishii, N., Yuri, Y., Nishimura, T., Iijima, H., & Nishiguchi, S. (2018). Health-Related Quality of Life in Chronic Liver Diseases: A Strong Impact of Hand Grip Strength. Journal of Clinical Medicine, 7(12), 553. https://doi.org/10.3390/jcm7120553