Prescribing Variation in General Practices in England Following a Direct Healthcare Professional Communication on Mirabegron


Abstract
1. Introduction
2. Methods
2.1. Study Design, Setting and Participants
2.2. Variables
2.3. Data Sources/Measurement
2.4. Analysis
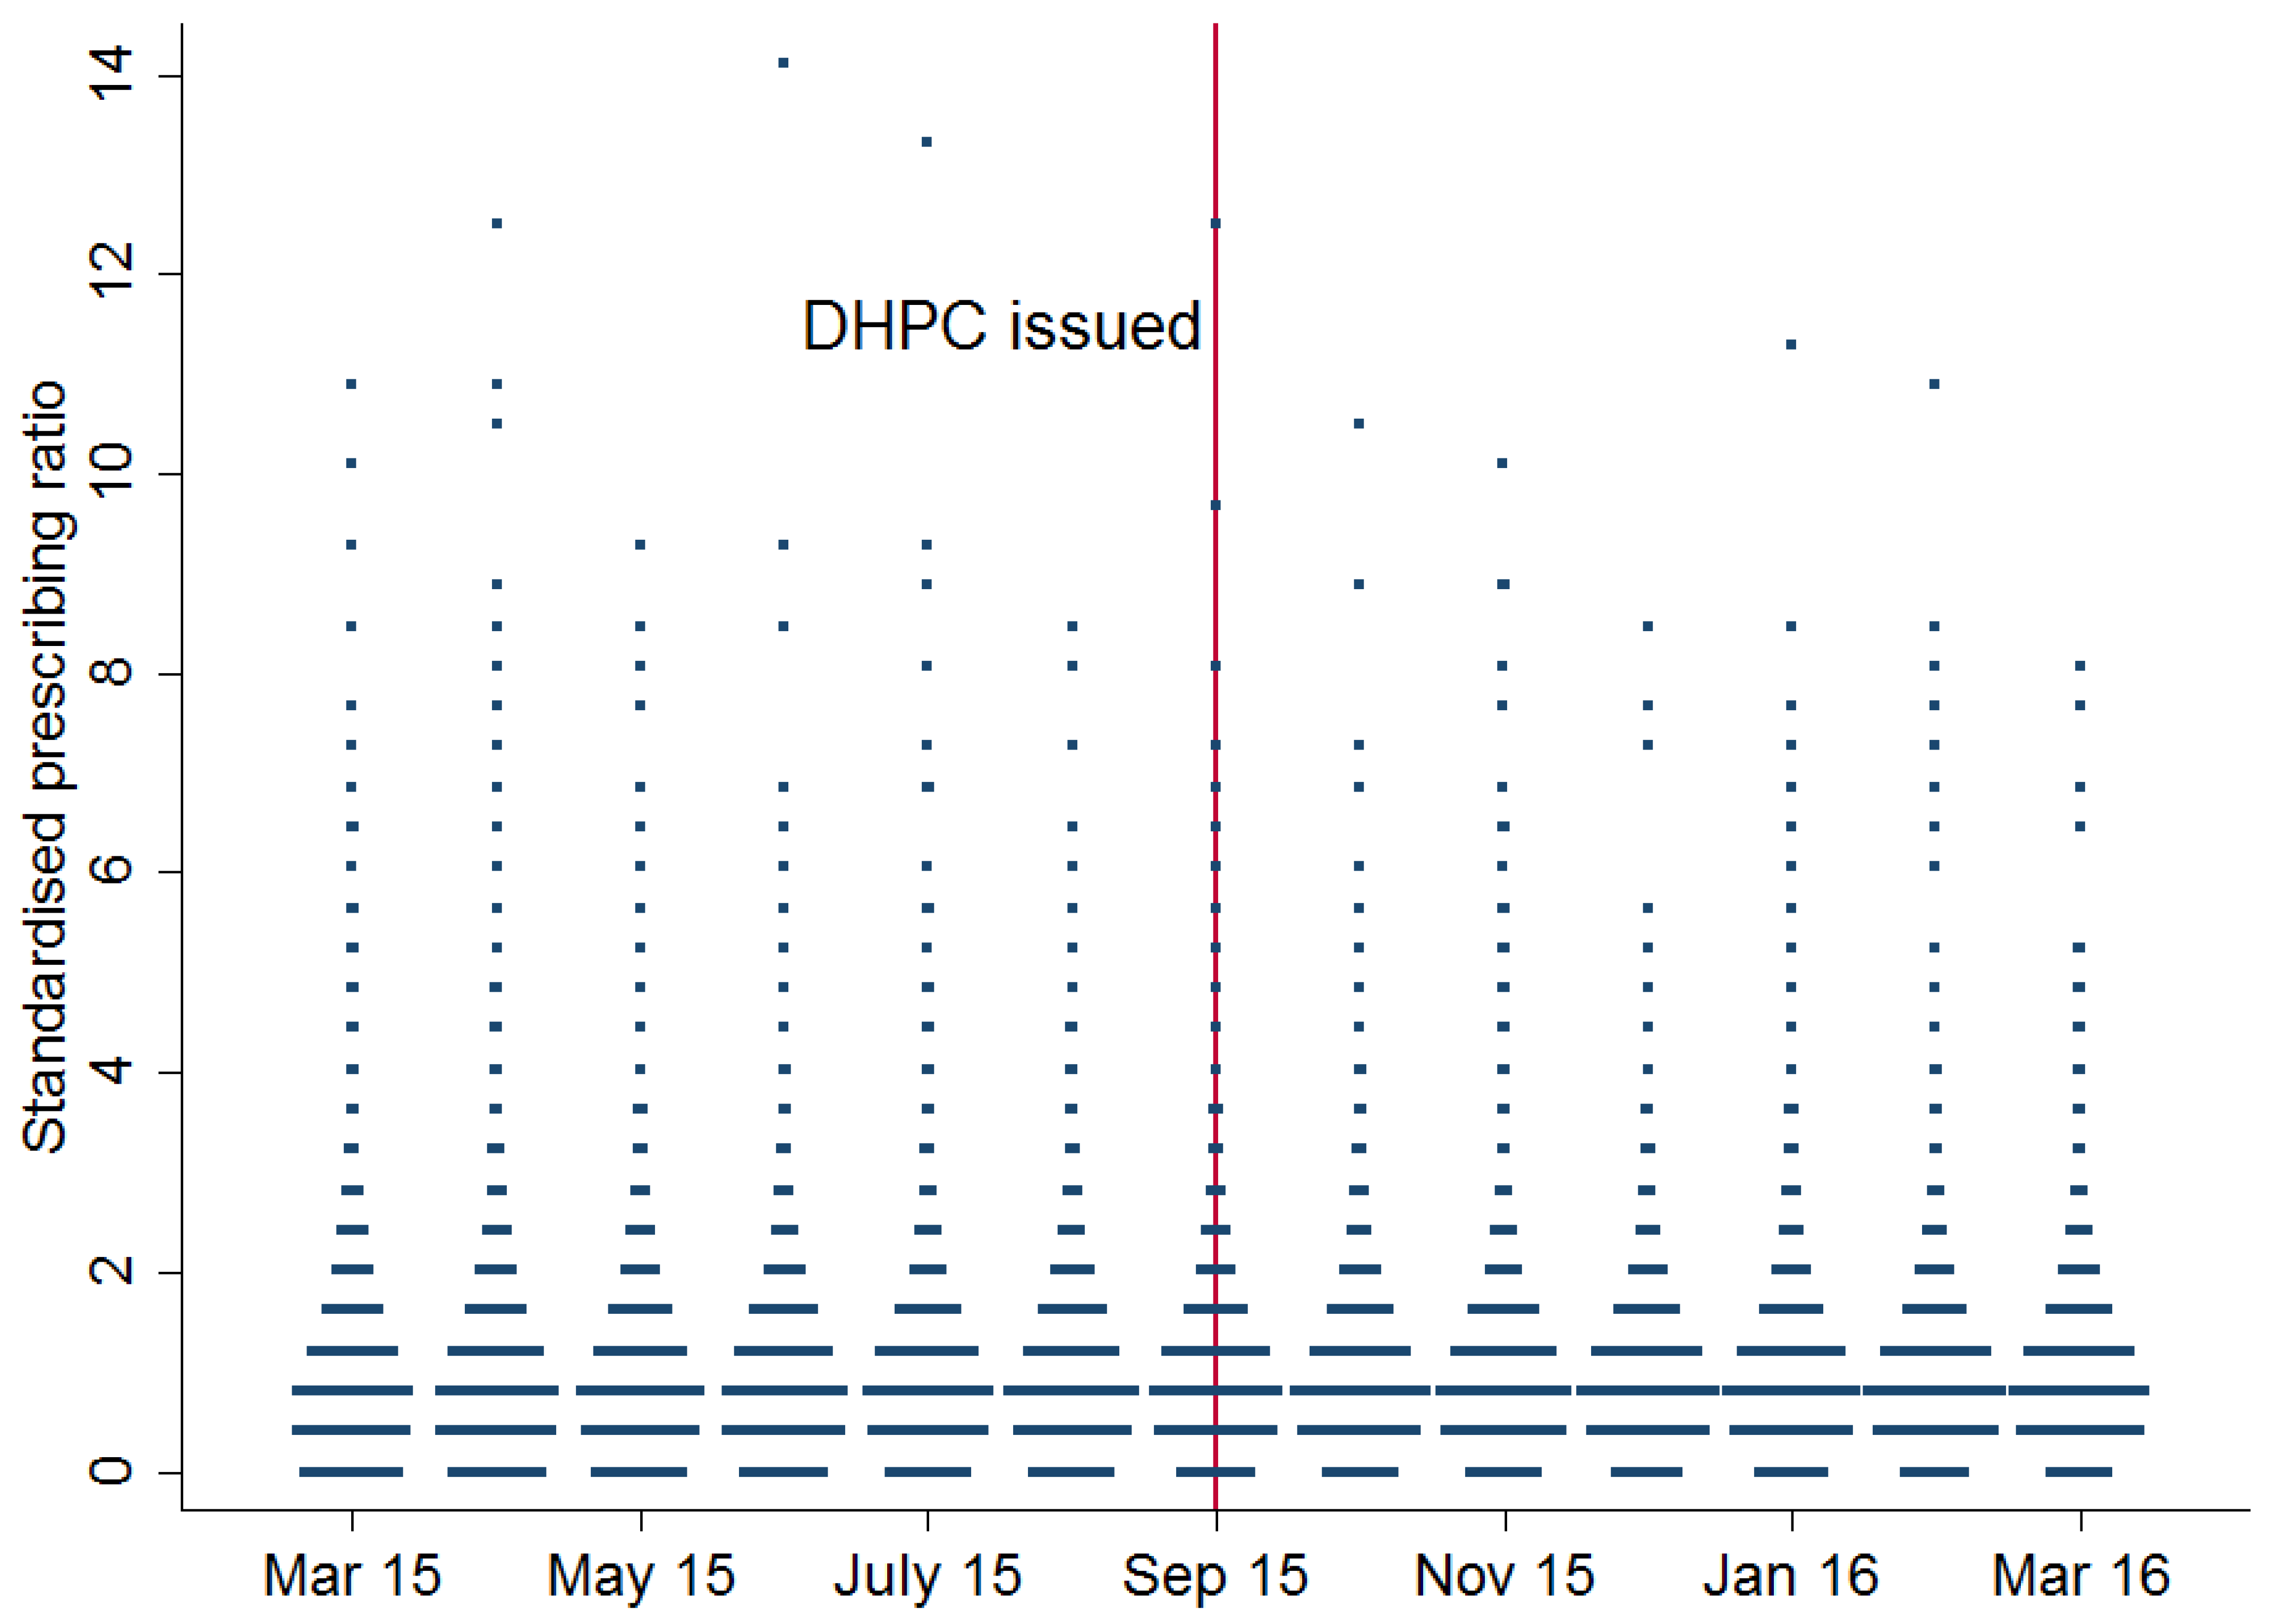
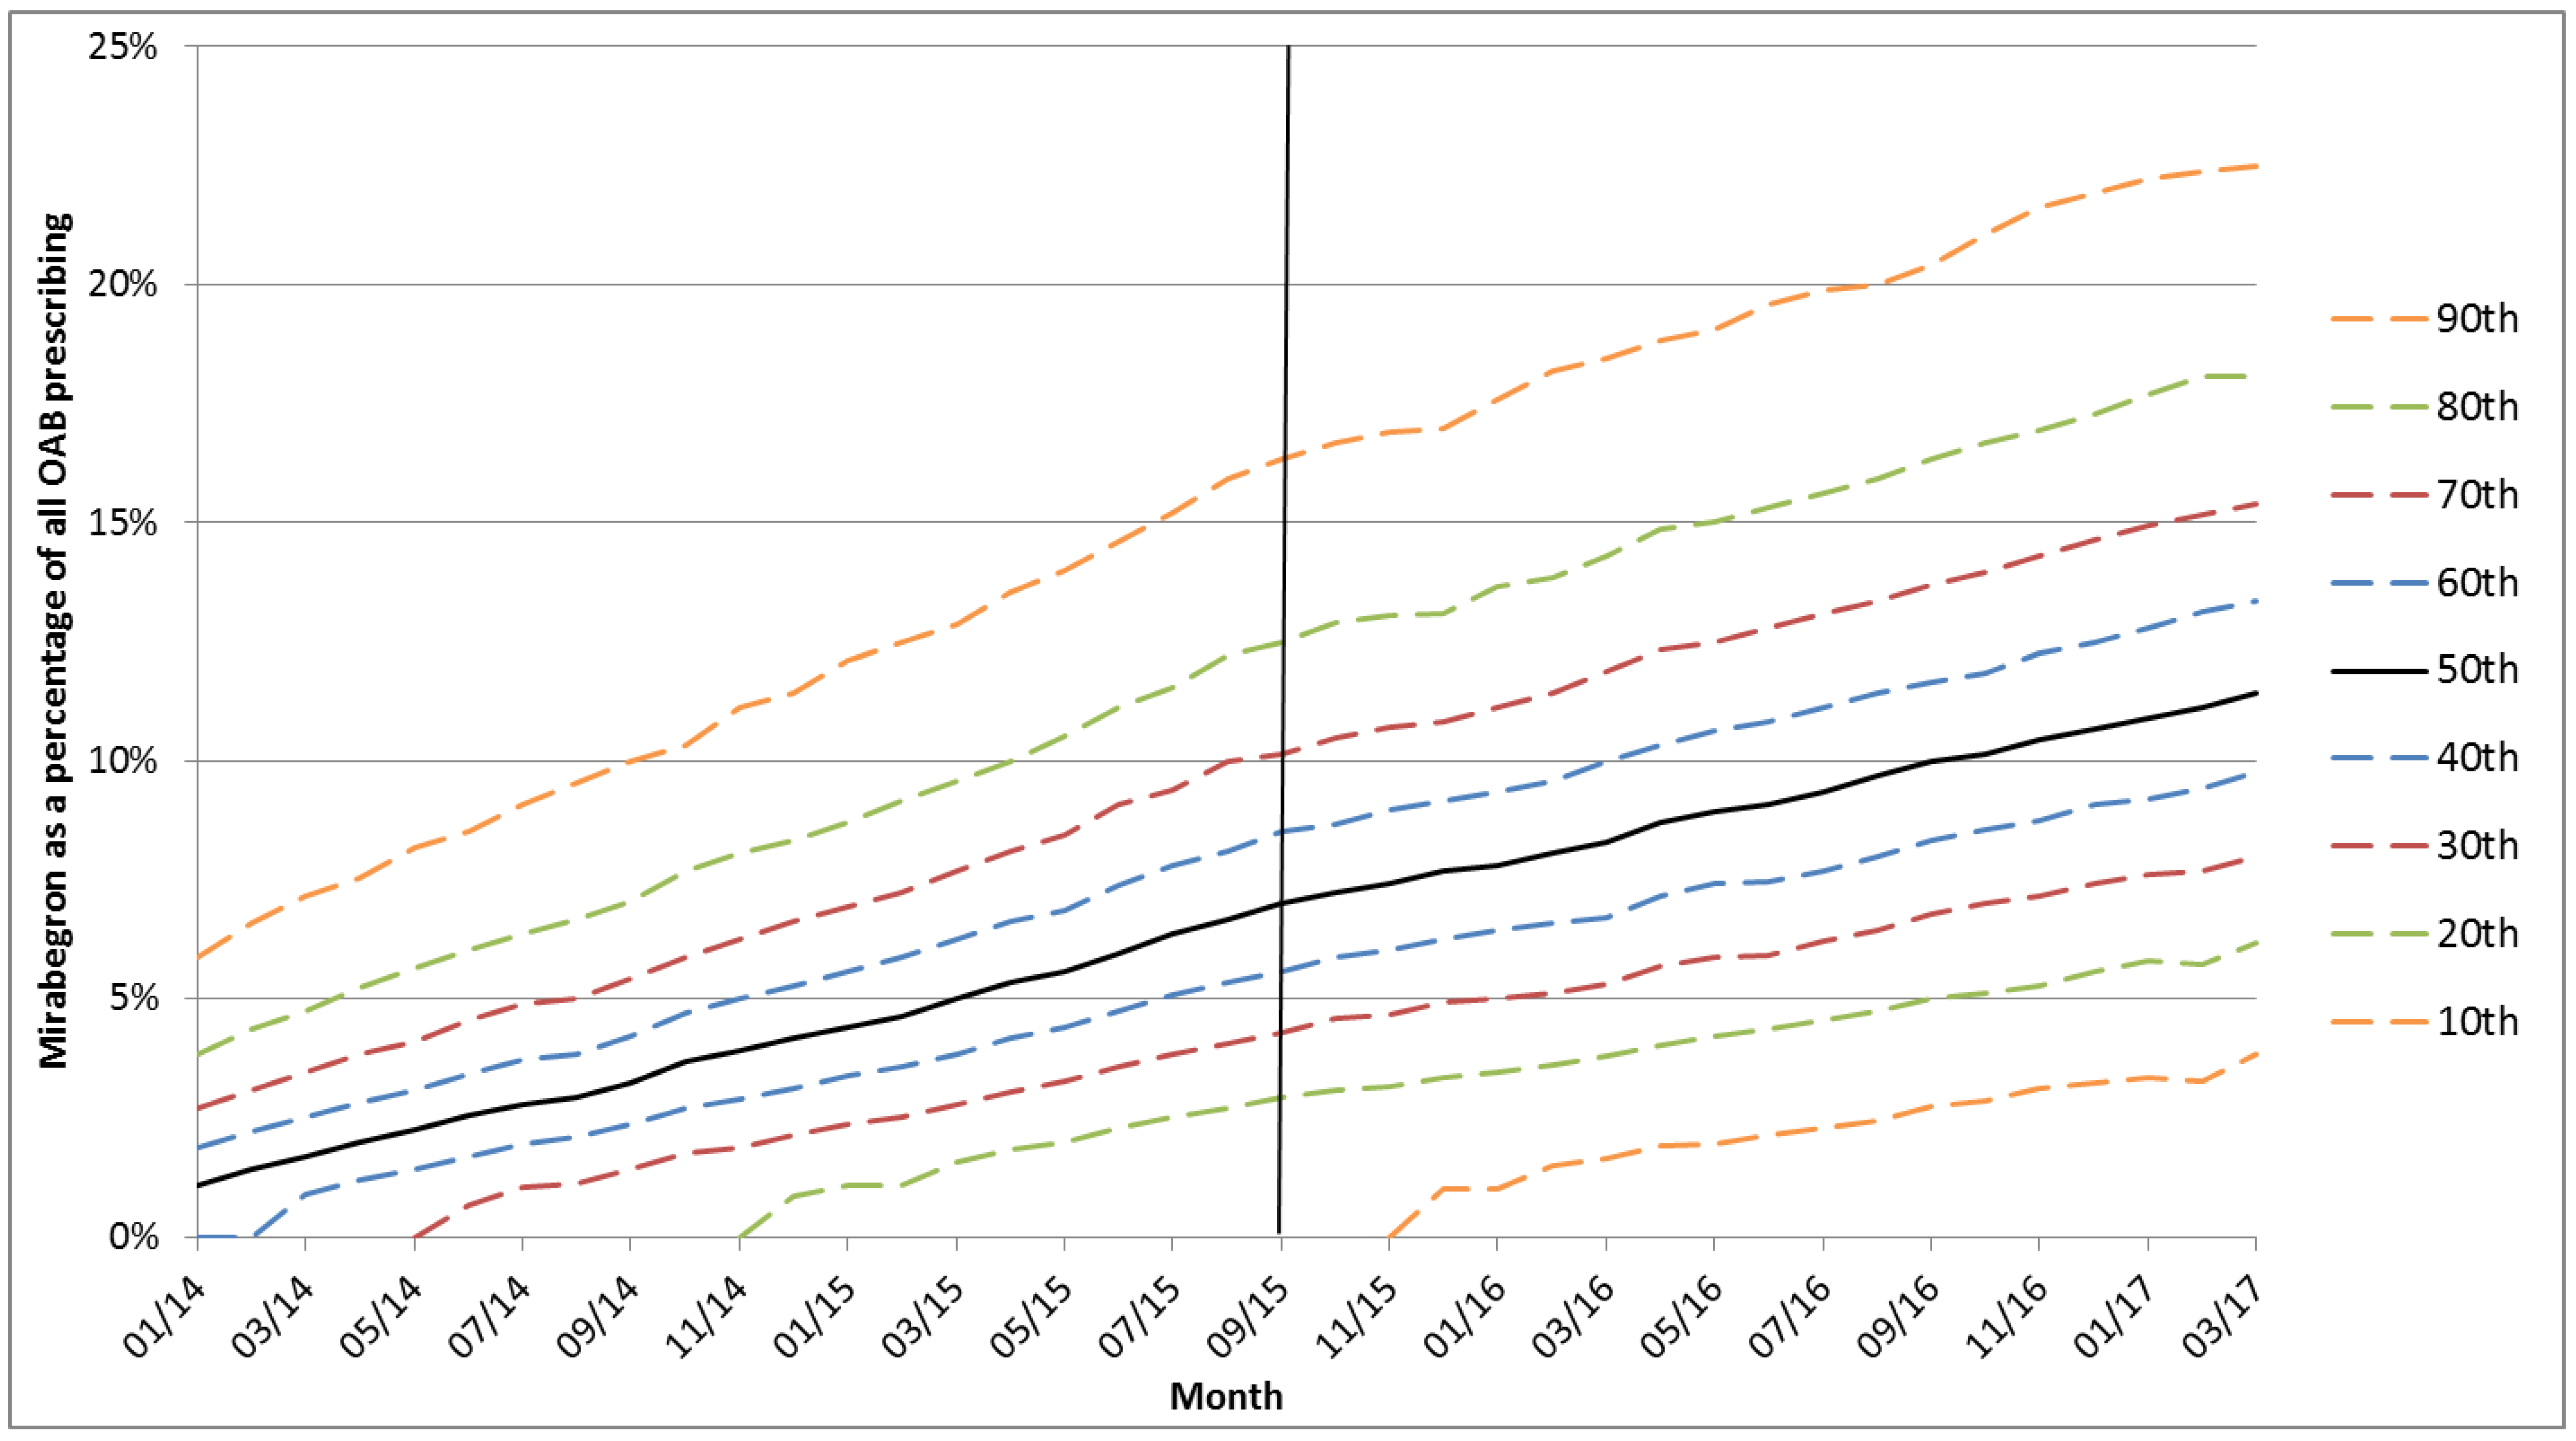
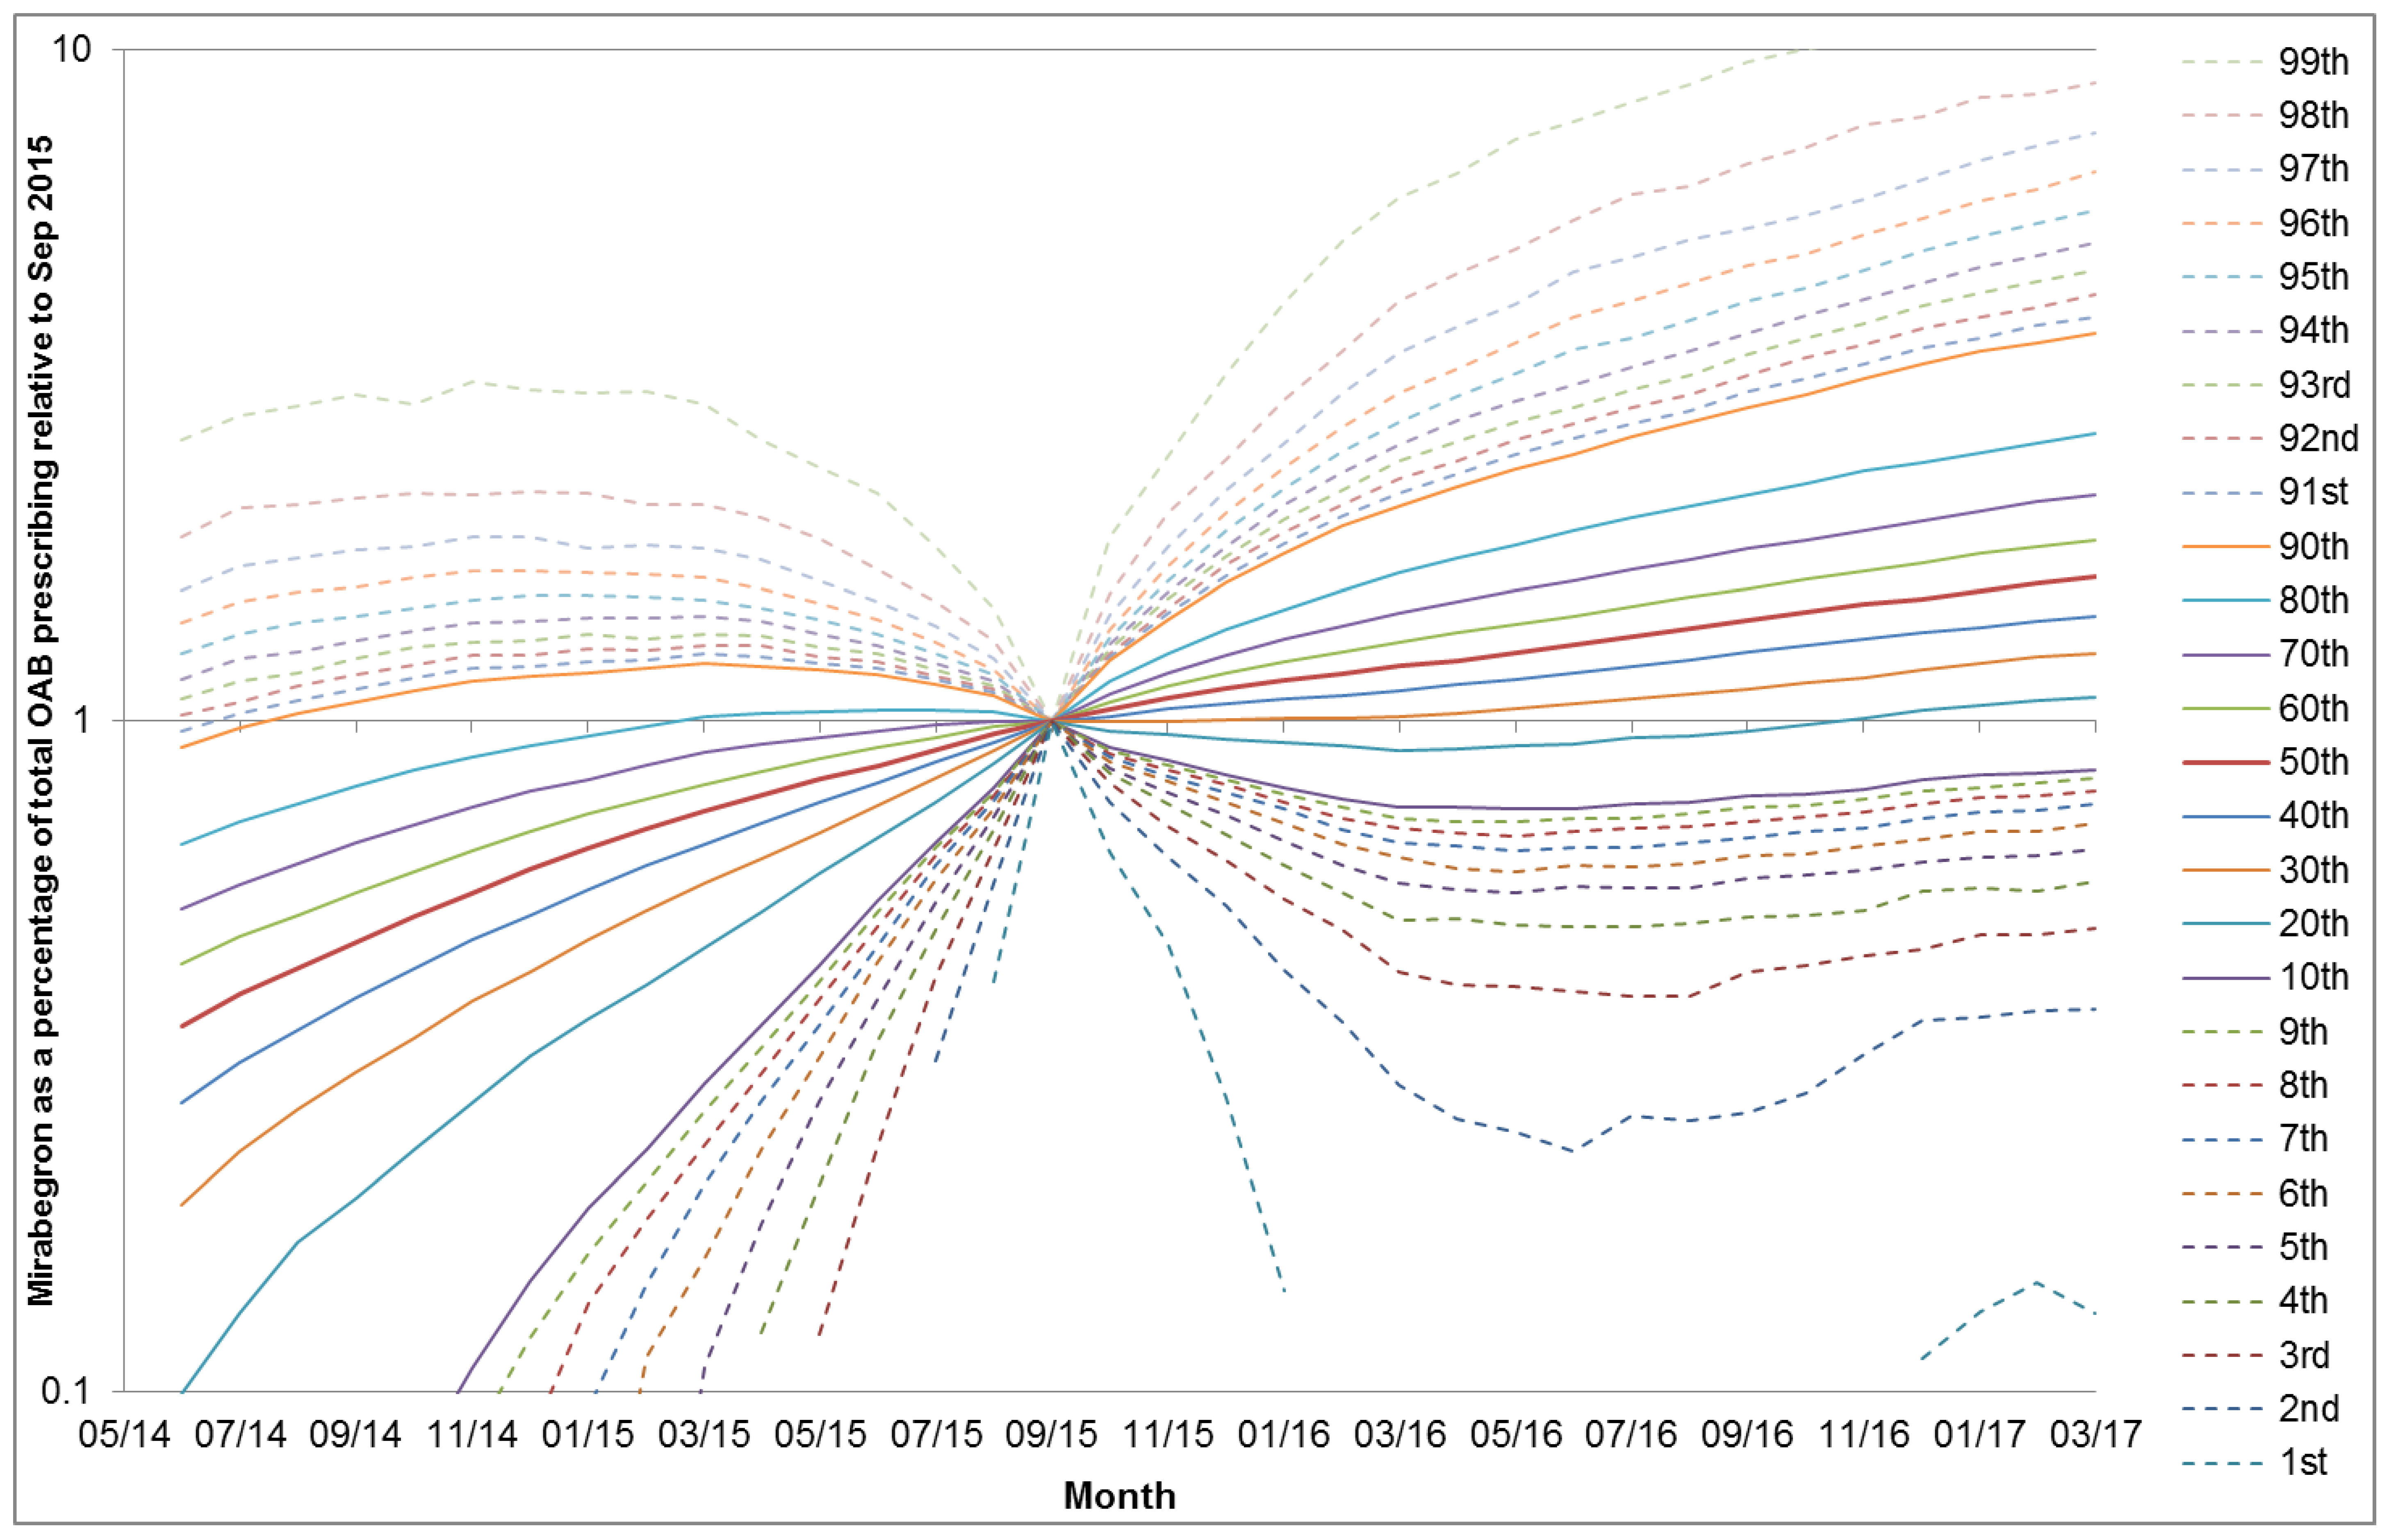
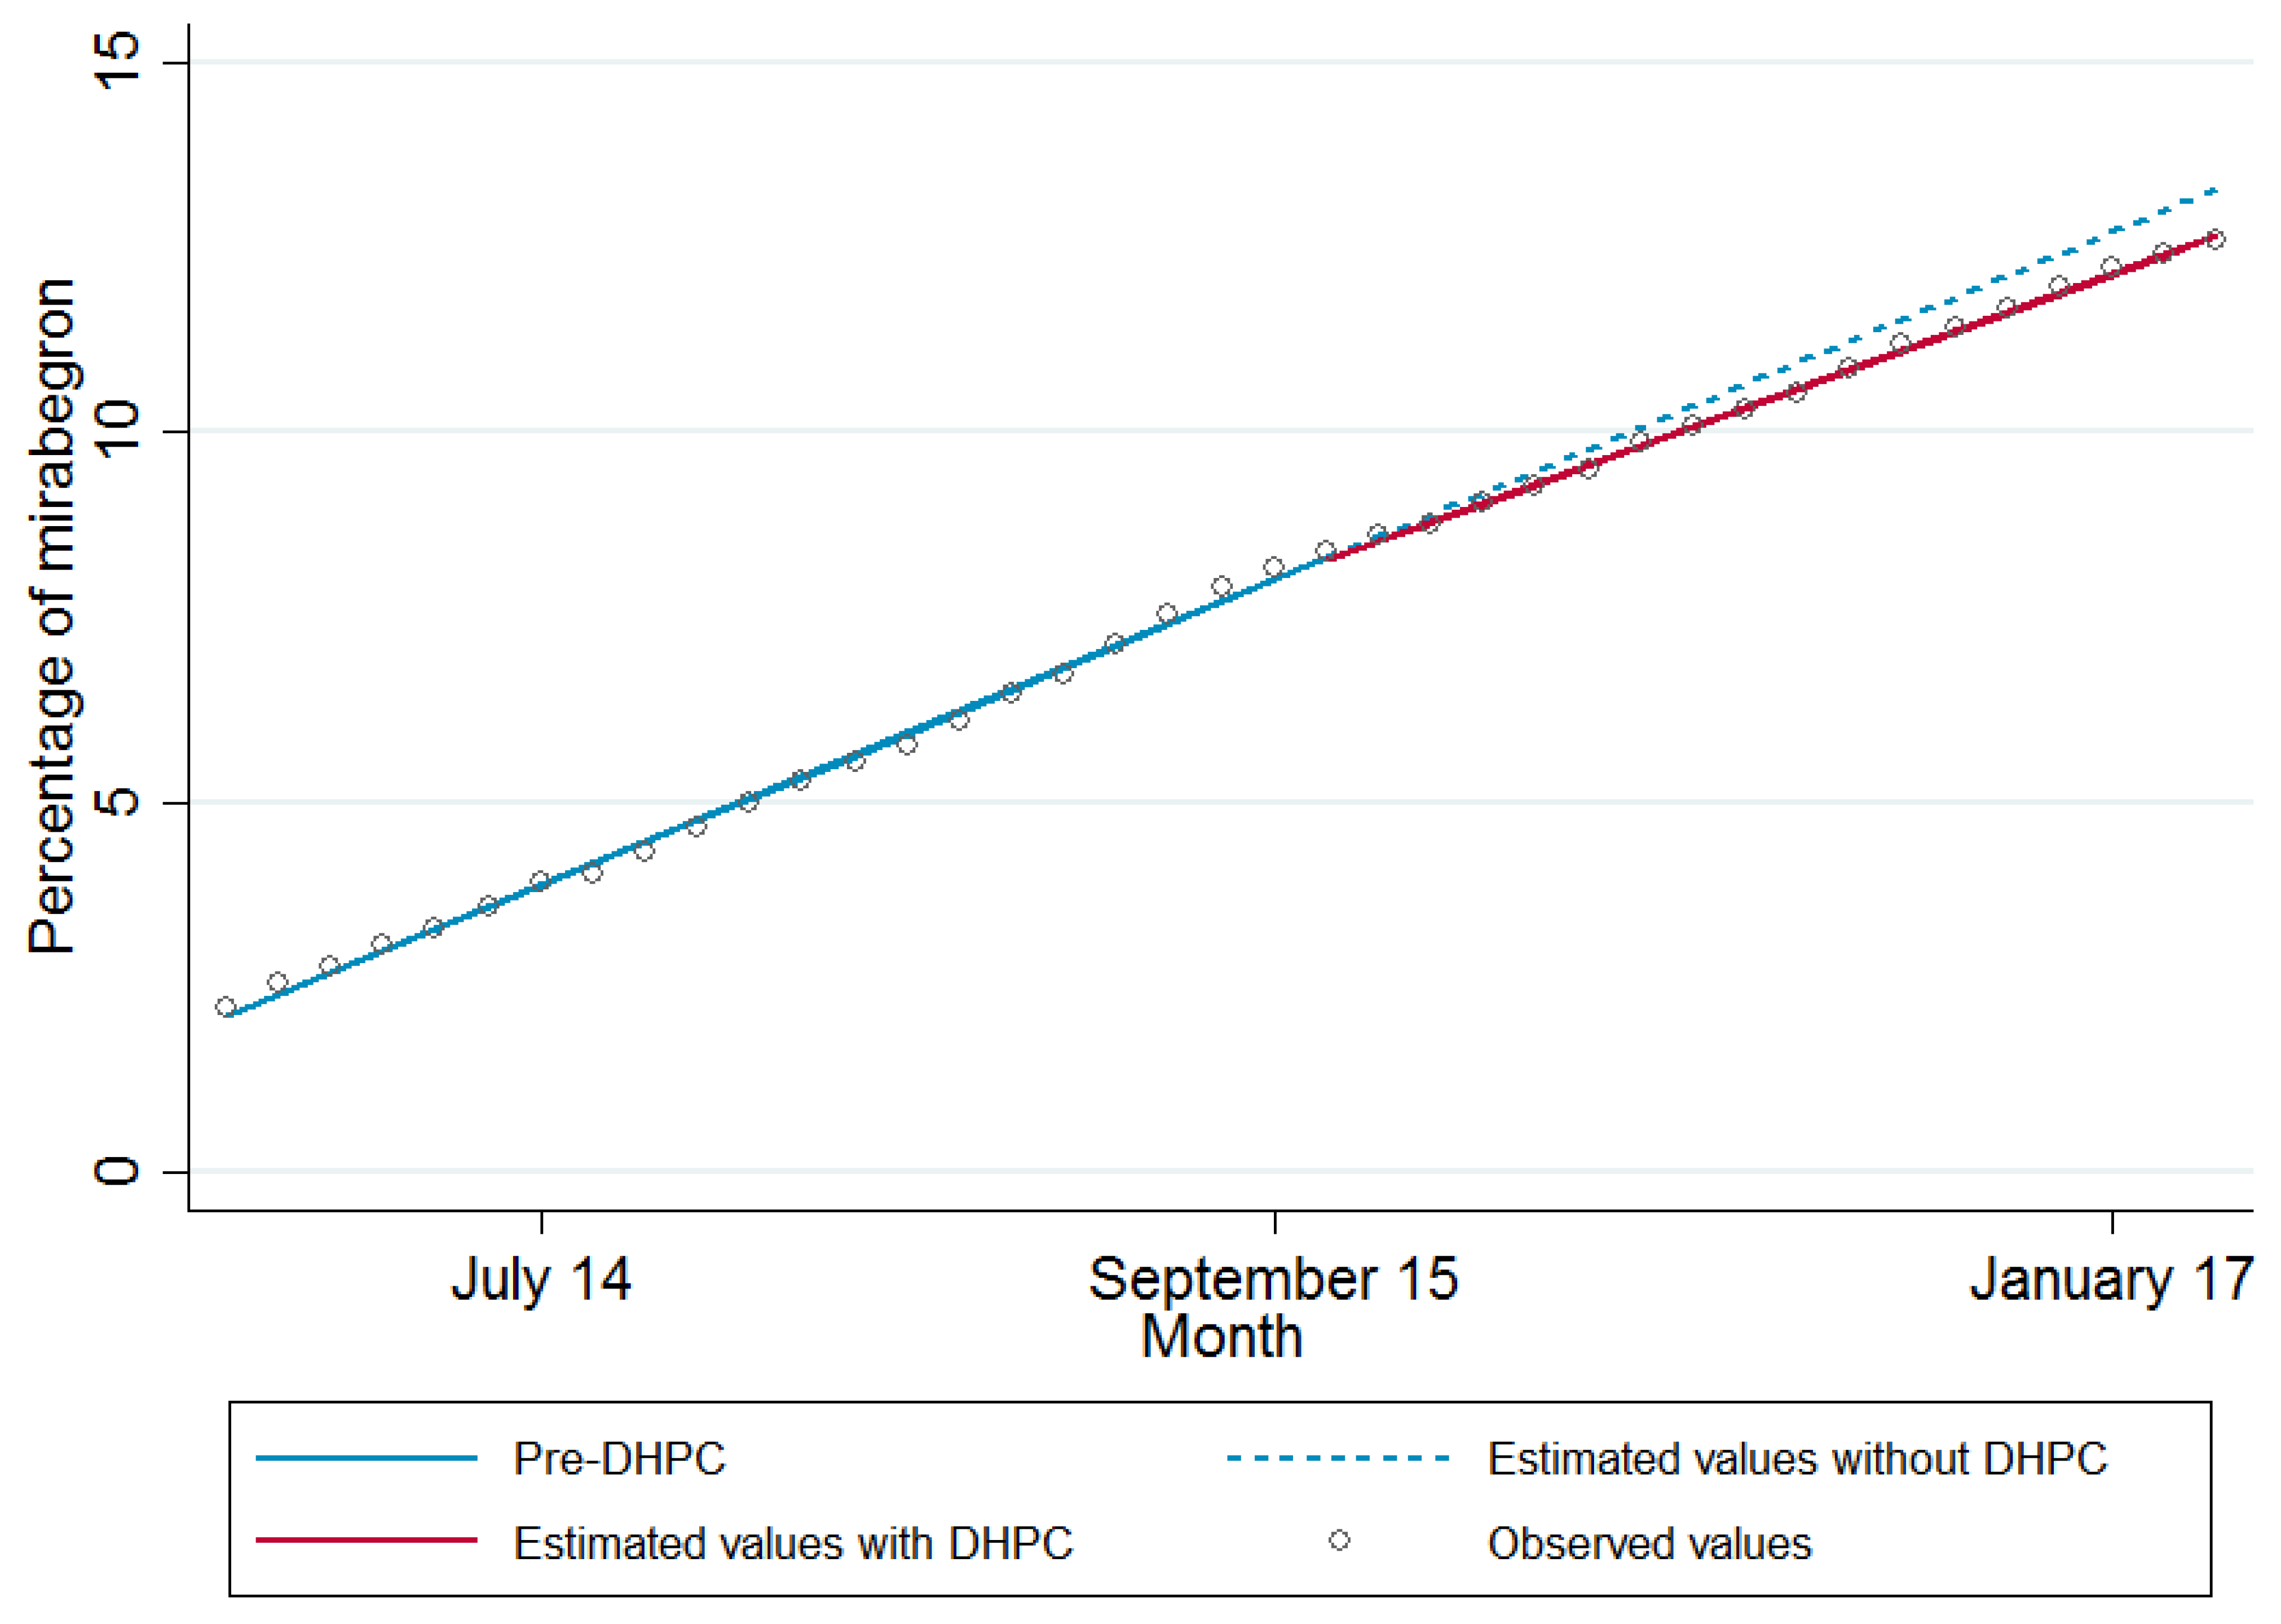
3. Results
4. Discussion
5. Conclusions
Supplementary Materials
Author Contributions
Funding
Acknowledgments
Conflicts of Interest
Data Availability
References
- Mol, P.G.M.; Straus, S.M.J.M.; Piening, S.; de Vries, J.T.N.; de Graeff, P.A.; Haaijer-Ruskamp, F.M. A Decade of Safety-Related Regulatory Action in the Netherlands. Drug Saf. 2010, 33, 463–474. [Google Scholar] [CrossRef] [PubMed]
- Warren, K.; Burden, H.; Abrams, P. Mirabegron in overactive bladder patients: Efficacy review and update on drug safety. Ther. Adv. Drug Saf. 2016, 7, 204–216. [Google Scholar] [CrossRef] [PubMed]
- Risacher, S.L.; McDonald, B.C.; Tallman, E.F.; West, J.D.; Farlow, M.R.; Unverzagt, F.W.; Gao, S.; Boustani, M.; Crane, P.K.; Petersen, R.C.; et al. Association Between Anticholinergic Medication Use and Cognition, Brain Metabolism, and Brain Atrophy in Cognitively Normal Older Adults. JAMA Neurol. 2016, 332, 455–459. [Google Scholar] [CrossRef] [PubMed]
- Medicines and Healthcare Products Regulatory Agency. Mirabegron (Betmiga▼): Risk of Severe Hypertension and Associated Cerebrovascular and Cardiac Events. In Drug Saf. Update; 2015; 9, p. 1. Available online: http://medicinesauthority.gov.mt/file.aspx?f=3689 (accessed on 13 August 2018).
- Piening, S.; Haaijer-Ruskamp, F.M.; de Vries, J.T.N.; van der Elst, M.E.; de Graeff, P.A.; Straus, S.M.J.M.; Mol, P.G.M. Impact of safety-related regulatory action on clinical practice: A systematic review. Drug Saf. 2012, 35, 373–385. [Google Scholar] [CrossRef] [PubMed]
- Guthrie, B.; Clark, S.A.; Reynish, E.L.; McCowan, C.; Morales, D.R. Differential impact of two risk communications on antipsychotic prescribing to people with dementia in Scotland: Segmented regression time series analysis 2001–2011. PLoS ONE 2013, 8, e68976. [Google Scholar] [CrossRef] [PubMed]
- Stocks, S.J.; Kontopantelis, E.; Webb, R.T.; Avery, A.J.; Burns, A.; Ashcroft, D.M. Antipsychotic Prescribing to Patients Diagnosed with Dementia Without a Diagnosis of Psychosis in the Context of National Guidance and Drug Safety Warnings: Longitudinal Study in UK General Practice. Drug Saf. 2017, 40, 679–692. [Google Scholar] [CrossRef] [PubMed]
- Reber, K.C.; Piening, S.; Wieringa, J.E.; Straus, S.M.J.M.; Raine, J.M.; de Graeff, P.A.; Haaijer-Ruskamp, F.M.; Mol, P.G.M. When direct health-care professional communications have an impact on inappropriate and unsafe use of medicines. Clin. Pharmacol. Ther. 2013, 93, 360–365. [Google Scholar] [CrossRef] [PubMed]
- Von Elm, E.; Altman, D.G.; Egger, M.; Pocock, S.J.; Gøtzsche, P.C.; Vandenbroucke, J.P. The Strengthening the Reporting of Observational Studies in Epidemiology (STROBE) statement: Guidelines for reporting observational studies. PLoS Med. 2007, 4, e296. [Google Scholar] [CrossRef] [PubMed]
- Wagner, A.; Soumerai, S.; Zhang, F.; Ross-Degnan, D. Segmented regression analysis of interrupted time series studies in medication use research. J. Clin. Pharm. Ther. 2002, 27, 299–309. [Google Scholar] [CrossRef] [PubMed]
- Ashworth, M.; White, P.; Jongsma, H.; Schofield, P.; Armstrong, D. Antibiotic prescribing and patient satisfaction in primary care in England: Cross-sectional analysis of national patient survey data and prescribing data. Br. J. Gen. Pract. 2016, 66, e40–e46. [Google Scholar] [CrossRef] [PubMed]
- Appleby, J.; Raleigh, V.; Frosini, F.; Bevan, G.; Gao, H.; Lyscom, T. Variations in Health Care: The Good, the Bad and the Inexplicable; Kings Fund: London, UK, 2011; Available online: http://www.kingsfund.org.uk/document.rm?id=9076 (accessed on 13 August 2018).
- Ibáñez, B.; Librero, J.; Bernal-Delgado, E.; Peiró, S.; López-Valcarcel, B.G.; Martínez, N.; Aizpuru, F. Is there much variation in variation? Revisiting statistics of small area variation in health services research. BMC Health Serv. Res. 2009, 9, 60. [Google Scholar] [CrossRef] [PubMed]
- McPherson, K.; Wennberg, J.E.; Hovind, O.B.; Clifford, P. Small-Area Variations in the Use of Common Surgical Procedures: An International Comparison of New England, England, and Norway. N. Engl. J. Med. 1982, 307, 1310–1314. [Google Scholar] [CrossRef] [PubMed]
- Curtis, H.J.; Walker, A.J.; Goldacre, B. Impact of NICE guidance on tamoxifen prescribing in England 2011–2017: An interrupted time series analysis. Br. J. Cancer 2018, 118, 1268–1275. [Google Scholar] [CrossRef] [PubMed]
- Taylor, H.; Bell, J. Accelerated Access Review: Final Report. Review of Innovative Medicines and Medical Technologies; Wellcome Trust: London, UK, 2016. [Google Scholar]
- Barnett, K.; Mercer, S.W.; Norbury, M.; Watt, G.; Wyke, S.; Guthrie, B. Epidemiology of multimorbidity and implications for health care, research, and medical education: A cross-sectional study. Lancet 2012, 380, 37–43. [Google Scholar] [CrossRef]
- Payne, R.A.; Avery, A.J.; Duerden, M.; Saunders, C.L.; Simpson, C.R.; Abel, G.A. Prevalence of polypharmacy in a Scottish primary care population. Eur. J. Clin. Pharmacol. 2014, 70, 575–581. [Google Scholar] [CrossRef] [PubMed]
- Marmot, M.; Allen, J.; Bell, R.; Bloomer, E.; Goldblatt, P. WHO European review of social determinants of health and the health divide. Lancet 2012, 380, 1011–1029. [Google Scholar] [CrossRef]
- Mercer, S.W.; Watt, G.C. The inverse care law: Clinical primary care encounters in deprived and affluent areas of Scotland. Ann. Fam. Med. 2007, 5, 503–510. [Google Scholar] [CrossRef] [PubMed]
- McLean, G.; Guthrie, B.; Mercer, S.W.; Watt, G.C.M. General practice funding underpins the persistence of the inverse care law: Cross-sectional study in Scotland. Br. J. Gen. Pract 2015, 65, e799–e805. [Google Scholar] [CrossRef] [PubMed]
- Richardson, K.; Fox, C.; Maidment, I.; Steel, N.; Loke, Y.K.; Arthur, A.; Myint, P.K.; Grossi, C.M.; Mattishent, K.; Bennett, K.; et al. Anticholinergic drugs and risk of dementia: Case-control study. BMJ 2018, 361, k1315. [Google Scholar] [CrossRef] [PubMed]
- Kay, G.G.; Ebinger, U. Preserving cognitive function for patients with overactive bladder: Evidence for a differential effect with darifenacin. Int. J. Clin. Pract. 2008, 62, 1792–1800. [Google Scholar] [CrossRef] [PubMed]
- Stocks, S.J.; Kontopantelis, E.; Akbarov, A.; Rodgers, S.; Avery, A.J.; Ashcroft, D.M. Examining variations in prescribing safety in UK general practice: Cross sectional study using the Clinical Practice Research Datalink. BMJ 2015, 351, h5501. [Google Scholar] [CrossRef] [PubMed]
- Guthrie, B.; Donnan, P.T.; Murphy, D.J.; Makubate, B.; Dreischulte, T. Bad apples or spoiled barrels? Multilevel modelling analysis of variation in high-risk prescribing in Scotland between general practitioners and between the practices they work in. BMJ Open 2015, 5, e008270. [Google Scholar] [CrossRef] [PubMed]
- Thomas, S.K.; Hodson, J.; McIlroy, G.; Dhami, A.; Coleman, J.J. The Impact of Direct Healthcare Professional Communication on Prescribing Practice in the UK Hospital Setting: An Interrupted Time Series Analysis. Drug Saf. 2013, 36, 557–564. [Google Scholar] [CrossRef] [PubMed]
- Ruiter, R.; Visser, L.E.; van Herk-Sukel, M.P.P.; Geelhoed-Duijvestijn, P.H.; de Bie, S.; Straus, S.M.J.M.; Mol, P.G.M.; Romio, S.A.; Herings, R.M.C.; Stricker, B.H.C. Prescribing of Rosiglitazone and Pioglitazone Following Safety Signals. Drug Saf. 2012, 35, 471–480. [Google Scholar] [CrossRef] [PubMed]
- Bahri, P.; Harrison-Woolrych, M. Focusing on risk communication about medicines: Why now? Drug Saf. 2012, 35, 971–975. [Google Scholar] [CrossRef] [PubMed]
- Strengthening Collaborations for Operating Pharmacovigilance in Europe (SCOPE) Joint Action [Internet]. Available online: http://www.scopejointaction.eu. (accessed on 13 August 2018).
- De Vries, S.T.; van der Sar, M.J.M.; Cupelli, A.; Baldelli, l.; Coleman, A.M.; Montero, D.; Šipić, I.; Andrić, A.; Wennberg, A.; Ahlqvist-Rastad, J.; et al. Communication on Safety of Medicines in Europe: Current Practices and General Practitioners’ Awareness and Preferences. Drug Saf. 2017, 40, 729–742. [Google Scholar] [CrossRef] [PubMed]
- De Vries, S.T.; van der Sar, M.J.M.; Coleman, A.M.; Escudero, Y.; Rodríguez Pascual, A.; Maciá Martínez, M.Á.; Cupelli, A.; Baldelli, I.; Šipić, I.; Andrić, A.; et al. Safety Communication Tools and Healthcare Professionals’ Awareness of Specific Drug Safety Issues in Europe: A Survey Study. Drug Saf. 2018, 41, 713–724. [Google Scholar] [CrossRef] [PubMed]
- Piening, S.; de Graeff, P.A.; Straus, S.M.J.M.; Haaijer-Ruskamp, F.M.; Mol, P.G.M. The Additional Value of an E-Mail to Inform Healthcare Professionals of a Drug Safety Issue: A Randomized Controlled Trial in the Netherlands. Drug Saf. 2013, 36, 723–731. [Google Scholar] [CrossRef] [PubMed]
- Goedecke, T.; Morales, D.R.; Pacurariu, A.; Kurz, X. Measuring the impact of medicines regulatory interventions-Systematic review and methodological considerations. Br. J. Clin. Pharmacol. 2018, 84, 419–433. [Google Scholar] [CrossRef] [PubMed]
- Briesacher, B.A.; Soumerai, S.B.; Zhang, F.; Toh, S.; Andrade, S.E.; Wagner, J.L.; Shoaibi, A.; Gurwitz, J.H. A critical review of methods to evaluate the impact of FDA regulatory actions. Pharmacoepidemiol. Drug Saf. 2013, 22, 986–994. [Google Scholar] [CrossRef] [PubMed]
- Dusetzina, S.B.; Higashi, A.S.; Dorsey, E.R.; Conti, R.; Huskamp, H.A.; Zhu, S.; Garfield, C.F.; Alexander, G.C. Impact of FDA drug risk communications on health care utilization and health behaviors: A systematic review. Med. Care 2012, 50, 466–478. [Google Scholar] [CrossRef] [PubMed]
- Lopez Bernal, J.; Cummins, S.; Gasparrini, A. Interrupted time series regression for the evaluation of public health interventions: A tutorial. Int. J. Epidemiol. 2017, 348–355. [Google Scholar] [CrossRef] [PubMed]
- Kesselheim, A.S.; Campbell, E.G.; Schneeweiss, S.; Rausch, P.; Lappin, B.M.; Zhou, E.H.; Seeger, J.D.; Brownstein, J.S.; Woloshin, S.; Schwartz, L.M.; et al. Methodological Approaches to Evaluate the Impact of FDA Drug Safety Communications. Drug Saf. 2015, 38, 565–575. [Google Scholar] [CrossRef] [PubMed]
- Smith, M.Y.; Morrato, E. Advancing the field of pharmaceutical risk minimization through application of implementation science best practices. Drug Saf. 2014, 37, 569–580. [Google Scholar] [CrossRef] [PubMed]
- Glasziou, P.; Haynes, B. The paths from research to improved health outcomes. ACP J. Club 2005, 142, 8–10. [Google Scholar]
- Roshanov, P.S.; Fernandes, N.; Wilczynski, J.M.; Hemens, B.J.; You, J.J.; Handler, S.M.; Nieuwlaat, R.; Souza, N.M.; Beyene, J.; Spall, H.G.C.V.; et al. Features of effective computerised clinical decision support systems: Meta-regression of 162 randomised trials. BMJ 2013, 346, f657. [Google Scholar] [CrossRef] [PubMed]
- Lin, C.-P.; Guirguis-Blake, J.; Keppel, G.A.; Dobie, S.; Osborn, J.; Cole, A.M.; Baldwin, L.-M. Using the diffusion of innovations theory to assess socio-technical factors in planning the implementation of an electronic health record alert across multiple primary care clinics. J. Innov. Heal. Inform. 2016, 23, 450–458. [Google Scholar] [CrossRef] [PubMed]


| Parameters | Adjusted Coefficient * (95% Confidence Interval) | p Value |
|---|---|---|
| Monthly trend (slope) | 0.294 (0.287 to 0.301) | <0.001 |
| Change in monthly trend post DHPC | −0.036 (−0.049 to −0.023) | <0.001 |
| Level of prescribing at point of DHPC (intercept) | 8.30 (8.16 to 8.44) | <0.001 |
| Change in level immediately post DHPC | −0.023 (−0.105 to 0.058) | 0.574 |
| n (%) | ||
|---|---|---|
| Change in Level | Change in Slope | |
| Decrease a | 133 (1.8) | 529 (7.1) |
| No change | 7133 (96.3) | 6545 (88.4) |
| Increase b | 142 (1.9) | 334 (4.5) |
| Outcome of a Decrease in Level a | Outcome of a Decrease in Slope a | |||
|---|---|---|---|---|
| Adjusted Odds Ratio (95% Confidence Interval) | p Value | Adjusted Odds Ratio (95% Confidence Interval) | p Value | |
| GP workforce characteristics | ||||
| GP full time equivalents | 0.93 (0.52 to 1.66) | 0.811 | 0.83 (0.63 to 1.09) | 0.177 |
| Proportion of female GPs | 1.10 (0.95 to 1.28) | 0.189 | 1.05 (0.97 to 1.15) | 0.238 |
| Proportion of GPs aged 45 and over | 1.10 (0.94 to 1.30) | 0.236 | 1.04 (0.95 to 1.14) | 0.344 |
| Any registrars b | 0.83 (0.60 to 1.16) | 0.283 | 1.08 (0.95 to 1.23) | 0.233 |
| Patient characteristics | ||||
| Number of registered patients | 0.40 (0.24 to 0.67) | <0.001 | 0.57 (0.45 to 0.73) | <0.001 |
| Proportion of female patients | 0.90 (0.80 to 1.02) | 0.091 | 0.97 (0.89 to 1.05) | 0.464 |
| Proportion of registered patients aged 65 and over | 0.52 (0.36 to 0.75) | 0.001 | 0.88 (0.74 to 1.06) | 0.180 |
| Other practice characteristics | ||||
| Overall QOF score percentage c | 0.91 (0.80 to 1.05) | 0.188 | 0.97 (0.90 to 1.06) | 0.525 |
| Hypertension prevalence | 1.07 (0.81 to 1.42) | 0.619 | 0.90 (0.77 to 1.04) | 0.154 |
| Dementia prevalence | 0.83 (0.53 to 1.31) | 0.428 | 0.83 (0.67 to 1.04) | 0.102 |
| Index of multiple deprivation (deciles) | 1.30 (1.07 to 1.59) | 0.010 | 1.22 (1.10 to 1.35) | <0.001 |
© 2018 by the authors. Licensee MDPI, Basel, Switzerland. This article is an open access article distributed under the terms and conditions of the Creative Commons Attribution (CC BY) license (http://creativecommons.org/licenses/by/4.0/).
Share and Cite
Moriarty, F.; Razzaque, S.; McDowell, R.; Fahey, T. Prescribing Variation in General Practices in England Following a Direct Healthcare Professional Communication on Mirabegron. J. Clin. Med. 2018, 7, 320. https://doi.org/10.3390/jcm7100320
Moriarty F, Razzaque S, McDowell R, Fahey T. Prescribing Variation in General Practices in England Following a Direct Healthcare Professional Communication on Mirabegron. Journal of Clinical Medicine. 2018; 7(10):320. https://doi.org/10.3390/jcm7100320
Chicago/Turabian StyleMoriarty, Frank, Shegufta Razzaque, Ronald McDowell, and Tom Fahey. 2018. "Prescribing Variation in General Practices in England Following a Direct Healthcare Professional Communication on Mirabegron" Journal of Clinical Medicine 7, no. 10: 320. https://doi.org/10.3390/jcm7100320
APA StyleMoriarty, F., Razzaque, S., McDowell, R., & Fahey, T. (2018). Prescribing Variation in General Practices in England Following a Direct Healthcare Professional Communication on Mirabegron. Journal of Clinical Medicine, 7(10), 320. https://doi.org/10.3390/jcm7100320