Demographic and Socio-Economic Disparities in the Outcomes Among Patients with NVAF Treated with Oral Anticoagulants: A Real-World Evaluation of Medicare Beneficiaries

 ,
,
Abstract
1. Introduction
2. Methods
2.1. Data Source
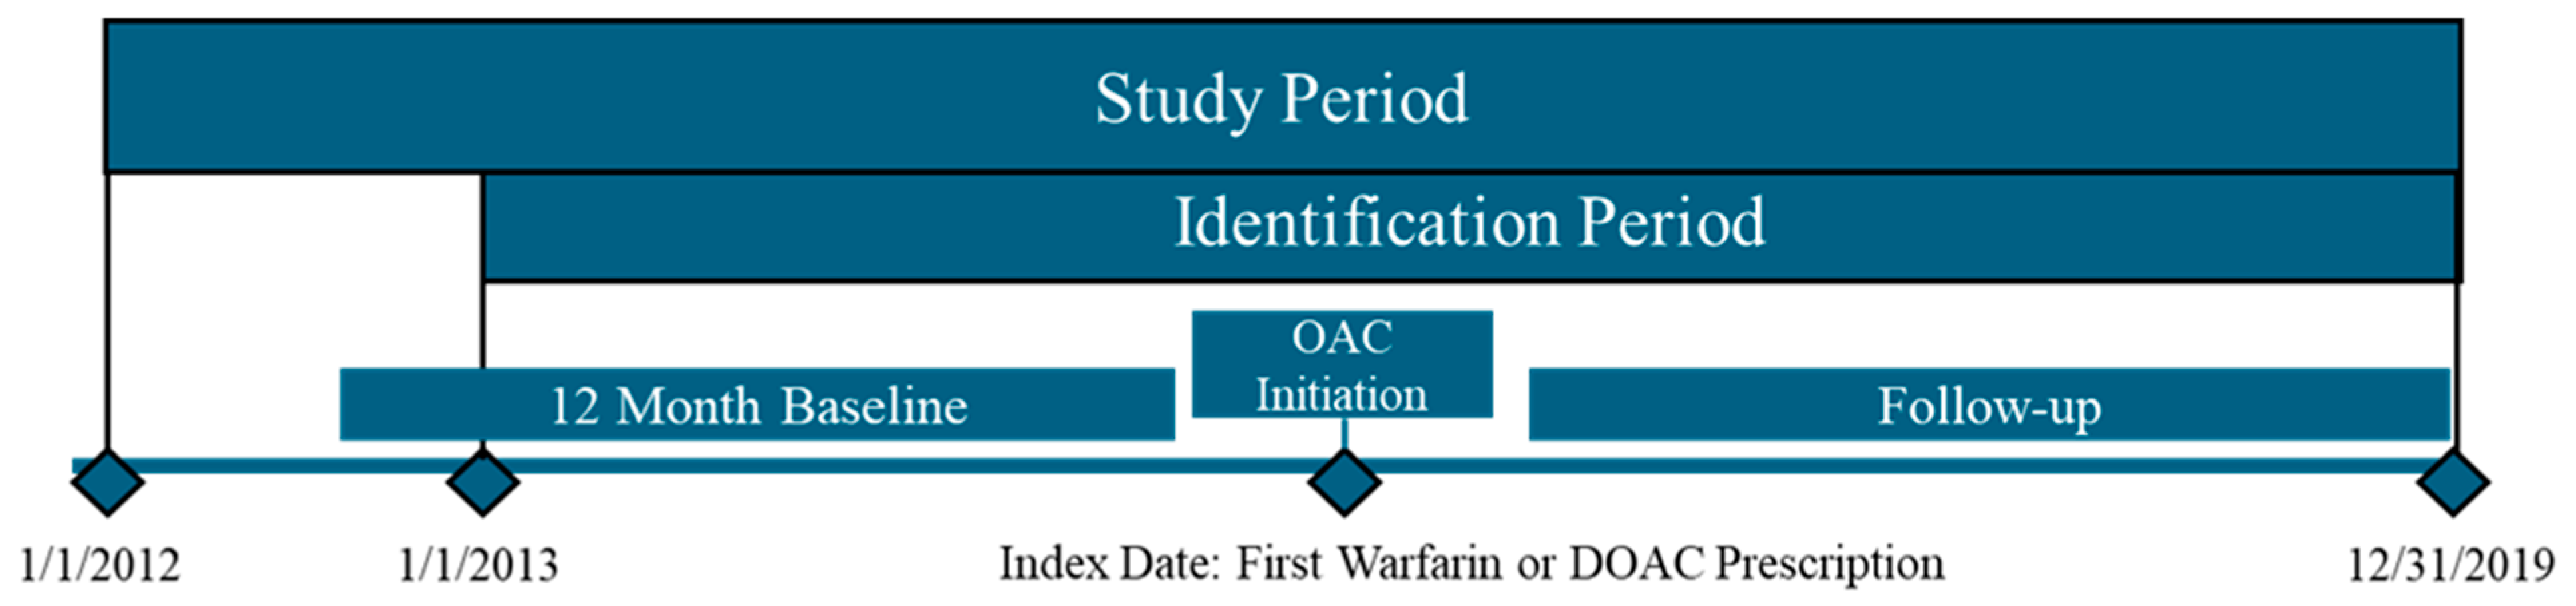
2.2. Study Design and Population
2.3. Exposure, Outcome, and Covariate Identification
2.4. Statistical Analysis
3. Results
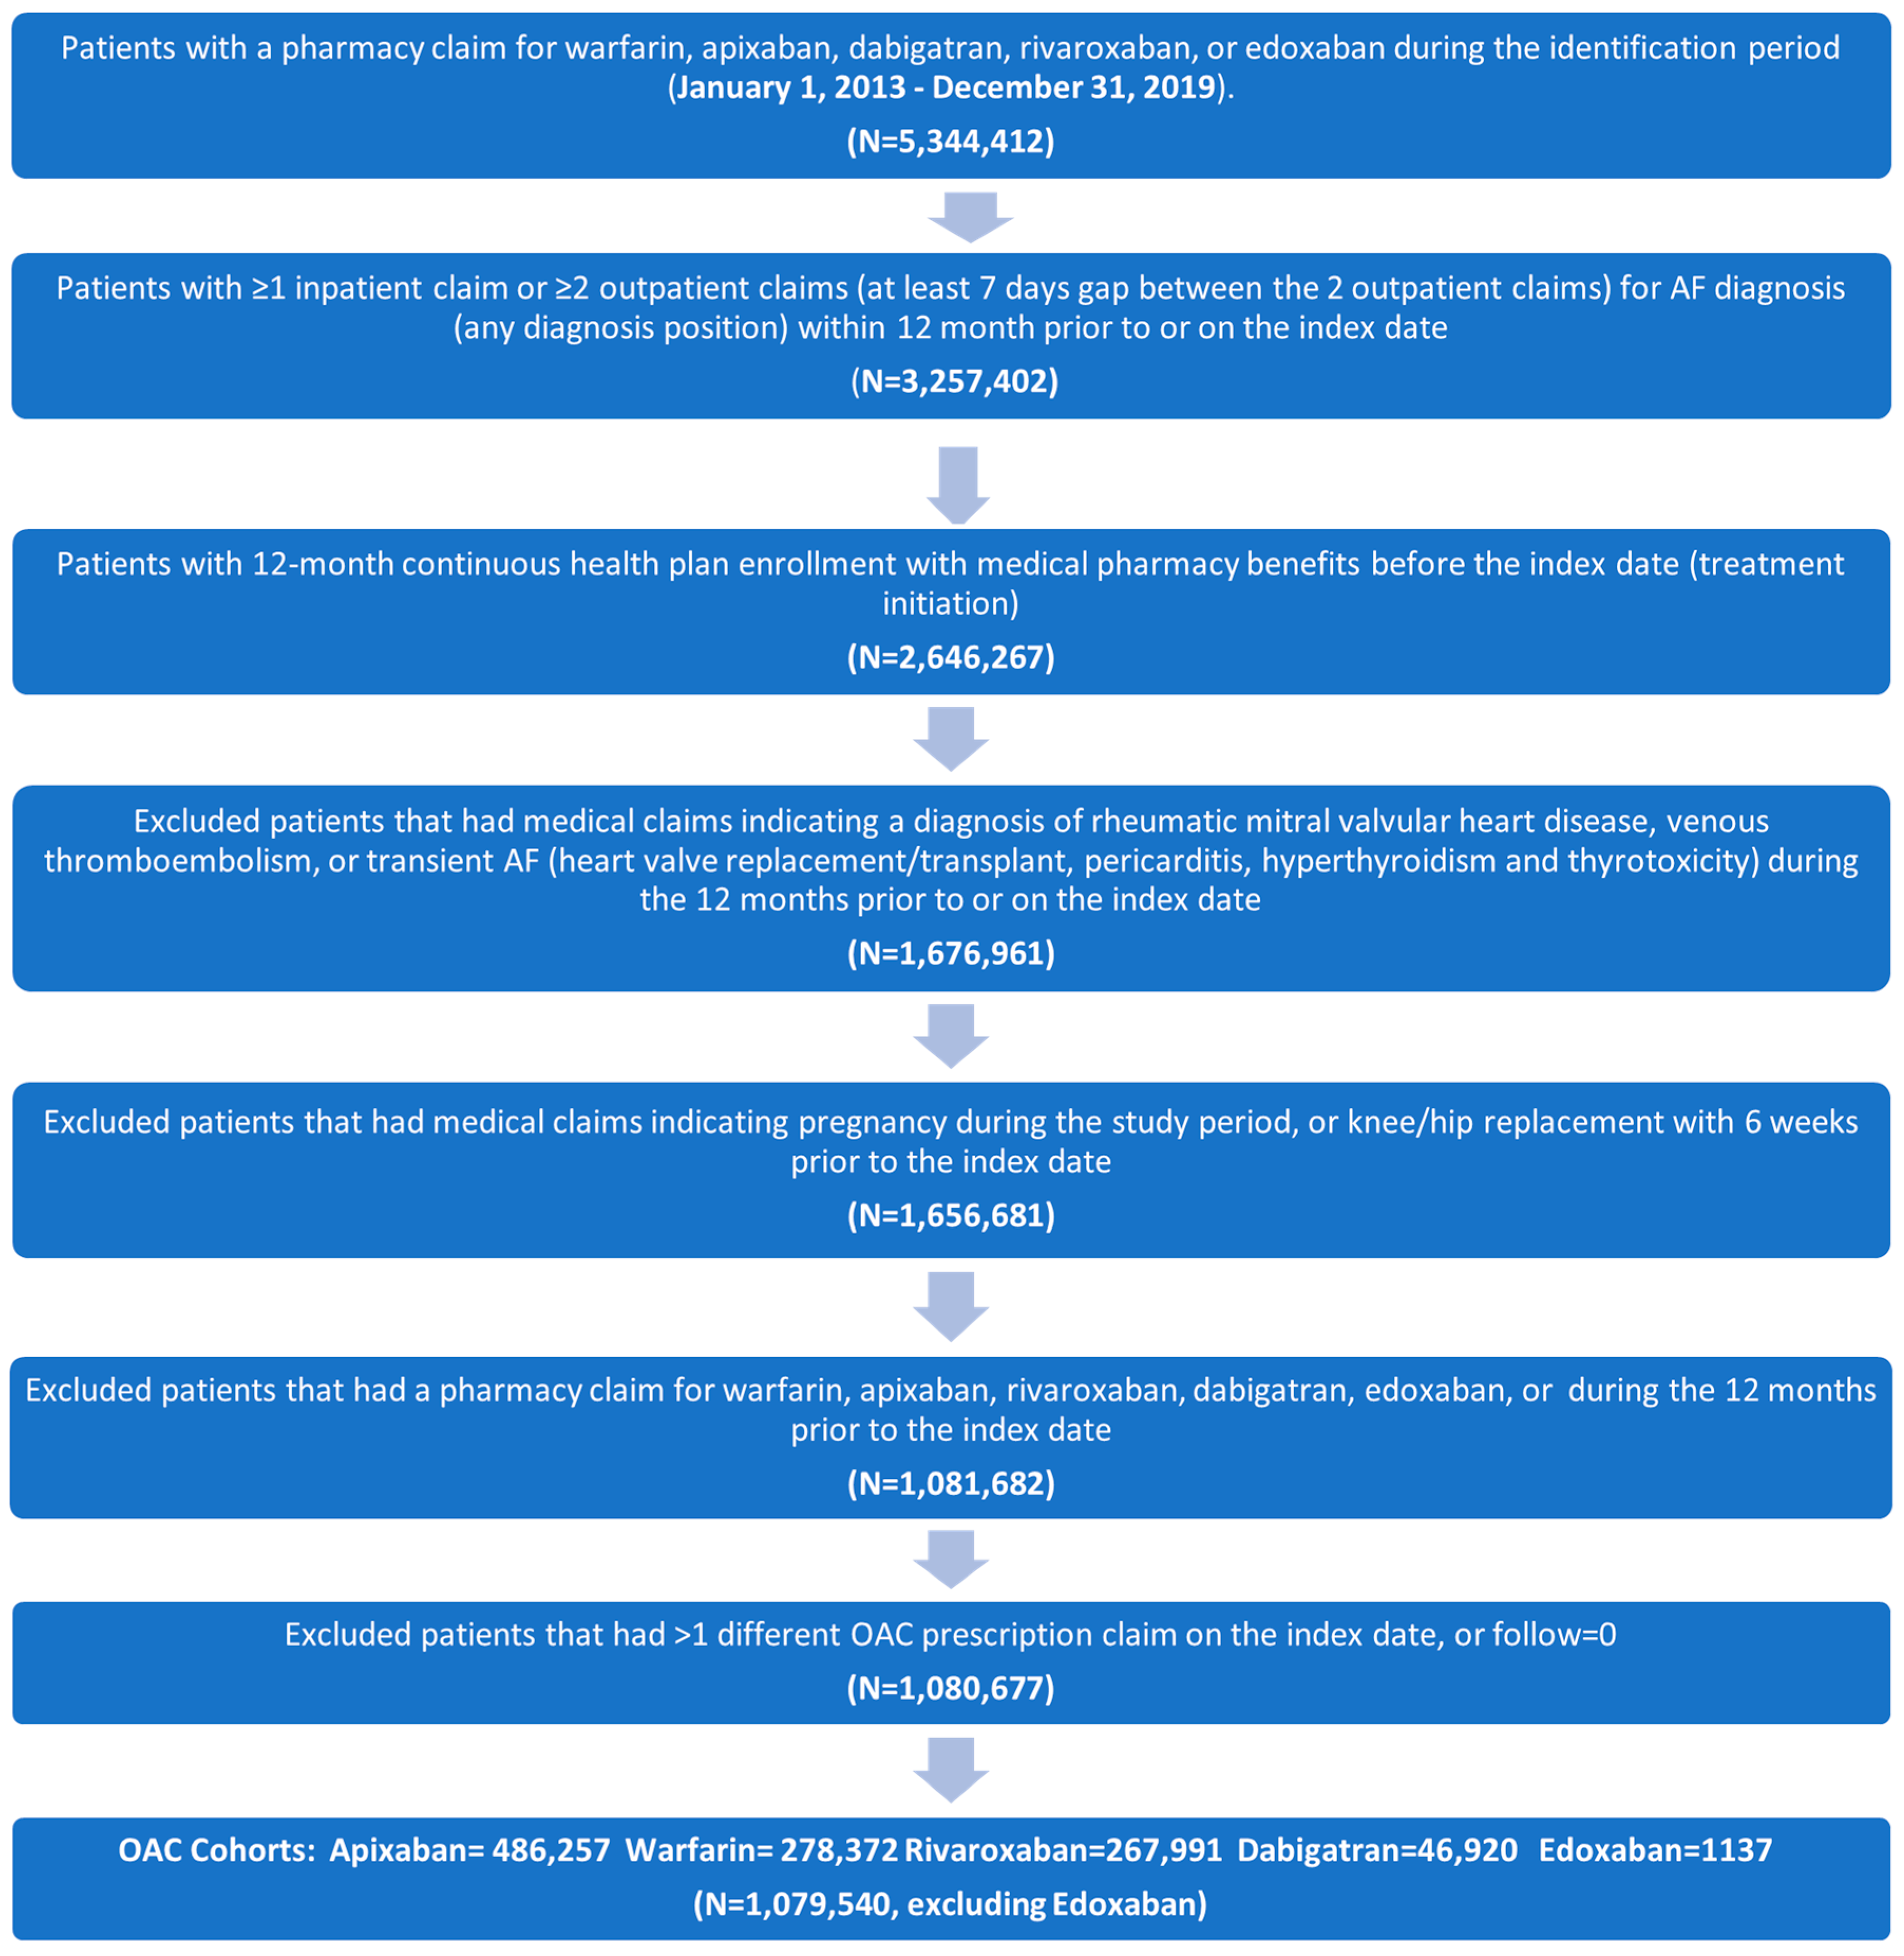
3.1. Study Cohorts and Baseline Characteristics
3.2. Outcomes
4. Discussion
5. Conclusions
Supplementary Materials
Author Contributions
Funding
Institutional Review Board Statement
Informed Consent Statement
Data Availability Statement
Conflicts of Interest
Abbreviations
| ACE | angiotensin-converting enzyme |
| AF | atrial fibrillation |
| ARB | angiotensin receptor blocker |
| CAD | coronary artery disease |
| CCI | Deyo–Charlson comorbidity index |
| CHF | congestive heart failure |
| CI | confidence interval |
| CMS | US Centers for Medicare and Medicaid Services |
| COPD | chronic obstructive pulmonary disease |
| DM | diabetes mellitus |
| FFS | fee-for-service |
| FPL | federal poverty level |
| DOAC | direct-acting oral anticoagulants |
| HIPAA | Health Insurance Portability and Accountability Act |
| HR | hazard ratio |
| ICD-9-CM | International Classification of Diseases, Ninth Revision, Clinical Modification |
| ICD-10-CM | International Classification of Diseases, Tenth Revision, Clinical Modification |
| INR | international normalized ratio |
| IPTW | inverse probability treatment weighting |
| IRB | institutional review board |
| LIS | low-income subsidy |
| MB | major bleeding |
| MI | myocardial infarction |
| NSAID | nonsteroidal anti-inflammatory drugs |
| NVAF | nonvalvular atrial fibrillation |
| OAC | oral anticoagulant |
| PAD | peripheral arterial disease |
| PVD | peripheral vascular disease |
| RA | receptor antagonist |
| SD | standard deviation |
| SE | systemic embolism |
| SES | socio-economic status |
| STD | standardized mean difference |
| TIA | transient ischemic attack |
| US | United States |
| VKA | vitamin K antagonist |
References
- Roth, G.A.; Mensah, G.A.; Johnson, C.O.; Addolorato, G.; Ammirati, E.; Baddour, L.M.; Barengo, N.C.; Beaton, A.Z.; Benjamin, E.J.; Benziger, C.P.; et al. Global Burden of Cardiovascular Diseases and Risk Factors, 1990–2019: Update from the GBD 2019 Study. J. Am. Coll. Cardiol. 2020, 76, 2982–3021. [Google Scholar] [CrossRef] [PubMed]
- Colilla, S.; Crow, A.; Petkun, W.; Singer, D.E.; Simon, T.; Liu, X. Estimates of current and future incidence and prevalence of atrial fibrillation in the U.S. adult population. Am. J. Cardiol. 2013, 112, 1142–1147. [Google Scholar] [CrossRef] [PubMed]
- Virani, S.S.; Alonso, A.; Aparicio, H.J.; Benjamin, E.J.; Bittencourt, M.S.; Callaway, C.W.; Carson, A.P.; Chamberlain, A.M.; Cheng, S.; Delling, F.N.; et al. Heart Disease and Stroke Statistics-2021 Update: A Report from the American Heart Association. Circulation 2021, 143, e254–e743. [Google Scholar] [CrossRef] [PubMed]
- Ding, W.Y. Residual Stroke Risk in Atrial Fibrillation. Arrhythm. Electrophysiol. Rev. 2021, 10, 147–153. [Google Scholar] [CrossRef]
- Healey, J.S.; Connolly, S.J.; Gold, M.R.; Israel, C.W.; Van, G.I.; Capucci, A.; Lau, C.P.; Fain, E.; Yang, S.; Bailleul, C.; et al. Subclinical atrial fibrillation and the risk of stroke. N. Engl. J. Med. 2012, 366, 120–129. [Google Scholar] [CrossRef]
- Ali, A.N.; Abdelhafiz, A. Clinical and Economic Implications of AF Related Stroke. J. Atr. Fibrillation 2016, 8, 1279. [Google Scholar] [CrossRef]
- Deshmukh, A.; Iglesias, M.; Khanna, R.; Beaulieu, T. Healthcare utilization and costs associated with a diagnosis of incident atrial fibrillation. Heart Rhythm O2 2022, 3, 577–586. [Google Scholar] [CrossRef]
- January, C.T.; Wann, L.S.; Calkins, H.; Chen, L.Y.; Cigarroa, J.E.; Cleveland, J.C., Jr.; Ellinor, P.T.; Ezekowitz, M.D.; Field, M.E.; Furie, K.L.; et al. 2019 AHA/ACC/HRS Focused Update of the 2014 AHA/ACC/HRS Guideline for the Management of Patients with Atrial Fibrillation: A Report of the American College of Cardiology/American Heart Association Task Force on Clinical Practice Guidelines and the Heart Rhythm Society in Collaboration with the Society of Thoracic Surgeons. Circulation 2019, 140, e125–e151. [Google Scholar] [CrossRef]
- Joglar, J.A.; Chung, M.K.; Armbruster, A.L.; Benjamin, E.J.; Chyou, J.Y.; Cronin, E.M.; Deswal, A.; Eckhardt, L.L.; Goldberger, Z.D.; Gopinathannair, R.; et al. 2023 ACC/AHA/ACCP/HRS Guideline for the Diagnosis and Management of Atrial Fibrillation: A Report of the American College of Cardiology/American Heart Association Joint Committee on Clinical Practice Guidelines. J. Am. Coll. Cardiol. 2024, 83, 109–279. [Google Scholar] [CrossRef]
- Hart, R.G.; Benavente, O.; McBride, R.; Pearce, L.A. Antithrombotic therapy to prevent stroke in patients with atrial fibrillation: A meta-analysis. Ann. Intern. Med. 1999, 131, 492–501. [Google Scholar] [CrossRef]
- Cannegieter, S.C.; Rosendaal, F.R.; Wintzen, A.R.; van der Meer, F.J.; Vandenbroucke, J.P.; Briët, E. Optimal oral anticoagulant therapy in patients with mechanical heart valves. N. Engl. J. Med. 1995, 333, 11–17. [Google Scholar] [CrossRef] [PubMed]
- Oden, A.; Fahlen, M.; Hart, R.G. Optimal INR for prevention of stroke and death in atrial fibrillation: A critical appraisal. Thromb. Res. 2006, 117, 493–499. [Google Scholar] [CrossRef] [PubMed]
- Hylek, E.M.; Go, A.S.; Chang, Y.; Jensvold, N.G.; Henault, L.E.; Selby, J.V.; Singer, D.E. Effect of intensity of oral anticoagulation on stroke severity and mortality in atrial fibrillation. N. Engl. J. Med. 2003, 349, 1019–1026. [Google Scholar] [CrossRef] [PubMed]
- Spyropoulos, A.C. Managing oral anticoagulation requires expert experience and clinical evidence. J. Thromb. Thrombolysis 2006, 21, 91–94. [Google Scholar] [CrossRef]
- Ay, H.; Arsava, E.M.; Gungor, L.; Greer, D.; Singhal, A.B.; Furie, K.L.; Koroshetz, W.J.; Sorensen, A.G. Admission international normalized ratio and acute infarct volume in ischemic stroke. Ann. Neurol. 2008, 64, 499–506. [Google Scholar] [CrossRef]
- Birman-Deych, E.; Radford, M.J.; Nilasena, D.S.; Gage, B.F. Use and effectiveness of warfarin in Medicare beneficiaries with atrial fibrillation. Stroke 2006, 37, 1070–1074. [Google Scholar] [CrossRef]
- Nelson, W.W.; Milentijevic, D.; Wang, L.; Baser, O.; Damaraju, C.V.; Schein, J.R. Patterns of international normalized ratio values among new warfarin patients with nonvalvular atrial fibrillation. Blood Coagul. Fibrinolysis 2016, 27, 899–906. [Google Scholar] [CrossRef]
- Granger, C.B.; Alexander, J.H.; McMurray, J.J.; Lopes, R.D.; Hylek, E.; Hanna, M.; Al-Khalidi, H.R.; Ansell, J.; Atar, D.; Avezum, A.; et al. Apixaban versus warfarin in patients with atrial fibrillation. N. Engl. J. Med. 2011, 365, 981–992. [Google Scholar] [CrossRef]
- Patel, M.R.; Mahaffey, K.W.; Garg, J.; Pan, G.; Singer, D.E.; Hacke, W.; Breithardt, G.; Halperin, J.L.; Hankey, G.J.; Piccini, J.P.; et al. Rivaroxaban versus warfarin in nonvalvular atrial fibrillation. N. Engl. J. Med. 2011, 365, 883–891. [Google Scholar] [CrossRef]
- Alcalai, R.; Butnaru, A.; Moravsky, G.; Yagel, O.; Rashad, R.; Ibrahimli, M.; Planer, D.; Amir, O.; Elbaz-Greener, G.; Leibowitz, D. Apixaban vs. warfarin in patients with left ventricular thrombus: A prospective multicentre randomized clinical trial. Eur. Heart J. Cardiovasc. Pharmacother. 2022, 8, 660–667. [Google Scholar] [CrossRef]
- Connolly, S.J.; Ezekowitz, M.D.; Yusuf, S.; Eikelboom, J.; Oldgren, J.; Parekh, A.; Pogue, J.; Reilly, P.A.; Themeles, E.; Varrone, J.; et al. Dabigatran versus warfarin in patients with atrial fibrillation. N. Engl. J. Med. 2009, 361, 1139–1151. [Google Scholar] [CrossRef] [PubMed]
- Giugliano, R.P.; Ruff, C.T.; Braunwald, E.; Murphy, S.A.; Wiviott, S.D.; Halperin, J.L.; Waldo, A.L.; Ezekowitz, M.D.; Weitz, J.I.; Spinar, J.; et al. Edoxaban versus warfarin in patients with atrial fibrillation. N. Engl. J. Med. 2013, 369, 2093–2104. [Google Scholar] [CrossRef] [PubMed]
- Fawzy, A.M.; Yang, W.Y.; Lip, G.Y. Safety of direct oral anticoagulants in real-world clinical practice: Translating the trials to everyday clinical management. Expert. Opin. Drug Saf. 2019, 18, 187–209. [Google Scholar] [CrossRef] [PubMed]
- Miyazaki, S.; Miyauchi, K.; Hayashi, H.; Yamashiro, K.; Tanaka, R.; Nishizaki, Y.; Nojiri, S.; Suwa, S.; Sumiyoshi, M.; Nakazato, Y.; et al. Trends of anticoagulant use and outcomes of patients with non-valvular atrial fibrillation: Findings from the RAFFINE registry. J. Cardiol. 2022, 80, 41–48. [Google Scholar] [CrossRef]
- Chen, H.Y.; Ou, S.H.; Huang, C.W.; Lee, P.T.; Chou, K.J.; Lin, P.C.; Su, Y.C. Efficacy and Safety of Direct Oral Anticoagulants vs. Warfarin in Patients with Chronic Kidney Disease and Dialysis Patients: A Systematic Review and Meta-Analysis. Clin. Drug Investig. 2021, 41, 341–351. [Google Scholar] [CrossRef]
- Harrington, J.; Carnicelli, A.P.; Hua, K.; Wallentin, L.; Patel, M.R.; Hohnloser, S.H.; Giugliano, R.P.; Fox, K.A.A.; Hijazi, Z.; Lopes, R.D.; et al. Direct Oral Anticoagulants Versus Warfarin Across the Spectrum of Kidney Function: Patient-Level Network Meta-Analyses from COMBINE AF. Circulation 2023, 147, 1748–1757. [Google Scholar] [CrossRef]
- Lip, G.Y.H.; Keshishian, A.; Li, X.; Hamilton, M.; Masseria, C.; Gupta, K.; Luo, X.; Mardekian, J.; Friend, K.; Nadkarni, A.; et al. Effectiveness and Safety of Oral Anticoagulants Among Nonvalvular Atrial Fibrillation Patients. Stroke 2018, 49, 2933–2944. [Google Scholar] [CrossRef]
- Atreja, N.; Dubey, A.; Kang, A.; Jiang, J.; Hagan, M.; Michael-Asalu, A.; Cheng, D.; Deitelzweig, S. Effectiveness and Safety in Patients with Non-Valvular Atrial Fibrillation Who Switched from Warfarin to Direct Oral Anticoagulants in Medicare Population. Adv. Ther. 2025, 42, 1462–1483. [Google Scholar] [CrossRef]
- Deitelzweig, S.; Farmer, C.; Luo, X.; Vo, L.; Li, X.; Hamilton, M.; Horblyuk, R.; Ashaye, A. Risk of major bleeding in patients with non-valvular atrial fibrillation treated with oral anticoagulants: A systematic review of real-world observational studies. Curr. Med. Res. Opin. 2017, 33, 1583–1594. [Google Scholar] [CrossRef]
- Hallinen, T.; Soini, E.; Asseburg, C.; Linna, M.; Eloranta, P.; Sintonen, S.; Kosunen, M. Cost-Effectiveness of Apixaban versus Other Direct Oral Anticoagulants and Warfarin in the Prevention of Thromboembolic Complications Among Finnish Patients with Non-Valvular Atrial Fibrillation. ClinicoEconomics Outcomes Res. 2021, 13, 745–755. [Google Scholar] [CrossRef]
- Ray, W.A.; Chung, C.P.; Stein, C.M.; Smalley, W.; Zimmerman, E.; Dupont, W.D.; Hung, A.M.; Daugherty, J.R.; Dickson, A.; Murray, K.T. Association of Rivaroxaban vs. Apixaban with Major Ischemic or Hemorrhagic Events in Patients with Atrial Fibrillation. JAMA 2021, 326, 2395–2404. [Google Scholar] [CrossRef] [PubMed]
- Deitelzweig, S.; Kang, A.; Jiang, J.; Gao, C.; Luo, X.; Atreja, N.; Han, S.; Cheng, D.; Loganathan, S.R.; Lip, G.Y.H. Clinical Impact of Switching or Continuation of Apixaban or Rivaroxaban among Patients with Non-Valvular Atrial Fibrillation. J. Clin. Med. 2024, 13, 1073. [Google Scholar] [CrossRef] [PubMed]
- Wasmer, K.; Eckardt, L.; Breithardt, G. Predisposing factors for atrial fibrillation in the elderly. J. Geriatr. Cardiol. 2017, 14, 179–184. [Google Scholar] [CrossRef]
- Shroff, G.R.; Solid, C.A.; Herzog, C.A. Atrial fibrillation, stroke, and anticoagulation in Medicare beneficiaries: Trends by age, sex, and race, 1992–2010. J. Am. Heart Assoc. 2014, 3, e000756. [Google Scholar] [CrossRef]
- Essien, U.R.; Magnani, J.W.; Chen, N.; Gellad, W.F.; Fine, M.J.; Hernandez, I. Race/Ethnicity and Sex-Related Differences in Direct Oral Anticoagulant Initiation in Newly Diagnosed Atrial Fibrillation: A Retrospective Study of Medicare Data. J. Natl. Med. Assoc. 2020, 112, 103–108. [Google Scholar] [CrossRef]
- Nathan, A.S.; Geng, Z.; Dayoub, E.J.; Khatana, S.A.M.; Eberly, L.A.; Kobayashi, T.; Pugliese, S.C.; Adusumalli, S.; Giri, J.; Groeneveld, P.W. Racial, Ethnic, and Socioeconomic Inequities in the Prescription of Direct Oral Anticoagulants in Patients with Venous Thromboembolism in the United States. Circ. Cardiovasc. Qual. Outcomes 2019, 12, e005600. [Google Scholar] [CrossRef]
- Ugowe, F.E.; Jackson, L.R., II; Thomas, K.L. Racial and ethnic differences in the prevalence, management, and outcomes in patients with atrial fibrillation: A systematic review. Heart Rhythm 2018, 15, 1337–1345. [Google Scholar] [CrossRef]
- Alhuneafat, L.; Jabri, A.; Poornima, I.G.; Alrifai, N.; Ali, M.; Elhamdani, A.; Kyvernitakis, A.; Al-Abdouh, A.; Mhanna, M.; Hadaddin, F.; et al. Ethnic and Racial Disparities in Resource Utilization and In-hospital Outcomes Among Those Admitted for Atrial Fibrillation: A National Analysis. Curr. Probl. Cardiol. 2022, 47, 101365. [Google Scholar] [CrossRef]
- Sainani, K.L. Propensity scores: Uses and limitations. PM&R 2012, 4, 693–697. [Google Scholar] [CrossRef]
- Khachatryan, T.; Hauschild, C.; Hoff, J.; Contractor, T.; Khachatryan, A.; Tran, H.; Matsuo, B.; Jacobson, A.; Hilliard, A. Review of Direct Oral Anticoagulants and Guide for Effective Drug Utilization. Am. J. Cardiovasc. Drugs 2019, 19, 525–539. [Google Scholar] [CrossRef]
- López-López, J.A.; Sterne, J.A.C.; Thom, H.H.Z.; Higgins, J.P.T.; Hingorani, A.D.; Okoli, G.N.; Davies, P.A.; Bodalia, P.N.; Bryden, P.A.; Welton, N.J.; et al. Oral anticoagulants for prevention of stroke in atrial fibrillation: Systematic review, network meta-analysis, and cost effectiveness analysis. BMJ 2017, 359, j5058. [Google Scholar] [CrossRef] [PubMed]
- Deitelzweig, S.; Bergrath, E.; di Fusco, M.; Kang, A.; Savone, M.; Cappelleri, J.C.; Russ, C.; Betts, M.; Cichewicz, A.; Schaible, K.; et al. Real-world evidence comparing oral anticoagulants in non-valvular atrial fibrillation: A systematic review and network meta-analysis. Future Cardiol. 2022, 18, 393–405. [Google Scholar] [CrossRef] [PubMed]
- Essien, U.R.; Chiswell, K.; Kaltenbach, L.A.; Wang, T.Y.; Fonarow, G.C.; Thomas, K.L.; Turakhia, M.P.; Benjamin, E.J.; Rodriguez, F.; Fang, M.C.; et al. Association of Race and Ethnicity with Oral Anticoagulation and Associated Outcomes in Patients with Atrial Fibrillation: Findings from the Get with the Guidelines-Atrial Fibrillation Registry. JAMA Cardiol. 2022, 7, 1207–1217. [Google Scholar] [CrossRef] [PubMed]
- Zhu, J.; Alexander, G.C.; Nazarian, S.; Segal, J.B.; Wu, A.W. Trends and Variation in Oral Anticoagulant Choice in Patients with Atrial Fibrillation, 2010–2017. Pharmacotherapy 2018, 38, 907–920. [Google Scholar] [CrossRef]
- Sur, N.B.; Wang, K.; Di Tullio, M.R.; Gutierrez, C.M.; Dong, C.; Koch, S.; Gardener, H.; García-Rivera, E.J.; Zevallos, J.C.; Burgin, W.S.; et al. Disparities and Temporal Trends in the Use of Anticoagulation in Patients with Ischemic Stroke and Atrial Fibrillation. Stroke 2019, 50, 1452–1459. [Google Scholar] [CrossRef]

| Warfarin Cohort (Reference) | Apixaban Cohort | Dabigatran Cohort | Rivaroxaban Cohort | ||||||||
|---|---|---|---|---|---|---|---|---|---|---|---|
| N/Mean | %/SD | N/Mean | %/SD | STD | N/Mean | %/SD | STD | N/Mean | %/SD | STD | |
| Sample Size | 278,372 | 486,257 | 46,920 | 267,991 | |||||||
| Age | 78.15 | 7.59 | 78.24 | 7.67 | 1.19 | 76.67 | 7.24 | 19.97 | 76.99 | 7.34 | 15.50 |
| 65–74 | 100,171 | 35.98% | 175,275 | 36.05% | 0.13 | 20,410 | 43.50% | 15.40 | 112,551 | 42.00% | 12.35 |
| 75–84 | 115,344 | 41.44% | 199,405 | 41.01% | 0.87 | 18,772 | 40.01% | 2.90 | 108,354 | 40.43% | 2.04 |
| ≥85 | 62,857 | 22.58% | 111,577 | 22.95% | 0.87 | 7738 | 16.49% | 15.40 | 47,086 | 17.57% | 12.53 |
| Gender | |||||||||||
| Male | 137,785 | 49.50% | 229,549 | 47.21% | 4.58 | 24,206 | 51.59% | 4.19 | 135,442 | 50.54% | 2.09 |
| Female | 140,587 | 50.50% | 256,708 | 52.79% | 4.58 | 22,714 | 48.41% | 4.19 | 132,549 | 49.46% | 2.09 |
| Race | |||||||||||
| White | 247,642 | 88.96% | 433,127 | 89.07% | 0.36 | 41,750 | 88.98% | 0.07 | 238,861 | 89.13% | 0.54 |
| Black | 16,288 | 5.85% | 23,905 | 4.92% | 4.14 | 2049 | 4.37% | 6.74 | 11,971 | 4.47% | 6.26 |
| Asian | 4094 | 1.47% | 8541 | 1.76% | 2.27 | 1020 | 2.17% | 5.26 | 5206 | 1.94% | 3.64 |
| Other | 10,348 | 3.72% | 20,684 | 4.25% | 2.74 | 2101 | 4.48% | 3.84 | 11,953 | 4.46% | 3.75 |
| U.S. Geographic Region | |||||||||||
| Northeast | 52,501 | 18.86% | 90,839 | 18.68% | 0.46 | 9729 | 20.74% | 4.707422 | 50,053 | 18.68% | 0.47 |
| Midwest | 90,695 | 32.58% | 111,181 | 22.86% | 21.83 | 10,597 | 22.59% | 22.50522 | 63,039 | 23.52% | 20.26 |
| South | 84,983 | 30.53% | 199,408 | 41.01% | 22.00 | 17,913 | 38.18% | 16.15975 | 101,971 | 38.05% | 15.90 |
| West | 49,498 | 17.78% | 83,439 | 17.16% | 1.64 | 8551 | 18.22% | 1.15405 | 52,191 | 19.47% | 4.35 |
| Other | 695 | 0.25% | 1390 | 0.29% | 0.70 | 130 | 0.28% | 0.534644 | 737 | 0.28% | 0.50 |
| Index Year | |||||||||||
| 2013 | 70,654 | 25.38% | 7975 | 1.64% | 74.06 | 13,330 | 28.41% | 6.83 | 34,205 | 12.76% | 32.54 |
| 2014 | 57,600 | 20.69% | 32,375 | 6.66% | 41.72 | 8778 | 18.71% | 4.99 | 44,960 | 16.78% | 10.05 |
| 2015 | 46,697 | 16.78% | 56,938 | 11.71% | 14.53 | 5715 | 12.18% | 13.09 | 37,579 | 14.02% | 7.63 |
| 2016 | 38,021 | 13.66% | 78,297 | 16.10% | 6.87 | 8109 | 17.28% | 10.03 | 36,575 | 13.65% | 0.03 |
| 2017 | 29,502 | 10.60% | 79,514 | 16.35% | 16.91 | 6269 | 13.36% | 8.52 | 44,270 | 16.52% | 17.36 |
| 2018 | 20,903 | 7.51% | 111,526 | 22.94% | 43.97 | 3223 | 6.87% | 2.48 | 38,304 | 14.29% | 21.90 |
| 2019 | 14,995 | 5.39% | 119,632 | 24.60% | 55.88 | 1496 | 3.19% | 10.87 | 32,098 | 11.98% | 23.57 |
| Medicaid Dual Eligibility | 43,345 | 15.57% | 67,727 | 13.93% | 4.63 | 6501 | 13.86% | 4.84 | 38,733 | 14.45% | 3.13 |
| Part-D LIS | 58,494 | 21.01% | 93,537 | 19.24% | 4.43 | 9074 | 19.34% | 4.17 | 52,340 | 19.53% | 3.69 |
| SES Variable | |||||||||||
| Low | 119,236 | 42.83% | 192,289 | 39.54% | 6.69 | 18,726 | 39.91% | 5.94 | 105,076 | 39.21% | 7.37 |
| Medium | 115,662 | 41.55% | 194,913 | 40.08% | 2.98 | 18,746 | 39.95% | 3.25 | 106,738 | 39.83% | 3.50 |
| High | 43,474 | 15.62% | 99,055 | 20.37% | 12.40 | 9448 | 20.14% | 11.82 | 56,177 | 20.96% | 13.86 |
| Baseline Comorbidity | |||||||||||
| CCI | 5.65 | 2.36 | 5.58 | 2.39 | 3.02 | 5.09 | 2.21 | 24.55 | 5.18 | 2.26 | 20.27 |
| CHA2DS2-VASc Score | 4.67 | 1.73 | 4.51 | 1.69 | 9.57 | 4.27 | 1.69 | 23.79 | 4.25 | 1.68 | 24.58 |
| 1 | 5077 | 1.82% | 9020 | 1.85% | 0.23 | 1321 | 2.82% | 6.59 | 7219 | 2.69% | 5.86 |
| 2 | 22,232 | 7.99% | 45,988 | 9.46% | 5.22 | 5525 | 11.78% | 12.72 | 32,266 | 12.04% | 13.53 |
| 3 | 47,152 | 16.94% | 89,607 | 18.43% | 3.90 | 9924 | 21.15% | 10.74 | 56,244 | 20.99% | 10.34 |
| 4+ | 203,911 | 73.25% | 341,642 | 70.26% | 6.65 | 30,150 | 64.26% | 19.49 | 172,262 | 64.28% | 19.45 |
| HAS-BLED Score | 2.68 | 1.22 | 2.67 | 1.18 | 0.76 | 2.46 | 1.09 | 18.66 | 2.49 | 1.11 | 15.81 |
| 0 | 8252 | 2.96% | 13,404 | 2.76% | 1.25 | 1327 | 2.83% | 0.81 | 8136 | 3.04% | 0.42 |
| 1 | 33,793 | 12.14% | 52,770 | 10.85% | 4.04 | 5935 | 12.65% | 1.55 | 33,192 | 12.39% | 0.75 |
| 2 | 90,995 | 32.69% | 167,862 | 34.52% | 3.88 | 19,362 | 41.27% | 17.84 | 105,860 | 39.50% | 14.22 |
| 3+ | 145,332 | 52.21% | 252,221 | 51.87% | 0.68 | 20,296 | 43.26% | 17.99 | 120,803 | 45.08% | 14.30 |
| Bleeding history | 53,070 | 19.06% | 83,550 | 17.18% | 4.89 | 7348 | 15.66% | 8.99 | 42,634 | 15.91% | 8.31 |
| Obesity | 56,148 | 20.17% | 124,138 | 25.53% | 12.79 | 9508 | 20.26% | 0.23 | 61,321 | 22.88% | 6.60 |
| CHF | 94,706 | 34.02% | 133,603 | 27.48% | 14.22 | 11,750 | 25.04% | 19.78 | 64,648 | 24.12% | 21.93 |
| DM | 108,007 | 38.80% | 168,146 | 34.58% | 8.76 | 16,366 | 34.88% | 8.13 | 90,102 | 33.62% | 10.79 |
| Hypertension | 234,996 | 84.42% | 413,638 | 85.07% | 1.80 | 39,553 | 84.30% | 0.33 | 224,978 | 83.95% | 1.28 |
| COPD | 84,227 | 30.26% | 141,165 | 29.03% | 2.68 | 12,764 | 27.20% | 6.75 | 74,065 | 27.64% | 5.78 |
| Renal disease | 79,369 | 28.51% | 128,568 | 26.44% | 4.64 | 8034 | 17.12% | 27.39 | 51,341 | 19.16% | 22.09 |
| MI | 39,359 | 14.14% | 56,438 | 11.61% | 7.57 | 4352 | 9.28% | 15.17 | 26,012 | 9.71% | 13.71 |
| Dyspepsia | 55,542 | 19.95% | 90,915 | 18.70% | 3.18 | 8326 | 17.75% | 5.65 | 49,096 | 18.32% | 4.15 |
| Non-stroke/SE PVD | 74,764 | 26.86% | 128,098 | 26.34% | 1.16 | 10,403 | 22.17% | 10.91 | 62,895 | 23.47% | 7.81 |
| History of stroke/SE | 43,187 | 15.51% | 62,593 | 12.87% | 7.58 | 5779 | 12.32% | 9.25 | 28,595 | 10.67% | 14.40 |
| TIA | 26,671 | 9.58% | 54,832 | 11.28% | 5.55 | 4237 | 9.03% | 1.90 | 23,015 | 8.59% | 3.46 |
| PAD | 72,575 | 26.07% | 116,772 | 24.01% | 4.75 | 9914 | 21.13% | 11.66 | 58,789 | 21.94% | 9.69 |
| CAD | 125,840 | 45.21% | 202,793 | 41.70% | 7.07 | 19,264 | 41.06% | 8.38 | 106,088 | 39.59% | 11.39 |
| Baseline Medication Use | |||||||||||
| ACE/ARB | 127,797 | 45.91% | 209,620 | 43.11% | 5.64 | 22,060 | 47.02% | 2.22 | 118,794 | 44.33% | 3.18 |
| Amiodarone | 15,339 | 5.51% | 30,664 | 6.31% | 3.38 | 3437 | 7.33% | 7.41 | 16,636 | 6.21% | 2.97 |
| Beta-blockers | 168,481 | 60.52% | 299,315 | 61.55% | 2.11 | 29,395 | 62.65% | 4.37 | 161,766 | 60.36% | 0.33 |
| H2-RA | 19,696 | 7.08% | 36,700 | 7.55% | 1.81 | 3096 | 6.60% | 1.89 | 18,342 | 6.84% | 0.91 |
| Proton pump inhibitor | 81,777 | 29.38% | 147,418 | 30.32% | 2.05 | 13,470 | 28.71% | 1.47 | 78,255 | 29.20% | 0.39 |
| Statins | 154,028 | 55.33% | 284,809 | 58.57% | 6.55 | 26,654 | 56.81% | 2.97 | 152,140 | 56.77% | 2.90 |
| Anti-platelets | 40,204 | 14.44% | 74,088 | 15.24% | 2.23 | 6429 | 13.70% | 2.13 | 37,481 | 13.99% | 1.31 |
| NSAIDS | 51,427 | 18.47% | 107,219 | 22.05% | 8.90 | 10,260 | 21.87% | 8.46 | 61,267 | 22.86% | 10.85 |
| Dose | |||||||||||
| Standard | 316,472 | 65.08% | 37,763 | 80.48% | 177,983 | 66.41% | |||||
| Low | 112,522 | 23.14% | 8566 | 18.26% | 75,684 | 28.24% | |||||
| Unknown | 57,263 | 11.78% | 591 | 1.26% | 14,324 | 5.34% | |||||
| Warfarin (Reference) | Apixaban Cohort | Dabigatran Cohort | Rivaroxaban Cohort | ||||||||
|---|---|---|---|---|---|---|---|---|---|---|---|
| N/Mean | %/SD | N/Mean | %/SD | STD | N/Mean | %/SD | STD | N/Mean | %/SD | STD | |
| Sample Size | 278,372 | 486,257 | 46,920 | 267,991 | |||||||
| Age | 77.68 | 7.64 | 77.71 | 7.55 | 0.33 | 77.97 | 7.59 | 3.77 | 77.84 | 7.51 | 2.12 |
| 65–74 | 108,514 | 38.98% | 188,089 | 38.68% | 0.62 | 17,183 | 36.62% | 4.87 | 99,677 | 37.19% | 3.68 |
| 75–84 | 111,375 | 40.01% | 197,111 | 40.54% | 1.07 | 19,561 | 41.69% | 3.42 | 112,528 | 41.99% | 4.03 |
| ≥85 | 58,482 | 21.01% | 101,058 | 20.78% | 0.56 | 10,176 | 21.69% | 1.66 | 55,786 | 20.82% | 0.47 |
| Gender | |||||||||||
| Male | 143,021 | 51.38% | 232,223 | 47.76% | 7.25 | 23,566 | 50.23% | 2.31 | 130,681 | 48.76% | 5.23 |
| Female | 135,351 | 48.62% | 254,034 | 52.24% | 7.25 | 23,354 | 49.77% | 2.31 | 137,310 | 51.24% | 5.23 |
| Race | |||||||||||
| White | 248,435 | 89.25% | 435,383 | 89.54% | 0.95 | 41,320 | 88.07% | 3.72 | 238,211 | 88.89% | 1.15 |
| Black | 15,842 | 5.69% | 22,392 | 4.61% | 4.92 | 2290 | 4.88% | 3.62 | 12,718 | 4.75% | 4.25 |
| Asian | 3581 | 1.29% | 8690 | 1.79% | 4.07 | 1123 | 2.39% | 8.24 | 5287 | 1.97% | 5.42 |
| Other | 10,514 | 3.78% | 19,791 | 4.07% | 1.51 | 2187 | 4.66% | 4.40 | 11,775 | 4.39% | 3.12 |
| U.S. Geographic Region | |||||||||||
| Northeast | 50,905 | 18.29% | 90,796 | 18.67% | 0.99 | 8607 | 18.34% | 0.15 | 50,193 | 18.73% | 1.14 |
| Midwest | 73,096 | 26.26% | 123,996 | 25.50% | 1.73 | 11,069 | 23.59% | 6.17 | 68,022 | 25.38% | 2.00 |
| South | 104,805 | 37.65% | 182,463 | 37.52% | 0.26 | 18,455 | 39.33% | 3.46 | 100,497 | 37.50% | 0.31 |
| West | 48,825 | 17.54% | 87,721 | 18.04% | 1.31 | 8677 | 18.49% | 2.48 | 48,535 | 18.11% | 1.49 |
| Other | 741 | 0.27% | 1280 | 0.26% | 0.05 | 112 | 0.24% | 0.56 | 744 | 0.28% | 0.22 |
| Index Year | |||||||||||
| 2013 | 32,673 | 11.74% | 57,221 | 11.77% | 0.09 | 5489 | 11.70% | 0.12 | 31,572 | 11.78% | 0.14 |
| 2014 | 37,141 | 13.34% | 64,931 | 13.35% | 0.03 | 6194 | 13.20% | 0.42 | 35,803 | 13.36% | 0.05 |
| 2015 | 38,018 | 13.66% | 66,214 | 13.62% | 0.12 | 6315 | 13.46% | 0.58 | 36,554 | 13.64% | 0.05 |
| 2016 | 41,625 | 14.95% | 72,508 | 14.91% | 0.12 | 6977 | 14.87% | 0.24 | 39,814 | 14.86% | 0.27 |
| 2017 | 41,045 | 14.74% | 71,721 | 14.75% | 0.01 | 6951 | 14.81% | 0.20 | 39,651 | 14.80% | 0.14 |
| 2018 | 44,508 | 15.99% | 78,120 | 16.07% | 0.21 | 7620 | 16.24% | 0.69 | 42,990 | 16.04% | 0.14 |
| 2019 | 43,361 | 15.58% | 75,542 | 15.54% | 0.11 | 7374 | 15.72% | 0.39 | 41,606 | 15.53% | 0.14 |
| Medicaid Dual Eligibility | 36,641 | 13.16% | 67,633 | 13.91% | 2.18 | 6734 | 14.35% | 3.45 | 41,277 | 15.40% | 6.40 |
| Part-D LIS | 50,393 | 18.10% | 93,744 | 19.28% | 3.02 | 9255 | 19.72% | 4.14 | 55,148 | 20.58% | 6.27 |
| SES Variable | |||||||||||
| Low | 111,791 | 40.16% | 193,877 | 39.87% | 0.59 | 18,555 | 39.55% | 1.25 | 108,330 | 40.42% | 0.54 |
| Medium | 113,950 | 40.93% | 197,743 | 40.67% | 0.55 | 18,762 | 39.99% | 1.93 | 108,149 | 40.36% | 1.18 |
| High | 52,632 | 18.91% | 94,637 | 19.46% | 1.41 | 9603 | 20.47% | 3.92 | 51,512 | 19.22% | 0.80 |
| Baseline Comorbidity | |||||||||||
| CCI | 5.50 | 2.38 | 5.44 | 2.34 | 2.71 | 5.49 | 2.35 | 0.70 | 5.45 | 2.34 | 2.40 |
| CHA2DS2-VASc Score | 4.47 | 1.70 | 4.45 | 1.70 | 1.12 | 4.50 | 1.72 | 2.02 | 4.47 | 1.71 | 0.25 |
| 1 | 6216 | 2.2% | 10,153 | 2.1% | 1.00 | 1022 | 2.2% | 0.37 | 5577 | 2.1% | 1.05 |
| 2 | 26,655 | 9.58% | 49,172 | 10.11% | 1.80 | 4501 | 9.59% | 0.06 | 26,708 | 9.97% | 1.32 |
| 3 | 52,967 | 19.03% | 92,960 | 19.12% | 0.23 | 8699 | 18.54% | 1.25 | 50,438 | 18.82% | 0.53 |
| 4+ | 192,534 | 69.16% | 333,972 | 68.68% | 1.04 | 32,699 | 69.69% | 1.14 | 185,269 | 69.13% | 0.07 |
| HAS-BLED Score | 2.62 | 1.22 | 2.61 | 1.15 | 0.33 | 2.64 | 1.17 | 1.61 | 2.61 | 1.15 | 0.32 |
| 0 | 9269 | 3.33% | 12,641 | 2.60% | 4.30 | 1233 | 2.63% | 4.13 | 7199 | 2.69% | 3.77 |
| 1 | 36,178 | 13.00% | 53,352 | 10.97% | 6.24 | 5412 | 11.53% | 4.46 | 29,519 | 11.02% | 6.10 |
| 2 | 93,053 | 33.43% | 179,794 | 36.98% | 7.43 | 16,526 | 35.22% | 3.78 | 97,512 | 36.39% | 6.21 |
| 3+ | 139,873 | 50.25% | 240,470 | 49.45% | 1.59 | 23,750 | 50.62% | 0.74 | 133,761 | 49.91% | 0.67 |
| Bleeding history | 53,652 | 19.27% | 80,978 | 16.65% | 6.83 | 8041 | 17.14% | 5.54 | 44,932 | 16.77% | 6.53 |
| Obesity | 63,903 | 22.96% | 113,417 | 23.32% | 0.87 | 11,089 | 23.63% | 1.60 | 64,071 | 23.91% | 2.25 |
| CHF | 83,527 | 30.01% | 133,073 | 27.37% | 5.84 | 12,821 | 27.33% | 5.93 | 71,950 | 26.85% | 7.00 |
| DM | 100,268 | 36.02% | 167,980 | 34.55% | 3.08 | 16,970 | 36.17% | 0.31 | 96,236 | 35.91% | 0.23 |
| Hypertension | 231,266 | 83.08% | 414,315 | 85.20% | 5.83 | 39,946 | 85.14% | 5.63 | 229,382 | 85.59% | 6.92 |
| COPD | 79,417 | 28.53% | 139,573 | 28.70% | 0.39 | 13,115 | 27.95% | 1.28 | 77,132 | 28.78% | 0.56 |
| Renal disease | 69,100 | 24.82% | 120,015 | 24.68% | 0.33 | 11,739 | 25.02% | 0.45 | 66,530 | 24.83% | 0.01 |
| MI | 36,548 | 13.13% | 55,333 | 11.38% | 5.34 | 4914 | 10.47% | 8.24 | 28,819 | 10.75% | 7.33 |
| Dyspepsia | 51,529 | 18.51% | 92,371 | 19.00% | 1.24 | 8512 | 18.14% | 0.96 | 50,904 | 18.99% | 1.24 |
| Non-stroke/SE PVD | 71,111 | 25.55% | 122,597 | 25.21% | 0.77 | 12,069 | 25.72% | 0.41 | 69,832 | 26.06% | 1.17 |
| History of stroke/SE | 38,715 | 13.91% | 60,192 | 12.38% | 4.53 | 6774 | 14.44% | 1.52 | 32,170 | 12.00% | 5.67 |
| TIA | 27,690 | 9.95% | 49,647 | 10.21% | 0.87 | 5286 | 11.27% | 4.28 | 26,033 | 9.71% | 0.78 |
| PAD | 66,614 | 23.93% | 114,102 | 23.47% | 1.09 | 11,277 | 24.04% | 0.25 | 65,438 | 24.42% | 1.14 |
| CAD | 118,333 | 42.51% | 207,561 | 42.69% | 0.36 | 19,877 | 42.36% | 0.29 | 110,902 | 41.38% | 2.28 |
| Baseline Medication Use | |||||||||||
| ACE/ARB | 118,785 | 42.67% | 219,108 | 45.06% | 4.82 | 21,402 | 45.61% | 5.93 | 120,243 | 44.87% | 4.43 |
| Amiodarone | 14,525 | 5.22% | 34,010 | 6.99% | 7.42 | 3291 | 7.01% | 7.50 | 17,000 | 6.34% | 4.83 |
| Beta-blockers | 164,706 | 59.17% | 308,115 | 63.36% | 8.62 | 29,144 | 62.11% | 6.03 | 163,400 | 60.97% | 3.69 |
| H2-RA | 19,307 | 6.94% | 35,529 | 7.31% | 1.44 | 3409 | 7.26% | 1.28 | 19,425 | 7.25% | 1.22 |
| Proton pump inhibitor | 79,017 | 28.39% | 148,681 | 30.58% | 4.81 | 13,646 | 29.08% | 1.54 | 80,300 | 29.96% | 3.47 |
| Statins | 153,553 | 55.16% | 285,758 | 58.77% | 7.29 | 27,222 | 58.02% | 5.77 | 154,454 | 57.63% | 4.99 |
| Anti-platelets | 37,884 | 13.61% | 76,188 | 15.67% | 5.83 | 6844 | 14.59% | 2.81 | 40,191 | 15.00% | 3.97 |
| NSAIDS | 52,311 | 18.79% | 106,896 | 21.98% | 7.93 | 10,157 | 21.65% | 7.11 | 60,853 | 22.71% | 9.67 |
| Dose | |||||||||||
| Standard | 336,915 | 69.29% | 34,654 | 73.86% | 167,082 | 62.35% | |||||
| Low | 113,081 | 23.26% | 9434 | 20.11% | 82,557 | 30.81% | |||||
| Unknown | 36,261 | 7.46% | 2832 | 6.04% | 18,352 | 6.85% | |||||
| Warfarin (Ref) vs. Apixaban | Apixaban vs. Dabigatran (Ref) | Apixaban vs. Rivaroxaban (Ref) | Warfarin (Ref) vs. Dabigatran | Warfarin (Ref) vs. Rivaroxaban | Rivaroxaban (Ref) vs. Dabigatran | |||||||
|---|---|---|---|---|---|---|---|---|---|---|---|---|
| Overall | ||||||||||||
| Stroke/SE | 0.69 (0.65,0.74) | <0.0001 | 0.88 (0.80,0.95) | 0.0029 | 0.88 (0.84,0.92) | <0.0001 | 0.82 (0.69,0.98) | 0.0254 | 0.77 (0.71,0.84) | <0.0001 | 1.01 (0.92,1.10) | 0.8586 |
| Ischemic stroke | 0.75 (0.69,0.81) | <0.0001 | 0.82 (0.75,0.90) | <0.0001 | 0.93 (0.88,0.97) | 0.0012 | 0.94 (0.78,1.13) | 0.5025 | 0.78 (0.71,0.86) | <0.0001 | 1.14 (1.03,1.26) | 0.0102 |
| Hemorrhagic stroke | 0.57 (0.49,0.67) | <0.0001 | 1.41 (1.09,1.85) | 0.0104 | 0.76 (0.69,0.83) | <0.0001 | 0.53 (0.32,0.86) | 0.0105 | 0.81 (0.67,0.98) | 0.0302 | 0.53 (0.41,0.70) | <0.0001 |
| SE | 0.40 (0.29,0.55) | <0.0001 | 0.65 (0.43,0.98) | 0.0407 | 0.65 (0.52,0.79) | <0.0001 | 0.27 (0.08,0.90) | 0.0334 | 0.48 (0.32,0.73) | 0.0005 | 0.98 (0.64,1.49) | 0.9203 |
| 65–74 | ||||||||||||
| Stroke/SE | 0.73 (0.67,0.78) | <0.0001 | 0.92 (0.78,1.08) | 0.3017 | 0.87 (0.80,0.94) | 0.0004 | 0.79 (0.67,0.94) | 0.0067 | 0.83 (0.77,0.91) | <0.0001 | 0.96 (0.81,1.13) | 0.6096 |
| Ischemic stroke | 0.79 (0.72,0.87) | <0.0001 | 0.83 (0.69,0.98) | 0.033 | 0.90 (0.82,0.98) | 0.0216 | 0.97 (0.81,1.16) | 0.7129 | 0.88 (0.79,0.97) | 0.0103 | 1.10 (0.92,1.32) | 0.2911 |
| Hemorrhagic stroke | 0.57 (0.48,0.67) | <0.0001 | 1.68 (1.02,2.78) | 0.0419 | 0.82 (0.69,0.98) | 0.0312 | 0.33 (0.20,0.55) | <0.0001 | 0.68 (0.57,0.82) | <0.0001 | 0.50 (0.30,0.82) | 0.0068 |
| SE | 0.57 (0.39,0.84) | 0.0042 | 0.97 (0.41,2.26) | 0.9393 | 0.60 (0.41,0.87) | 0.0065 | 0.60 (0.26,1.40) | 0.2368 | 0.96 (0.66,1.41) | 0.8440 | 0.62 (0.27,1.46) | 0.2752 |
| 75–84 | ||||||||||||
| Stroke/SE | 0.67 (0.64,0.72) | <0.0001 | 0.92 (0.81,1.06) | 0.2607 | 0.88 (0.83,0.94) | 0.0001 | 0.73 (0.64,0.84) | <0.0001 | 0.76 (0.72,0.82) | <0.0001 | 0.96 (0.83,1.11) | 0.5840 |
| Ischemic stroke | 0.75 (0.70,0.80) | <0.0001 | 0.89 (0.76,1.03) | 0.1255 | 0.93 (0.87,1.00) | 0.0649 | 0.85 (0.73,1.00) | 0.0442 | 0.80 (0.74,0.87) | <0.0001 | 1.06 (0.91,1.24) | 0.4435 |
| Hemorrhagic stroke | 0.49 (0.43,0.55) | <0.0001 | 1.57 (1.03,2.39) | 0.0356 | 0.77 (0.67,0.89) | 0.0003 | 0.31 (0.20,0.47) | <0.0001 | 0.64 (0.55,0.74) | <0.0001 | 0.48 (0.31,0.74) | 0.0008 |
| SE | 0.50 (0.37,0.68) | <0.0001 | 0.41 (0.24,0.70) | 0.0011 | 0.61 (0.44,0.83) | 0.0017 | 1.22 (0.71,2.07) | 0.4705 | 0.84 (0.62,1.15) | 0.2782 | 1.43 (0.83,2.45) | 0.1999 |
| 85+ | ||||||||||||
| Stroke/SE | 0.69 (0.66,0.72) | <0.0001 | 0.84 (0.71,1.00) | 0.0517 | 0.90 (0.83,0.97) | 0.0074 | 0.82 (0.74,0.90) | <0.0001 | 0.79 (0.75,0.83) | <0.0001 | 1.07 (0.89,1.28) | 0.4666 |
| Ischemic stroke | 0.76 (0.73,0.80) | <0.0001 | 0.79 (0.66,0.96) | 0.0154 | 0.95 (0.87,1.04) | 0.2756 | 0.97 (0.87,1.08) | 0.5527 | 0.81 (0.77,0.86) | <0.0001 | 1.21 (0.99,1.47) | 0.0611 |
| Hemorrhagic stroke | 0.52 (0.48,0.57) | <0.0001 | 1.09 (0.67,1.78) | 0.7364 | 0.71 (0.59,0.85) | 0.0002 | 0.36 (0.27,0.48) | <0.0001 | 0.71 (0.64,0.79) | <0.0001 | 0.65 (0.39,1.07) | 0.0872 |
| SE | 0.49 (0.40,0.60) | <0.0001 | 1.43 (0.43,4.78) | 0.5597 | 0.81 (0.53,1.24) | 0.3352 | 0.74 (0.48,1.15) | 0.1830 | 0.80 (0.65,1.00) | 0.0471 | 0.57 (0.17,1.94) | 0.3653 |
| Male | ||||||||||||
| Stroke/SE | 0.74 (0.69,0.78) | <0.0001 | 0.80 (0.70,0.90) | 0.0003 | 0.91 (0.85,0.97) | 0.0030 | 0.93 (0.82,1.06) | 0.2752 | 0.81 (0.76,0.87) | <0.0001 | 1.15 (1.02,1.31) | 0.0284 |
| Ischemic stroke | 0.82 (0.77,0.88) | <0.0001 | 0.70 (0.62,0.80) | <0.0001 | 0.96 (0.89,1.04) | 0.3257 | 1.18 (1.03,1.36) | 0.0165 | 0.86 (0.79,0.93) | 0.0001 | 1.39 (1.21,1.59) | <0.0001 |
| Hemorrhagic stroke | 0.52 (0.46,0.58) | <0.0001 | 1.92 (1.24,2.97) | 0.0034 | 0.73 (0.63,0.83) | <0.0001 | 0.27 (0.17,0.41) | <0.0001 | 0.71 (0.62,0.81) | <0.0001 | 0.38 (0.25,0.59) | <0.0001 |
| SE | 0.69 (0.51,0.94) | 0.0201 | 0.66 (0.36,1.21) | 0.1830 | 0.99 (0.70,1.40) | 0.9537 | 1.03 (0.56,1.90) | 0.9138 | 0.70 (0.48,1.00) | 0.0484 | 1.50 (0.80,2.80) | 0.2100 |
| Female | ||||||||||||
| Stroke/SE | 0.73 (0.67,0.78) | <0.0001 | 0.98 (0.86,1.11) | 0.7383 | 0.88 (0.83,0.93) | <0.0001 | 0.79 (0.67,0.94) | 0.0067 | 0.83 (0.77,0.91) | <0.0001 | 0.90 (0.79,1.02) | 0.0991 |
| Ischemic stroke | 0.79 (0.72,0.87) | <0.0001 | 0.97 (0.84,1.11) | 0.6499 | 0.92 (0.87,0.98) | 0.0121 | 0.97 (0.81,1.16) | 0.7129 | 0.88 (0.79,0.97) | 0.0103 | 0.96 (0.83,1.11) | 0.5818 |
| Hemorrhagic stroke | 0.57 (0.48,0.67) | <0.0001 | 1.14 (0.82,1.59) | 0.4398 | 0.80 (0.70,0.91) | 0.0006 | 0.33 (0.20,0.55) | <0.0001 | 0.68 (0.57,0.82) | <0.0001 | 0.69 (0.49,0.97) | 0.0302 |
| SE | 0.57 (0.39,0.84) | 0.0042 | 0.68 (0.38,1.22) | 0.1997 | 0.51 (0.39,0.66) | <0.0001 | 0.60 (0.26,1.40) | 0.2368 | 0.96 (0.66,1.41) | 0.8440 | 0.74 (0.41,1.32) | 0.3039 |
| White | ||||||||||||
| Stroke/SE | 0.69 (0.66,0.72) | <0.0001 | 0.85 (0.77,0.93) | 0.0007 | 0.88 (0.84,0.92) | <0.0001 | 0.82 (0.74,0.90) | <0.0001 | 0.79 (0.75,0.83) | <0.0001 | 1.04 (0.95,1.15) | 0.4239 |
| Ischemic stroke | 0.76 (0.73,0.80) | <0.0001 | 0.79 (0.71,0.88) | <0.0001 | 0.94 (0.89,0.99) | 0.0186 | 0.97 (0.87,1.08) | 0.5527 | 0.81 (0.77,0.86) | <0.0001 | 1.20 (1.08,1.33) | 0.0007 |
| Hemorrhagic stroke | 0.52 (0.48,0.57) | <0.0001 | 1.42 (1.07,1.89) | 0.0157 | 0.73 (0.66,0.81) | <0.0001 | 0.36 (0.27,0.48) | <0.0001 | 0.71 (0.64,0.79) | <0.0001 | 0.51 (0.38,0.68) | <0.0001 |
| SE | 0.49 (0.40,0.60) | <0.0001 | 0.65 (0.42,1.02) | 0.0614 | 0.61 (0.49,0.75) | <0.0001 | 0.74 (0.48,1.15) | 0.1830 | 0.80 (0.65,1.00) | 0.0471 | 0.92 (0.59,1.44) | 0.7071 |
| Black | ||||||||||||
| Stroke/SE | 0.72 (0.63,0.83) | <0.0001 | 1.41 (0.93,2.14) | 0.1050 | 0.90 (0.77,1.07) | 0.2314 | 0.52 (0.34,0.79) | 0.0022 | 0.81 (0.68,0.95) | 0.0109 | 0.65 (0.42,1.00) | 0.0475 |
| Ischemic stroke | 0.78 (0.67,0.91) | 0.0013 | 1.68 (1.03,2.74) | 0.0390 | 0.93 (0.77,1.11) | 0.3925 | 0.47 (0.29,0.77) | 0.0028 | 0.85 (0.71,1.02) | 0.0782 | 0.56 (0.34,0.92) | 0.0232 |
| Hemorrhagic stroke | 0.52 (0.36,0.75) | 0.0006 | 0.62 (0.26,1.44) | 0.2639 | 0.71 (0.45,1.11) | 0.1286 | 0.84 (0.36,1.95) | 0.6884 | 0.73 (0.47,1.12) | 0.1476 | 1.16 (0.49,2.79) | 0.7346 |
| SE | 0.54 (0.27,1.06) | 0.0737 | 2.11 (0.14,31.25) | 0.5861 | 1.45 (0.52,4.00) | 0.4766 | 0.26 (0.02,3.70) | 0.3162 | 0.38 (0.14,1.02) | 0.0541 | 0.67 (0.04,10.84) | 0.7794 |
| Asian | ||||||||||||
| Stroke/SE | 0.58 (0.44,0.76) | <0.0001 | 0.94 (0.55,1.60) | 0.8126 | 0.72 (0.56,0.93) | 0.0104 | 0.61 (0.35,1.05) | 0.0751 | 0.81 (0.61,1.08) | 0.1484 | 0.77 (0.45,1.32) | 0.3436 |
| Ischemic stroke | 0.85 (0.61,1.20) | 0.3655 | 0.78 (0.45,1.35) | 0.3704 | 0.68 (0.52,0.90) | 0.0071 | 1.08 (0.60,1.95) | 0.8052 | 1.26 (0.89,1.79) | 0.1984 | 0.88 (0.51,1.54) | 0.6558 |
| Hemorrhagic stroke | 0.30 (0.18,0.50) | <0.0001 | 4.48 (0.36,55.56) | 0.2449 | 0.99 (0.53,1.86) | 0.9817 | 0.07 (0.01,0.82) | 0.0347 | 0.31 (0.17,0.56) | 0.0001 | 0.22 (0.02,2.82) | 0.2446 |
| SE | 0.05 (0.01,0.45) | 0.007 | N/A | N/A | 0.27 (0.02,3.17) | 0.2989 | N/A | N/A | 0.17 (0.04,0.83) | 0.0281 | N/A | N/A |
| Other | ||||||||||||
| Stroke/SE | 0.84 (0.69,1.02) | 0.0732 | 0.95 (0.64,1.41) | 0.8002 | 0.97 (0.81,1.18) | 0.7842 | 0.89 (0.59,1.33) | 0.5596 | 0.85 (0.69,1.06) | 0.1588 | 1.03 (0.69,1.55) | 0.8737 |
| Ischemic stroke | 0.81 (0.65,1.02) | 0.0772 | 0.93 (0.59,1.47) | 0.7564 | 0.88 (0.71,1.09) | 0.2328 | 0.89 (0.55,1.42) | 0.6208 | 0.91 (0.71,1.17) | 0.4694 | 0.97 (0.61,1.55) | 0.8993 |
| Hemorrhagic stroke | 0.89 (0.59,1.35) | 0.5815 | 1.37 (0.51,3.66) | 0.5336 | 1.34 (0.87,2.07) | 0.1867 | 0.64 (0.23,1.77) | 0.3871 | 0.68 (0.41,1.12) | 0.1318 | 0.94 (0.34,2.63) | 0.9079 |
| SE | 0.95 (0.38,2.38) | 0.9179 | 0.47 (0.13,1.70) | 0.2523 | 1.39 (0.54,3.60) | 0.5013 | 2.06 (0.51,8.34) | 0.3121 | 0.72 (0.24,2.17) | 0.5579 | 2.77 (0.67,11.54) | 0.1610 |
| Low SES | ||||||||||||
| Stroke/SE | 0.73 (0.69,0.77) | <0.0001 | 1.00 (0.87,1.15) | 0.9833 | 0.88 (0.83,0.94) | 0.0001 | 0.73 (0.63,0.84) | <0.0001 | 0.82 (0.77,0.88) | <0.0001 | 0.89 (0.77,1.02) | 0.0994 |
| Ischemic stroke | 0.81 (0.76,0.87) | <0.0001 | 0.96 (0.83,1.12) | 0.6254 | 0.93 (0.86,1.00) | 0.0445 | 0.85 (0.73,0.99) | 0.0397 | 0.88 (0.81,0.95) | 0.0009 | 0.97 (0.83,1.14) | 0.7408 |
| Hemorrhagic stroke | 0.52 (0.46,0.60) | <0.0001 | 1.39 (0.93,2.07) | 0.1060 | 0.82 (0.71,0.96) | 0.0116 | 0.37 (0.25,0.55) | <0.0001 | 0.63 (0.55,0.74) | <0.0001 | 0.59 (0.39,0.89) | 0.0109 |
| SE | 0.44 (0.33,0.60) | <0.0001 | 0.68 (0.35,1.33) | 0.2571 | 0.46 (0.34,0.62) | <0.0001 | 0.67 (0.34,1.29) | 0.2263 | 0.98 (0.74,1.31) | 0.8995 | 0.67 (0.34,1.30) | 0.2326 |
| Medium SES | ||||||||||||
| Stroke/SE | 0.67 (0.63,0.71) | <0.0001 | 0.85 (0.73,0.98) | 0.0231 | 0.85 (0.79,0.91) | <0.0001 | 0.80 (0.69,0.92) | 0.0023 | 0.79 (0.74,0.85) | <0.0001 | 1.01 (0.87,1.17) | 0.9407 |
| Ischemic stroke | 0.72 (0.67,0.78) | <0.0001 | 0.79 (0.68,0.93) | 0.0044 | 0.89 (0.82,0.96) | 0.0037 | 0.92 (0.78,1.08) | 0.2798 | 0.81 (0.74,0.88) | <0.0001 | 1.13 (0.96,1.33) | 0.1351 |
| Hemorrhagic stroke | 0.55 (0.48,0.63) | <0.0001 | 1.49 (0.96,2.34) | 0.0788 | 0.72 (0.62,0.83) | <0.0001 | 0.36 (0.23,0.57) | <0.0001 | 0.77 (0.66,0.89) | 0.0007 | 0.47 (0.30,0.74) | 0.0010 |
| SE | 0.49 (0.36,0.66) | <0.0001 | 0.49 (0.27,0.88) | 0.0181 | 0.74 (0.52,1.05) | 0.0952 | 0.98 (0.54,1.78) | 0.9547 | 0.66 (0.46,0.92) | 0.0158 | 1.51 (0.81,2.79) | 0.1930 |
| High SES | ||||||||||||
| Stroke/SE | 0.68 (0.62,0.74) | <0.0001 | 0.73 (0.61,0.87) | 0.0006 | 0.95 (0.86,1.04) | 0.2802 | 0.92 (0.77,1.12) | 0.4069 | 0.71 (0.64,0.79) | <0.0001 | 1.32 (1.09,1.59) | 0.0043 |
| Ischemic stroke | 0.74 (0.67,0.83) | <0.0001 | 0.65 (0.53,0.78) | <0.0001 | 1.00 (0.90,1.12) | 0.9288 | 1.15 (0.93,1.41) | 0.1894 | 0.74 (0.65,0.84) | <0.0001 | 1.57 (1.28,1.92) | <0.0001 |
| Hemorrhagic stroke | 0.50 (0.41,0.61) | <0.0001 | 1.37 (0.78,2.44) | 0.2704 | 0.75 (0.61,0.91) | 0.0039 | 0.36 (0.21,0.65) | 0.0005 | 0.67 (0.54,0.83) | 0.0003 | 0.55 (0.31,0.97) | 0.0401 |
| SE | 0.60 (0.38,0.93) | 0.0239 | 1.11 (0.38,3.23) | 0.8489 | 1.25 (0.75,2.08) | 0.3810 | 0.53 (0.18,1.57) | 0.2491 | 0.47 (0.27,0.81) | 0.0073 | 1.17 (0.38,3.40) | 0.7881 |
| Dual | ||||||||||||
| Stroke/SE | 0.80 (0.73,0.87) | <0.0001 | 1.00 (0.82,1.22) | 0.9611 | 1.00 (0.91,1.10) | 0.9662 | 0.80 (0.65,0.98) | 0.0329 | 0.79 (0.72,0.88) | <0.0001 | 1.01 (0.81,1.24) | 0.9648 |
| Ischemic stroke | 0.92 (0.83,1.02) | 0.1031 | 1.06 (0.76,1.32) | 0.6333 | 1.03 (0.92,1.15) | 0.5900 | 0.97 (0.77,1.22) | 0.7989 | 0.88 (0.78,1.00) | 0.0454 | 1.10 (0.87,1.39) | 0.4120 |
| Hemorrhagic stroke | 0.55 (0.45,0.67) | <0.0001 | 0.59 (0.87,1.15) | 0.1206 | 1.05 (0.83,1.34) | 0.6820 | 0.32 (0.17,0.62) | 0.0007 | 0.52 (0.40,0.66) | <0.0001 | 0.63 (0.32,1.23) | 0.1715 |
| SE | 0.42 (0.28,0.64) | <0.0001 | 1.44 (0.26,3.78) | 0.4549 | 0.52 (0.33,0.81) | 0.0040 | 0.62 (0.24,1.60) | 0.3209 | 0.83 (0.55,1.27) | 0.3929 | 0.73 (0.28,1.91) | 0.5210 |
| Non Dual | ||||||||||||
| Stroke/SE | 0.68 (0.65,0.71) | <0.0001 | 0.87 (0.79,0.96) | 0.0047 | 0.85 (0.81,0.89) | <0.0001 | 0.79 (0.71,0.87) | <0.0001 | 0.81 (0.77,0.85) | <0.0001 | 0.98 (0.89,1.09) | 0.7089 |
| Ischemic stroke | 0.75 (0.71,0.78) | <0.0001 | 0.81 (0.73,0.90) | 0.0001 | 0.90 (0.85,0.95) | <0.0001 | 0.92 (0.83,1.03) | 0.1488 | 0.83 (0.79,0.88) | <0.0001 | 1.11 (1.00,1.24) | 0.0558 |
| Hemorrhagic stroke | 0.52 (0.47,0.57) | <0.0001 | 1.40 (1.04,1.87) | 0.0247 | 0.71 (0.64,0.79) | <0.0001 | 0.37 (0.28,0.49) | <0.0001 | 0.73 (0.66,0.81) | <0.0001 | 0.50 (0.38,0.68) | <0.0001 |
| SE | 0.52 (0.42,0.65) | <0.0001 | 0.66 (0.41,1.04) | 0.0703 | 0.68 (0.54,0.86) | 0.0010 | 0.79 (0.50,1.25) | 0.3135 | 0.77 (0.61,0.97) | 0.0257 | 1.03 (0.65,1.65) | 0.8889 |
| Apixaban vs. Warfarin (Ref) | Apixaban vs. Dabigatran (Ref) | Apixaban vs. Rivaroxaban (Ref) | Dabigatran vs. Warfarin (Ref) | Rivaroxaban vs. Warfarin (Ref) | Dabigatran vs. Rivaroxaban (Ref) | |||||||
|---|---|---|---|---|---|---|---|---|---|---|---|---|
| Overall | ||||||||||||
| MB | 0.59 (0.57,0.60) | <0.0001 | 0.76 (0.72,0.80) | <0.0001 | 0.60 (0.58,0.61) | <0.0001 | 0.77 (0.73,0.81) | <0.0001 | 0.99 (0.96,1.01) | 0.3181 | 0.78 (0.73,0.82) | <0.0001 |
| GI bleeding | 0.61 (0.59,0.63) | <0.0001 | 0.63 (0.59,0.67) | <0.0001 | 0.52 (0.51,0.54) | <0.0001 | 0.96 (0.90,1.03) | 0.2373 | 1.16 (1.12,1.19) | <0.0001 | 0.83 (0.78,0.88) | <0.0001 |
| Intracranial hemorrhage | 0.53 (0.51,0.56) | <0.0001 | 1.19 (1.03,1.39) | 0.0187 | 0.86 (0.81,0.92) | <0.0001 | 0.44 (0.38,0.52) | <0.0001 | 0.62 (0.58,0.66) | <0.0001 | 0.72 (0.62,0.84) | <0.0001 |
| Other bleeding | 0.59 (0.56,0.63) | <0.0001 | 1.23 (1.02,1.47) | 0.0264 | 0.68 (0.63,0.72) | <0.0001 | 0.48 (0.40,0.57) | <0.0001 | 0.88 (0.82,0.94) | 0.0003 | 0.55 (0.46,0.66) | <0.0001 |
| 65–74 | ||||||||||||
| MB | 0.57 (0.54,0.60) | <0.0001 | 1.03 (0.92,1.15) | 0.6346 | 0.63 (0.60,0.66) | <0.0001 | 0.55 (0.49,0.62) | <0.0001 | 0.90 (0.86,0.95) | <0.0001 | 0.61 (0.55,0.69) | <0.0001 |
| GI bleeding | 0.58 (0.55,0.62) | <0.0001 | 0.84 (0.74,0.96) | 0.0095 | 0.57 (0.54,0.60) | <0.0001 | 0.69 (0.60,0.78) | <0.0001 | 1.02 (0.96,1.09) | 0.4597 | 0.67 (0.59,0.76) | <0.0001 |
| Intracranial hemorrhage | 0.53 (0.47,0.59) | <0.0001 | 1.50 (1.09,2.07) | 0.0122 | 0.90 (0.79,1.01) | 0.0731 | 0.35 (0.25,0.48) | <0.0001 | 0.59 (0.52,0.67) | <0.0001 | 0.60 (0.43,0.83) | 0.0018 |
| Other bleeding | 0.58 (0.52,0.66) | <0.0001 | 2.11 (1.42,3.12) | 0.0002 | 0.70 (0.62,0.79) | <0.0001 | 0.28 (0.19,0.41) | <0.0001 | 0.83 (0.73,0.93) | 0.0025 | 0.34 (0.23,0.50) | <0.0001 |
| 75–84 | ||||||||||||
| MB | 0.58 (0.56,0.60) | <0.0001 | 0.77 (0.71,0.84) | <0.0001 | 0.61 (0.58,0.63) | <0.0001 | 0.75 (0.69,0.82) | <0.0001 | 0.96 (0.93,1.00) | 0.0582 | 0.78 (0.71,0.85) | <0.0001 |
| GI bleeding | 0.61 (0.58,0.64) | <0.0001 | 0.65 (0.59,0.71) | <0.0001 | 0.53 (0.51,0.56) | <0.0001 | 0.94 (0.85,1.03) | 0.1868 | 1.14 (1.09,1.20) | <0.0001 | 0.82 (0.74,0.90) | <0.0001 |
| Intracranial hemorrhage | 0.51 (0.47,0.55) | <0.0001 | 1.19 (0.95,1.49) | 0.1383 | 0.90 (0.82,0.99) | 0.0227 | 0.43 (0.34,0.54) | <0.0001 | 0.57 (0.52,0.62) | <0.0001 | 0.75 (0.60,0.95) | 0.0161 |
| Other bleeding | 0.59 (0.54,0.65) | <0.0001 | 1.17 (0.89,1.54) | 0.2624 | 0.68 (0.62,0.76) | <0.0001 | 0.50 (0.38,0.66) | <0.0001 | 0.87 (0.78,0.97) | 0.0100 | 0.58 (0.44,0.76) | <0.0001 |
| 85+ | ||||||||||||
| MB | 0.63 (0.60,0.66) | <0.0001 | 0.63 (0.56,0.70) | <0.0001 | 0.56 (0.53,0.59) | <0.0001 | 1.01 (0.90,1.12) | 0.8864 | 1.13 (1.08,1.19) | <0.0001 | 0.89 (0.79,0.99) | 0.0302 |
| GI bleeding | 0.64 (0.61,0.68) | <0.0001 | 0.50 (0.44,0.57) | <0.0001 | 0.48 (0.45,0.51) | <0.0001 | 1.28 (1.13,1.45) | 0.0001 | 1.34 (1.26,1.43) | <0.0001 | 0.95 (0.84,1.08) | 0.4499 |
| Intracranial hemorrhage | 0.60 (0.54,0.65) | <0.0001 | 1.10 (0.83,1.46) | 0.4934 | 0.81 (0.73,0.91) | 0.0002 | 0.54 (0.41,0.72) | <0.0001 | 0.74 (0.66,0.82) | <0.0001 | 0.73 (0.55,0.98) | 0.0357 |
| Other bleeding | 0.65 (0.57,0.74) | <0.0001 | 0.92 (0.65,1.31) | 0.6544 | 0.65 (0.57,0.75) | <0.0001 | 0.69 (0.49,0.99) | 0.0427 | 0.99 (0.86,1.15) | 0.9019 | 0.70 (0.49,1.01) | 0.0537 |
| Male | ||||||||||||
| MB | 0.58 (0.56,0.60) | <0.0001 | 0.82 (0.76,0.89) | <0.0001 | 0.61 (0.59,0.63) | <0.0001 | 0.70 (0.65,0.76) | <0.0001 | 0.95 (0.92,0.99) | 0.013 | 0.74 (0.68,0.80) | <0.0001 |
| GI bleeding | 0.59 (0.56,0.62) | <0.0001 | 0.67 (0.60,0.73) | <0.0001 | 0.53 (0.50,0.55) | <0.0001 | 0.88 (0.80,0.97) | 0.0103 | 1.12 (1.07,1.17) | <0.0001 | 0.79 (0.71,0.87) | <0.0001 |
| Intracranial hemorrhage | 0.54 (0.51,0.59) | <0.0001 | 1.57 (1.25,2.00) | 0.0002 | 0.92 (0.84,1.00) | 0.0536 | 0.35 (0.27,0.44) | <0.0001 | 0.59 (0.54,0.65) | <0.0001 | 0.58 (0.46,0.74) | <0.0001 |
| Other bleeding | 0.60 (0.55,0.65) | <0.0001 | 1.03 (0.82,1.29) | 0.8230 | 0.67 (0.61,0.74) | <0.0001 | 0.58 (0.46,0.72) | <0.0001 | 0.88 (0.80,0.97) | 0.0123 | 0.65 (0.52,0.82) | 0.0002 |
| Female | ||||||||||||
| MB | 0.60 (0.58,0.62) | <0.0001 | 0.72 (0.66,0.77) | <0.0001 | 0.59 (0.57,0.61) | <0.0001 | 0.84 (0.77,0.90) | <0.0001 | 1.03 (0.99,1.07) | 0.1536 | 0.81 (0.75,0.87) | <0.0001 |
| GI bleeding | 0.62 (0.60,0.65) | <0.0001 | 0.60 (0.55,0.65) | <0.0001 | 0.52 (0.50,0.55) | <0.0001 | 1.04 (0.95,1.13) | 0.4362 | 1.19 (1.14,1.25) | <0.0001 | 0.86 (0.79,0.94) | 0.0011 |
| Intracranial hemorrhage | 0.54 (0.50,0.58) | <0.0001 | 0.98 (0.81,1.19) | 0.8422 | 0.83 (0.76,0.90) | <0.0001 | 0.54 (0.45,0.66) | <0.0001 | 0.65 (0.60,0.71) | <0.0001 | 0.83 (0.68,1.02) | 0.0758 |
| Other bleeding | 0.61 (0.56,0.67) | <0.0001 | 1.65 (1.21,2.25) | 0.0016 | 0.69 (0.62,0.76) | <0.0001 | 0.37 (0.27,0.50) | <0.0001 | 0.89 (0.80,0.99) | 0.0313 | 0.41 (0.30,0.57) | <0.0001 |
| White | ||||||||||||
| MB | 0.60 (0.58,0.62) | <0.0001 | 0.74 (0.70,0.79) | <0.0001 | 0.59 (0.58,0.61) | <0.0001 | 0.80 (0.75,0.85) | <0.0001 | 1.02 (0.99,1.04) | 0.2856 | 0.79 (0.74,0.83) | <0.0001 |
| GI bleeding | 0.62 (0.60,0.65) | <0.0001 | 0.61 (0.57,0.66) | <0.0001 | 0.52 (0.51,0.54) | <0.0001 | 1.01 (0.95,1.09) | 0.7226 | 1.20 (1.16,1.24) | <0.0001 | 0.84 (0.79,0.90) | <0.0001 |
| Intracranial hemorrhage | 0.54 (0.51,0.57) | <0.0001 | 1.20 (1.02,1.41) | 0.0250 | 0.85 (0.80,0.90) | <0.0001 | 0.45 (0.38,0.52) | <0.0001 | 0.63 (0.59,0.68) | <0.0001 | 0.70 (0.60,0.83) | <0.0001 |
| Other bleeding | 0.60 (0.56,0.64) | <0.0001 | 1.20 (0.99,1.45) | 0.0599 | 0.67 (0.63,0.72) | <0.0001 | 0.49 (0.41,0.60) | <0.0001 | 0.89 (0.83,0.96) | 0.0031 | 0.56 (0.46,0.67) | <0.0001 |
| Black | ||||||||||||
| MB | 0.59 (0.54,0.65) | <0.0001 | 0.88 (0.69,1.13) | 0.3120 | 0.56 (0.50,0.62) | <0.0001 | 0.67 (0.53,0.86) | 0.0016 | 1.06 (0.96,1.18) | 0.2534 | 0.63 (0.49,0.81) | 0.0003 |
| GI bleeding | 0.61 (0.55,0.69) | <0.0001 | 0.79 (0.60,1.05) | 0.1017 | 0.52 (0.46,0.58) | <0.0001 | 0.77 (0.58,1.02) | 0.0633 | 1.18 (1.05,1.33) | 0.0055 | 0.65 (0.49,0.86) | 0.0024 |
| Intracranial hemorrhage | 0.50 (0.39,0.64) | <0.0001 | 0.78 (0.41,1.45) | 0.4279 | 0.83 (0.60,1.13) | 0.2316 | 0.66 (0.35,1.22) | 0.1843 | 0.61 (0.45,0.82) | 0.0013 | 1.08 (0.56,2.07) | 0.8219 |
| Other bleeding | 0.60 (0.46,0.78) | 0.0001 | 3.11 (0.91,10.53) | 0.0696 | 0.61 (0.46,0.82) | 0.0009 | 0.19 (0.06,0.65) | 0.0081 | 0.98 (0.73,1.30) | 0.8592 | 0.20 (0.06,0.67) | 0.0094 |
| Asian | ||||||||||||
| MB | 0.46 (0.38,0.56) | <0.0001 | 0.73 (0.50,1.07) | 0.1112 | 0.77 (0.63,0.94) | 0.0107 | 0.64 (0.43,0.94) | 0.0221 | 0.61 (0.49,0.75) | <0.0001 | 1.03 (0.70,1.52) | 0.8690 |
| GI bleeding | 0.37 (0.28,0.49) | <0.0001 | 0.50 (0.31,0.81) | 0.0048 | 0.54 (0.41,0.72) | <0.0001 | 0.75 (0.47,1.21) | 0.2419 | 0.68 (0.52,0.90) | 0.0065 | 1.08 (0.67,1.74) | 0.7517 |
| Intracranial hemorrhage | 0.55 (0.40,0.76) | 0.0003 | 1.33 (0.63,2.82) | 0.4594 | 1.36 (0.94,1.96) | 0.1016 | 0.42 (0.20,0.91) | 0.0282 | 0.41 (0.27,0.61) | <0.0001 | 1.01 (0.46,2.22) | 0.9854 |
| Other bleeding | 0.67 (0.34,1.32) | 0.2525 | 0.85 (0.25,2.89) | 0.7924 | 0.72 (0.40,1.32) | 0.2944 | 0.81 (0.22,2.89) | 0.7396 | 0.98 (0.49,1.99) | 0.9593 | 0.83 (0.24,2.88) | 0.7696 |
| Other | ||||||||||||
| MB | 0.56 (0.49,0.64) | <0.0001 | 1.09 (0.79,1.51) | 0.5892 | 0.77 (0.67,0.88) | 0.0001 | 0.51 (0.37,0.71) | <0.0001 | 0.74 (0.64,0.85) | <0.0001 | 0.70 (0.50,0.97) | 0.0298 |
| GI bleeding | 0.50 (0.42,0.59) | <0.0001 | 0.88 (0.60,1.28) | 0.5001 | 0.63 (0.54,0.75) | <0.0001 | 0.57 (0.39,0.83) | 0.0036 | 0.79 (0.66,0.94) | 0.0073 | 0.72 (0.49,1.05) | 0.0890 |
| Intracranial hemorrhage | 0.64 (0.49,0.83) | 0.0007 | 1.77 (0.81,3.86) | 0.1514 | 1.12 (0.84,1.49) | 0.4474 | 0.36 (0.16,0.78) | 0.0102 | 0.58 (0.43,0.79) | 0.0006 | 0.61 (0.28,1.36) | 0.2303 |
| Other bleeding | 0.85 (0.56,1.28) | 0.4236 | 1.58 (0.56,4.48) | 0.3922 | 1.06 (0.70,1.59) | 0.7817 | 0.54 (0.19,1.58) | 0.2598 | 0.79 (0.49,1.27) | 0.3273 | 0.69 (0.24,2.00) | 0.4908 |
| Low SES | ||||||||||||
| MB | 0.60 (0.57,0.62) | <0.0001 | 0.76 (0.70,0.83) | <0.0001 | 0.61 (0.59,0.63) | <0.0001 | 0.78 (0.72,0.85) | <0.0001 | 0.98 (0.94,1.02) | 0.3219 | 0.79 (0.73,0.87) | <0.0001 |
| GI bleeding | 0.62 (0.59,0.65) | <0.0001 | 0.65 (0.59,0.72) | <0.0001 | 0.54 (0.52,0.57) | <0.0001 | 0.94 (0.85,1.04) | 0.2065 | 1.14 (1.09,1.19) | <0.0001 | 0.82 (0.75,0.91) | <0.0001 |
| Intracranial hemorrhage | 0.53 (0.49,0.58) | <0.0001 | 1.07 (0.86,1.34) | 0.5523 | 0.90 (0.81,0.99) | 0.0321 | 0.50 (0.40,0.62) | <0.0001 | 0.59 (0.54,0.65) | <0.0001 | 0.84 (0.67,1.06) | 0.1366 |
| Other bleeding | 0.61 (0.55,0.67) | <0.0001 | 1.23 (0.93,1.63) | 0.1536 | 0.70 (0.63,0.78) | <0.0001 | 0.49 (0.37,0.64) | <0.0001 | 0.87 (0.78,0.97) | 0.0097 | 0.56 (0.42,0.75) | <0.0001 |
| Medium SES | ||||||||||||
| MB | 0.60 (0.58,0.63) | <0.0001 | 0.77 (0.70,0.84) | <0.0001 | 0.59 (0.56,0.61) | <0.0001 | 0.78 (0.71,0.85) | <0.0001 | 1.03 (0.99,1.07) | 0.1760 | 0.75 (0.68,0.82) | <0.0001 |
| GI bleeding | 0.60 (0.57,0.64) | <0.0001 | 0.62 (0.56,0.69) | <0.0001 | 0.51 (0.48,0.53) | <0.0001 | 0.97 (0.87,1.08) | 0.5205 | 1.19 (1.13,1.25) | <0.0001 | 0.81 (0.73,0.90) | <0.0001 |
| Intracranial hemorrhage | 0.56 (0.51,0.60) | <0.0001 | 1.34 (1.04,1.73) | 0.0227 | 0.86 (0.78,0.95) | 0.0019 | 0.41 (0.32,0.53) | <0.0001 | 0.65 (0.59,0.72) | <0.0001 | 0.63 (0.49,0.82) | 0.0005 |
| Other bleeding | 0.67 (0.61,0.75) | <0.0001 | 1.17 (0.88,1.55) | 0.2889 | 0.68 (0.61,0.75) | <0.0001 | 0.58 (0.43,0.77) | 0.0001 | 0.99 (0.89,1.11) | 0.8913 | 0.58 (0.44,0.78) | 0.0002 |
| High SES | ||||||||||||
| MB | 0.56 (0.52,0.59) | <0.0001 | 0.75 (0.66,0.85) | <0.0001 | 0.59 (0.55,0.62) | <0.0001 | 0.75 (0.65,0.85) | <0.0001 | 0.95 (0.89,1.02) | 0.1447 | 0.78 (0.69,0.89) | 0.0002 |
| GI bleeding | 0.62 (0.57,0.67) | <0.0001 | 0.59 (0.51,0.68) | <0.0001 | 0.52 (0.49,0.56) | <0.0001 | 1.05 (0.90,1.22) | 0.5539 | 1.18 (1.09,1.29) | <0.0001 | 0.88 (0.76,1.02) | 0.0929 |
| Intracranial hemorrhage | 0.50 (0.44,0.57) | <0.0001 | 1.21 (0.87,1.68) | 0.2473 | 0.81 (0.71,0.92) | 0.0009 | 0.41 (0.30,0.57) | <0.0001 | 0.62 (0.54,0.71) | <0.0001 | 0.67 (0.48,0.93) | 0.0180 |
| Other bleeding | 0.46 (0.39,0.53) | <0.0001 | 1.45 (0.91,2.29) | 0.1154 | 0.61 (0.52,0.71) | <0.0001 | 0.31 (0.20,0.50) | <0.0001 | 0.75 (0.64,0.88) | 0.0005 | 0.42 (0.26,0.66) | 0.0002 |
| Dual | ||||||||||||
| MB | 0.59 (0.56,0.63) | <0.0001 | 0.83 (0.72,0.95) | 0.0073 | 0.65 (0.61,0.69) | <0.0001 | 0.72 (0.62,0.82) | <0.0001 | 0.91 (0.86,0.97) | 0.0043 | 0.78 (0.68,0.90) | 0.0005 |
| GI bleeding | 0.57 (0.53,0.62) | <0.0001 | 0.68 (0.58,0.80) | <0.0001 | 0.56 (0.52,0.60) | <0.0001 | 0.84 (0.72,0.98) | 0.0295 | 1.03 (0.96,1.11) | 0.4469 | 0.82 (0.70,0.95) | 0.0102 |
| Intracranial hemorrhage | 0.59 (0.51,0.67) | <0.0001 | 1.19 (0.83,1.71) | 0.3396 | 1.07 (0.92,1.26) | 0.3823 | 0.49 (0.34,0.70) | 0.0001 | 0.55 (0.46,0.64) | <0.0001 | 0.89 (0.62,1.30) | 0.5579 |
| Other bleeding | 0.72 (0.61,0.84) | <0.0001 | 1.80 (1.08,3.00) | 0.0247 | 0.82 (0.69,0.97) | 0.0242 | 0.40 (0.24,0.66) | 0.0004 | 0.88 (0.74,1.06) | 0.1795 | 0.45 (0.27,0.76) | 0.0026 |
| Non Dual | ||||||||||||
| MB | 0.59 (0.57,0.60) | <0.0001 | 0.74 (0.69,0.79) | <0.0001 | 0.58 (0.57,0.60) | <0.0001 | 0.79 (0.74,0.84) | <0.0001 | 1.01 (0.99,1.04) | 0.3478 | 0.78 (0.73,0.83) | <0.0001 |
| GI bleeding | 0.61 (0.59,0.64) | <0.0001 | 0.61 (0.57,0.65) | <0.0001 | 0.51 (0.50,0.53) | <0.0001 | 1.00 (0.94,1.08) | 0.9104 | 1.20 (1.16,1.24) | <0.0001 | 0.84 (0.78,0.90) | <0.0001 |
| Intracranial hemorrhage | 0.53 (0.50,0.56) | <0.0001 | 1.22 (1.03,1.44) | 0.0195 | 0.83 (0.78,0.89) | <0.0001 | 0.43 (0.37,0.51) | <0.0001 | 0.64 (0.60,0.68) | <0.0001 | 0.68 (0.57,0.80) | <0.0001 |
| Other bleeding | 0.58 (0.54,0.62) | <0.0001 | 1.14 (0.94,1.38) | 0.1982 | 0.65 (0.60,0.70) | <0.0001 | 0.50 (0.41,0.61) | <0.0001 | 0.89 (0.83,0.97) | 0.0042 | 0.57 (0.46,0.69) | <0.0001 |
Disclaimer/Publisher’s Note: The statements, opinions and data contained in all publications are solely those of the individual author(s) and contributor(s) and not of MDPI and/or the editor(s). MDPI and/or the editor(s) disclaim responsibility for any injury to people or property resulting from any ideas, methods, instructions or products referred to in the content. |
© 2025 by the authors. Licensee MDPI, Basel, Switzerland. This article is an open access article distributed under the terms and conditions of the Creative Commons Attribution (CC BY) license (https://creativecommons.org/licenses/by/4.0/).
Share and Cite
Atreja, N.; Dubey, A.; Kohli, M.; Jiang, J.; Hagan, M.; Aweh, G.; Adams, S.; Cheng, D. Demographic and Socio-Economic Disparities in the Outcomes Among Patients with NVAF Treated with Oral Anticoagulants: A Real-World Evaluation of Medicare Beneficiaries. J. Clin. Med. 2025, 14, 3252. https://doi.org/10.3390/jcm14093252
Atreja N, Dubey A, Kohli M, Jiang J, Hagan M, Aweh G, Adams S, Cheng D. Demographic and Socio-Economic Disparities in the Outcomes Among Patients with NVAF Treated with Oral Anticoagulants: A Real-World Evaluation of Medicare Beneficiaries. Journal of Clinical Medicine. 2025; 14(9):3252. https://doi.org/10.3390/jcm14093252
Chicago/Turabian StyleAtreja, Nipun, Anandkumar Dubey, Monal Kohli, Jenny Jiang, Melissa Hagan, Gideon Aweh, Shayna Adams, and Dong Cheng. 2025. "Demographic and Socio-Economic Disparities in the Outcomes Among Patients with NVAF Treated with Oral Anticoagulants: A Real-World Evaluation of Medicare Beneficiaries" Journal of Clinical Medicine 14, no. 9: 3252. https://doi.org/10.3390/jcm14093252
APA StyleAtreja, N., Dubey, A., Kohli, M., Jiang, J., Hagan, M., Aweh, G., Adams, S., & Cheng, D. (2025). Demographic and Socio-Economic Disparities in the Outcomes Among Patients with NVAF Treated with Oral Anticoagulants: A Real-World Evaluation of Medicare Beneficiaries. Journal of Clinical Medicine, 14(9), 3252. https://doi.org/10.3390/jcm14093252