
The Role of Ultrasonography in Predicting Genetic Characteristics of Endometrial Cancers
 , , ,
, , ,
Abstract
1. Introduction
- POLE-ultramutated subtype: Characterized by a high frequency of mutations due to alterations in the POLE gene, which encodes a subunit of DNA polymerase.
- Microsatellite instability (MSI) hypermutated subtype: Defined by defects in DNA mismatch repair, leading to high mutational burden.
- Copy-number low subtype: Associated with a relatively stable genome and endometrioid histology.
- Copy-number high (serous-like) subtype: Marked by widespread genomic instability and frequent copy-number alterations.
2. Materials and Methods
2.1. Study Design and Sample Collection
2.2. Genetic Analysis
2.2.1. DNA Isolation from Peripheral Blood
2.2.2. DNA Quality and Quantification
2.2.3. Qubit Fluorometric Quantification
2.2.4. NGS Analysis
2.2.5. NGS Library Preparation and Sequencing
2.2.6. Bioinformatics Analysis of Sequencing Data
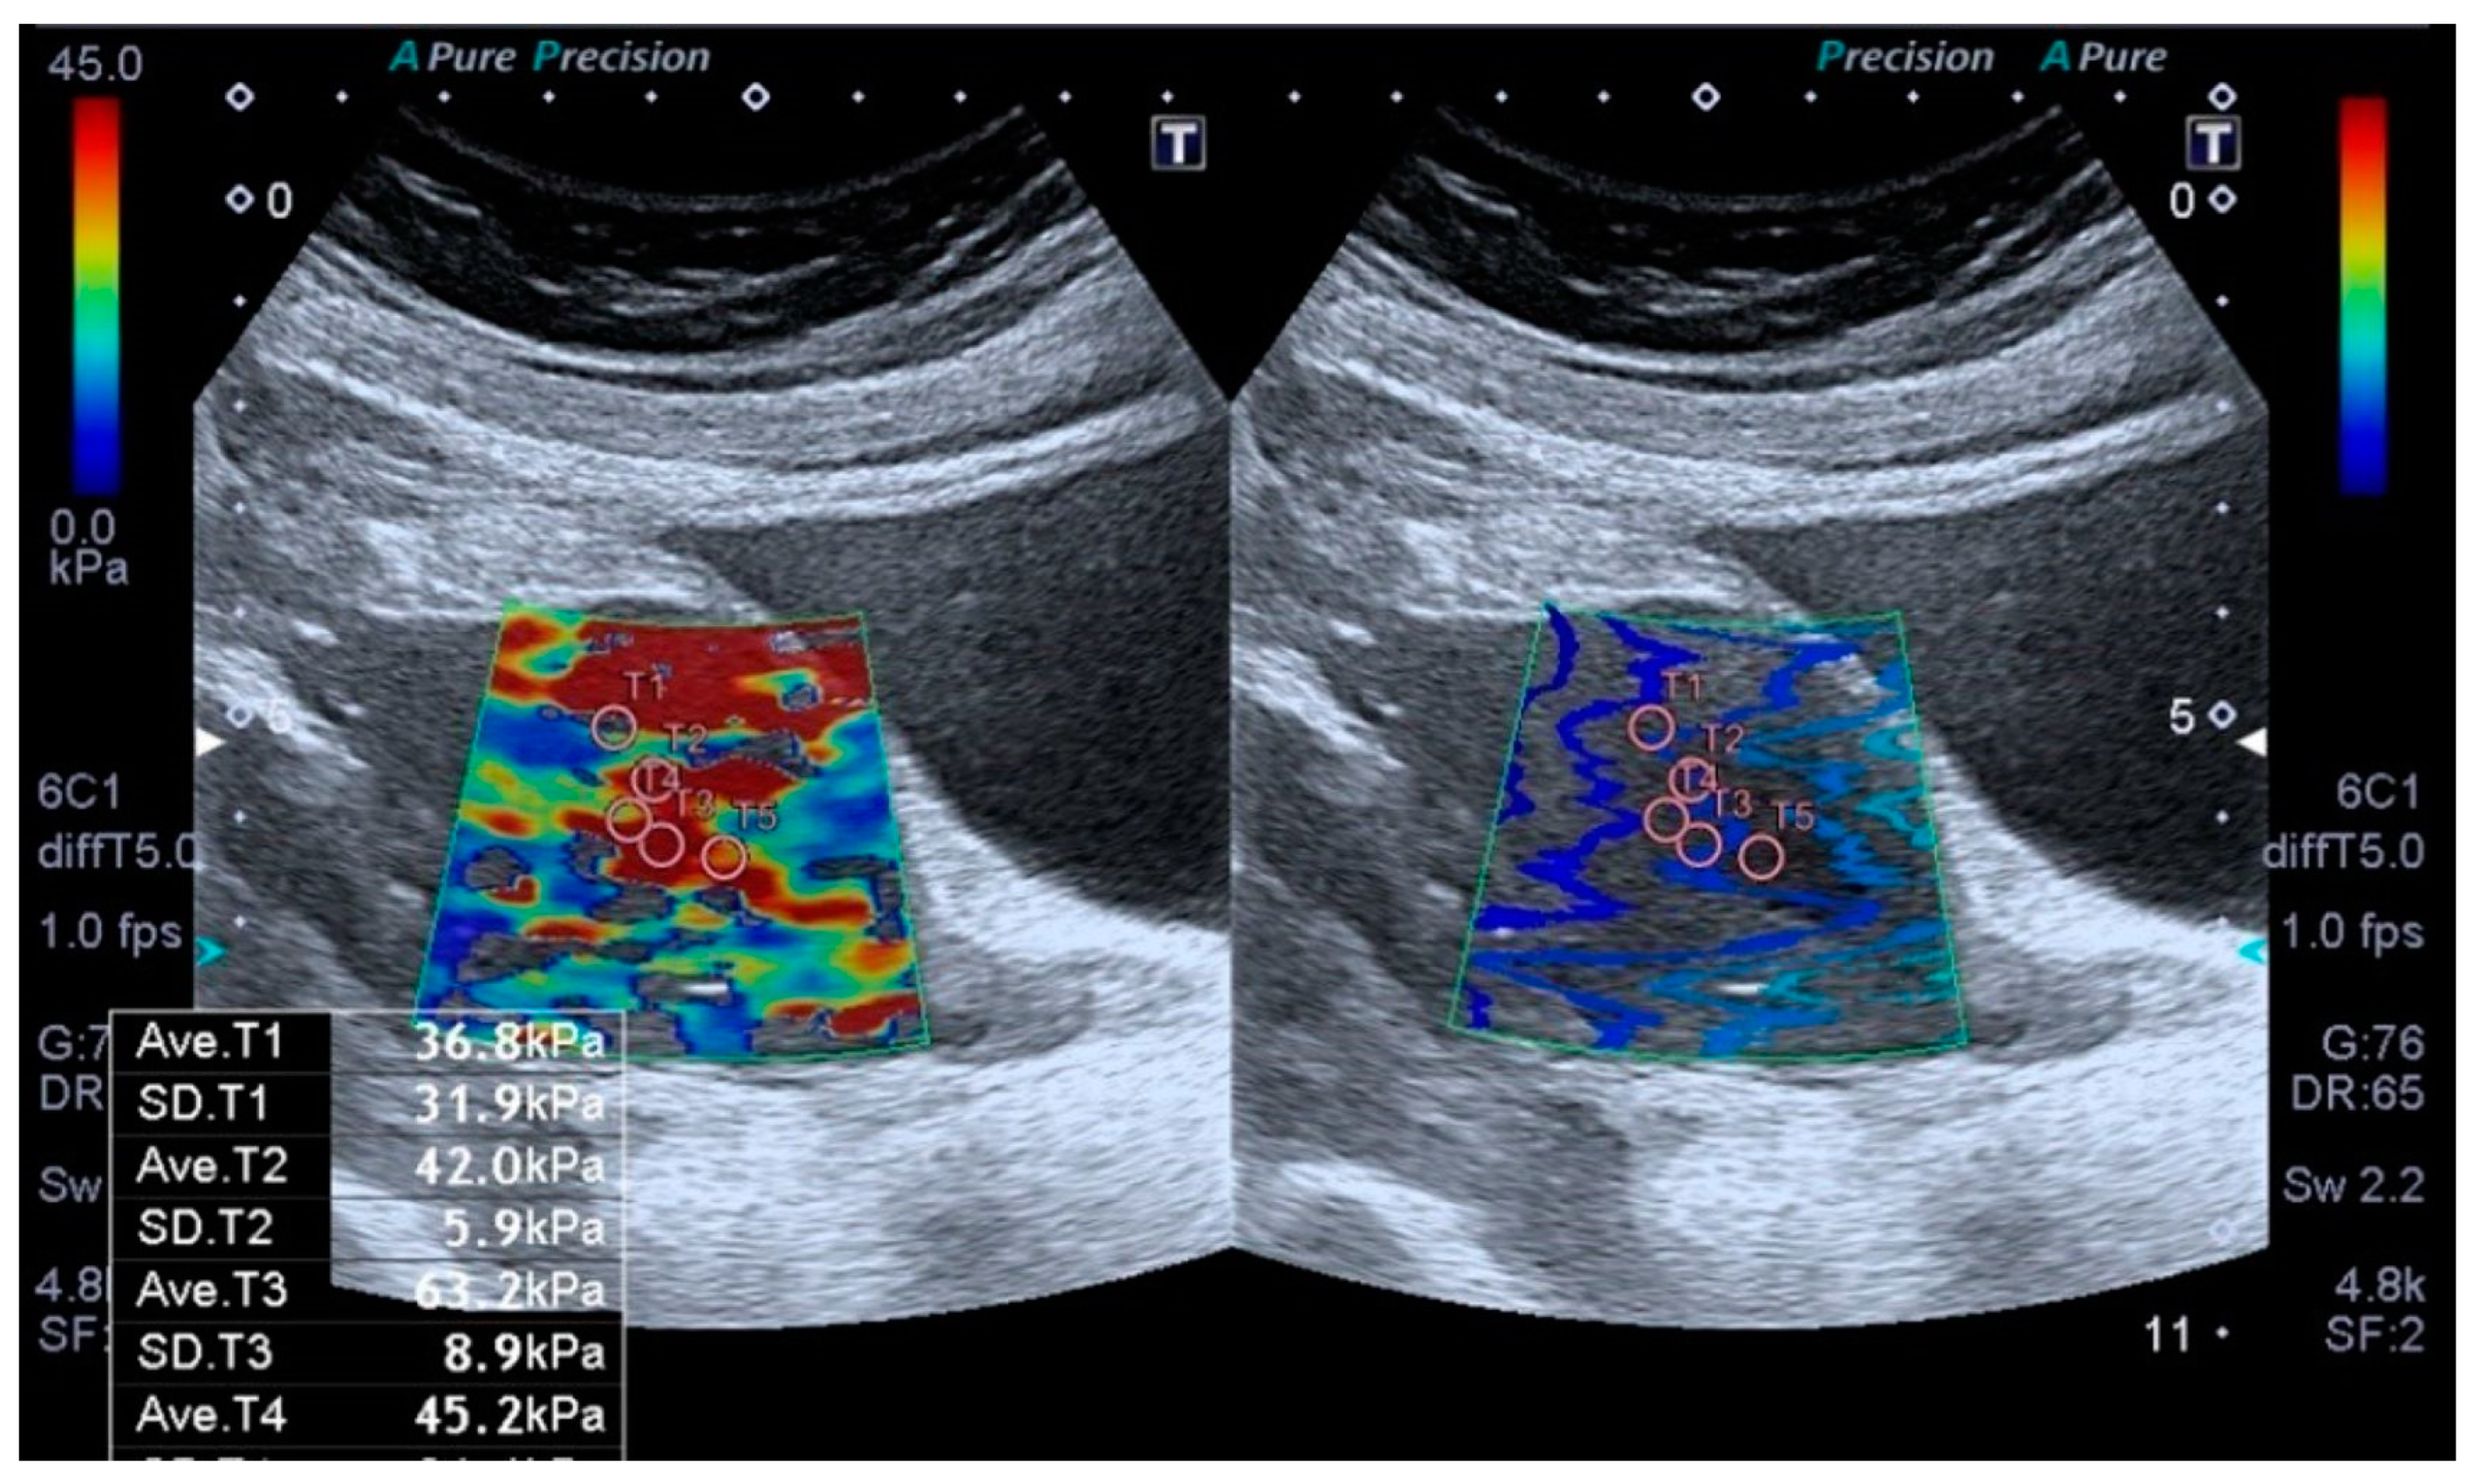
2.3. Elastography Analysis
2.4. Statistical Analysis
3. Results
4. Discussion
Author Contributions
Funding
Institutional Review Board Statement
Informed Consent Statement
Data Availability Statement
Conflicts of Interest
References
- Clinton, S.K.; Giovannucci, E.L.; Hursting, S.D. The World Cancer Research Fund/American Institute for Cancer Research Third Expert Report on Diet, Nutrition, Physical Activity, and Cancer: Impact and Future Directions. J. Nutr. 2020, 150, 663–671. [Google Scholar] [CrossRef] [PubMed]
- Colombo, N.; Creutzberg, C.; Amant, F.; Bosse, T.; González-Martín, A.; Ledermann, J.; Marth, C.; Nout, R.; Querleu, D.; Mirza, M.R.; et al. ESMO-ESGO-ESTRO Consensus Conference on Endometrial Cancer: Diagnosis, treatment and follow-up. Ann. Oncol. 2016, 27, 16–41. [Google Scholar] [CrossRef] [PubMed]
- Noci, I.; Pillozzi, S.; Lastraioli, E.; Dabizzi, S.; Giachi, M.; Borrani, E.; Wimalasena, J.; Taddei, G.L.; Scarselli, G.; Arcangeli, A. hLH/hCG-receptor expression correlates with in vitro invasiveness in human primary endometrial cancer. Gynecol. Oncol. 2008, 111, 496–501. [Google Scholar] [CrossRef]
- Malentacchi, F.; Turrini, I.; Sorbi, F.; Projetto, E.; Castiglione, F.; Fambrini, M.; Petraglia, F.; Pillozzi, S.; Noci, I. Pilot investigation of the mutation profile of PIK3CA/PTEN genes (PI3K pathway) in grade 3 endometrial cancer. Oncol. Rep. 2019, 41, 1560–1574. [Google Scholar] [CrossRef]
- Malentacchi, F.; Turrini, I.; Sorbi, F.; Projetto, E.; Castiglione, F.; Vergoni, F.; Amunni, G.; Fambrini, M.; Petraglia, F.; Noci, I.; et al. Identification of a Gene Panel for Endometrioid Endometrial Cancer: A Possible Prognostic Value? Reprod. Sci. 2020, 27, 592–598. [Google Scholar] [CrossRef] [PubMed]
- Krakstad, C.; Birkeland, E.; Seidel, D.; Kusonmano, K.; Petersen, K.; Mjøs, S.; Hoivik, E.A.; Wik, E.; Halle, M.K.; Øyan, A.M.; et al. High-throughput mutation profiling of primary and metastatic endometrial cancers identifies KRAS, FGFR2 and PIK3CA to be frequently mutated. PLoS ONE 2012, 7, e52795. [Google Scholar] [CrossRef]
- Murali, R.; Soslow, R.A.; Weigelt, B. Classification of endometrial carcinoma: More than two types. Lancet Oncol. 2014, 15, e268–e278. [Google Scholar] [CrossRef]
- Kurnit, K.C.; Kim, G.N.; Fellman, B.M.; Urbauer, D.L.; Mills, G.B.; Zhang, W.; Broaddus, R.R. CTNNB1 (beta-catenin) mutation identifies low grade, early stage endometrial cancer patients at increased risk of recurrence. Mod. Pathol. 2017, 30, 1032–1041. [Google Scholar] [CrossRef]
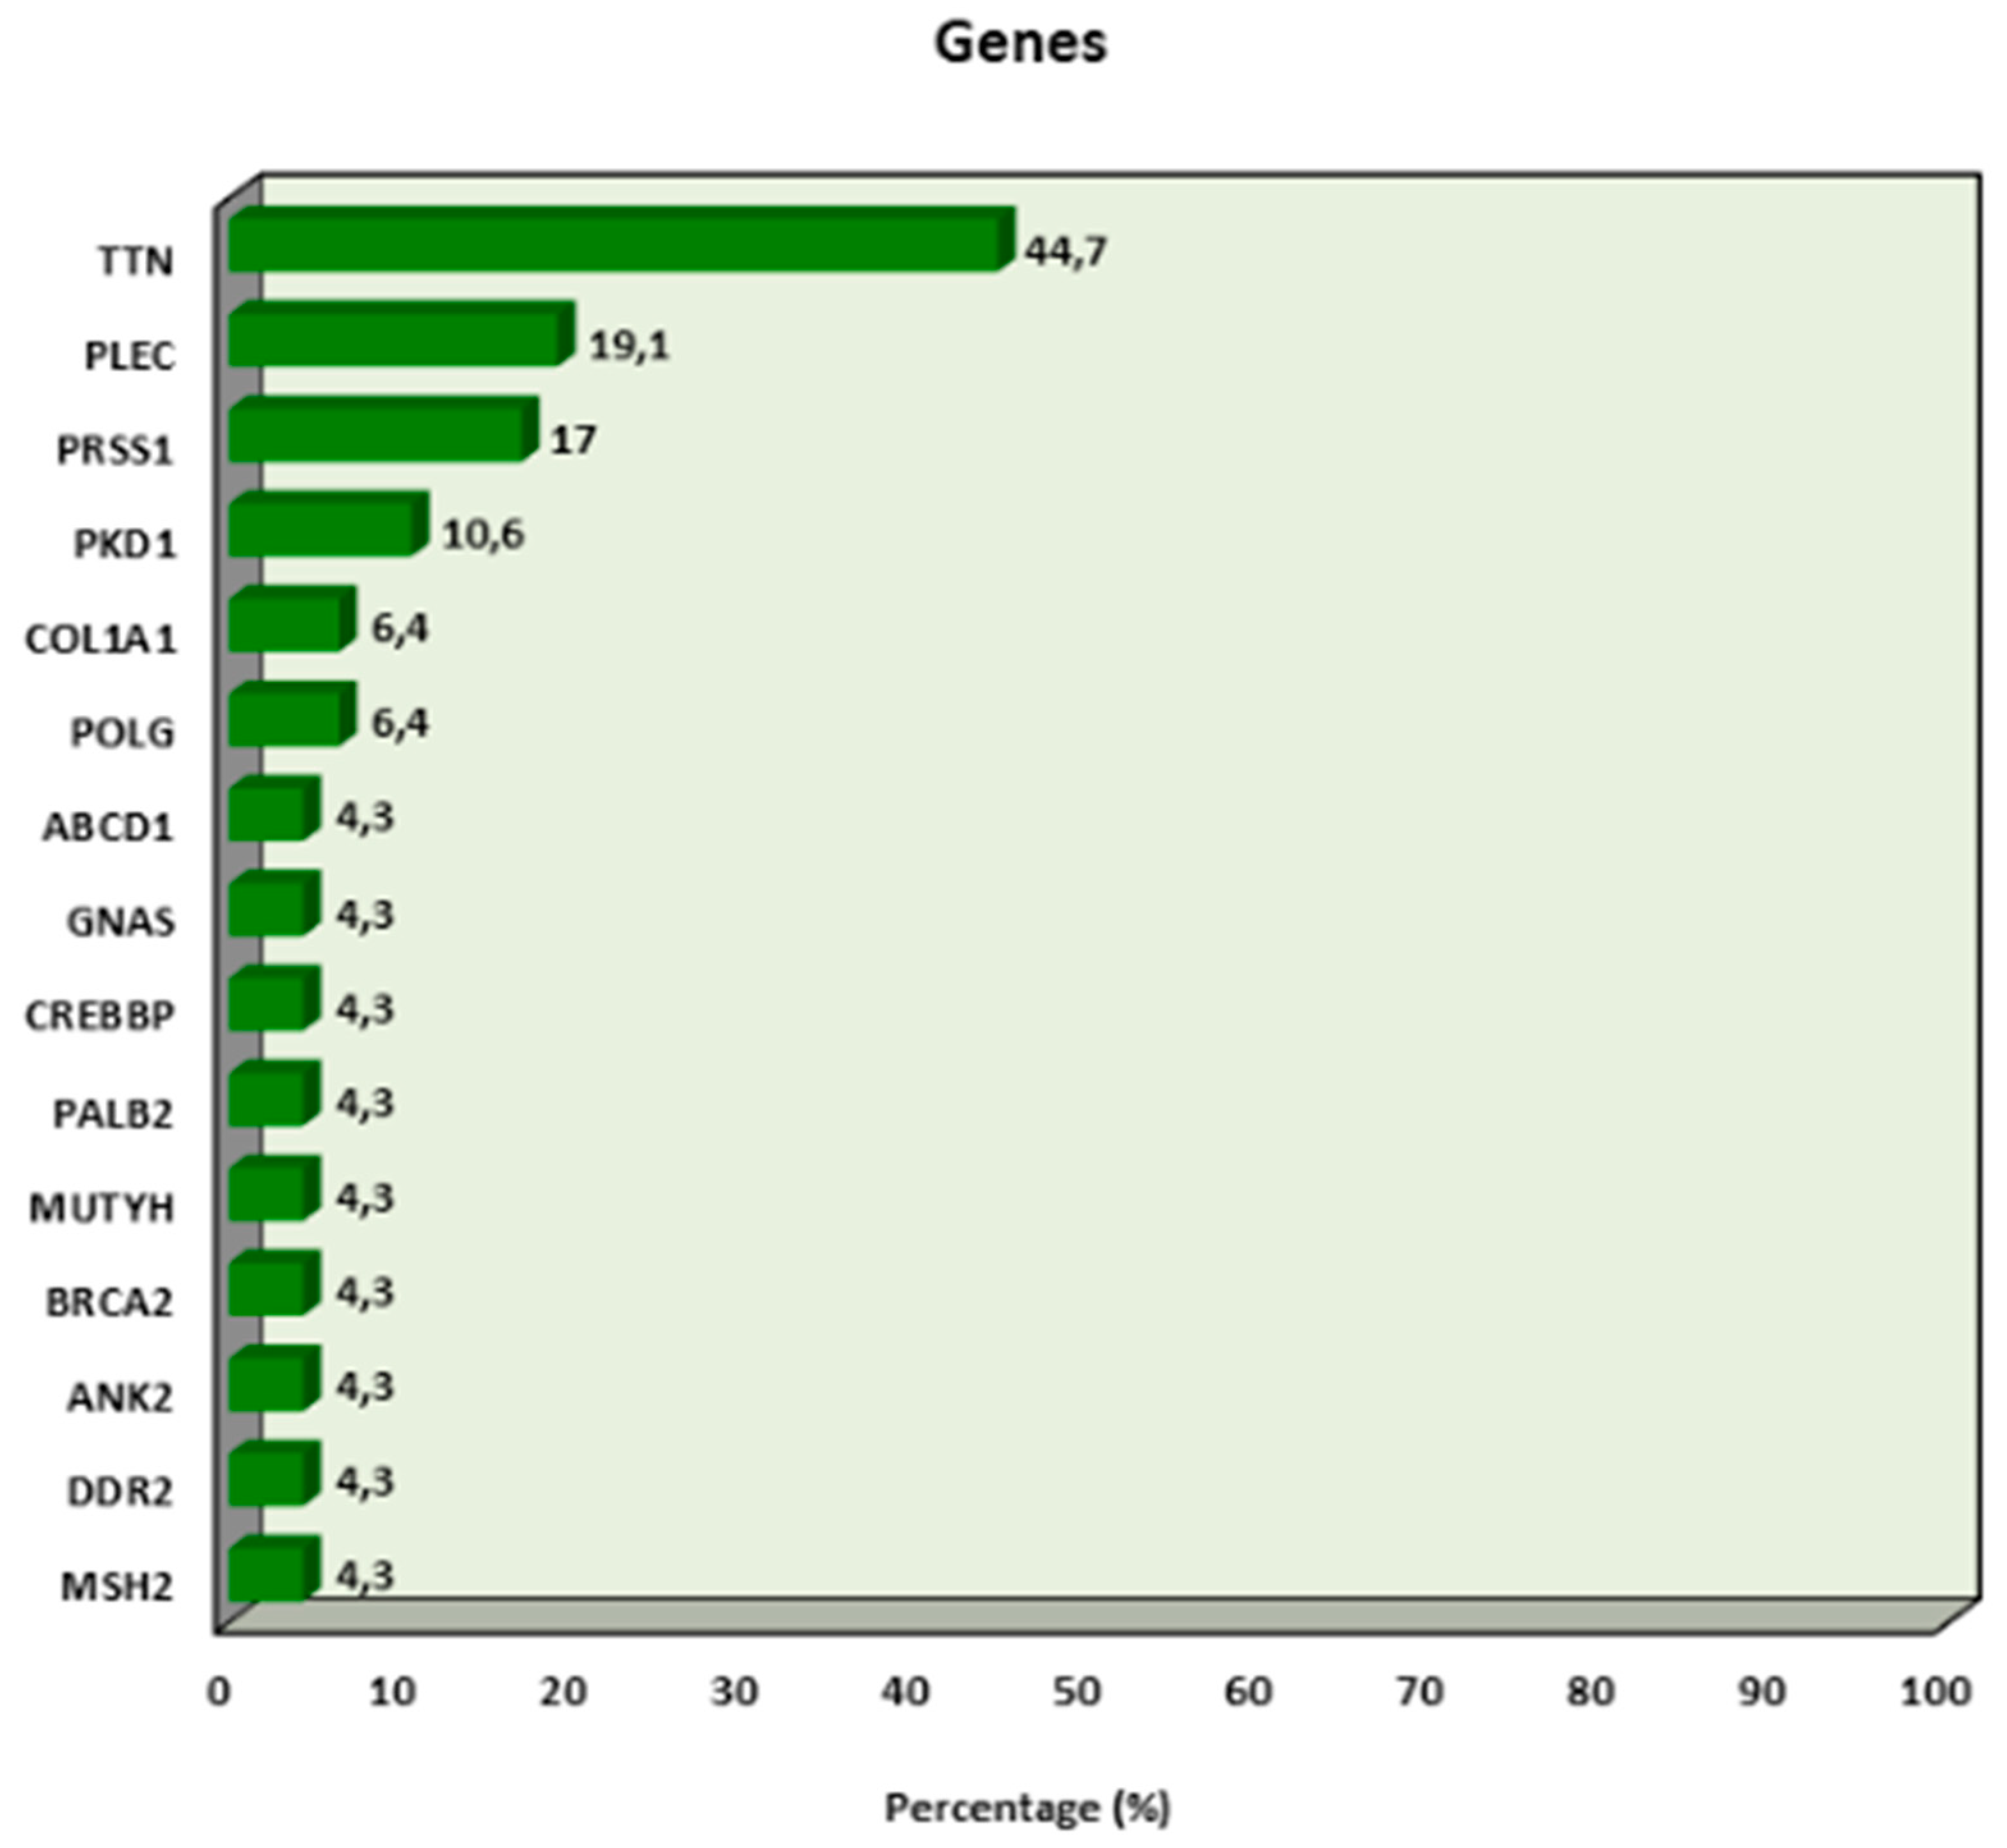
- Jia, Q.; Wang, J.; He, N.; He, J.; Zhu, B. Titin mutation associated with responsiveness to checkpoint blockades in solid tumors. JCI Insight 2019, 4. [Google Scholar] [CrossRef]
- Shen, L.; Wu, Y.; Li, A.; Li, L.; Shen, L.; Jiang, Q.; Li, Q.; Wu, Z.; Yu, L.; Zhang, X. LncRNA TTN-AS1 promotes endometrial cancer by sponging miR-376a-3p. Oncol. Rep. 2020, 44, 1343–1354. [Google Scholar] [CrossRef]
- Wiche, G.; Osmanagic-Myers, S.; Castañón, M.J. Networking and anchoring through plectin: A key to IF functionality and mechanotransduction. Curr. Opin. Cell Biol. 2015, 32, 21–29. [Google Scholar] [CrossRef] [PubMed]
- Perez, S.M.; Brinton, L.T.; Kelly, K.A. Plectin in Cancer: From Biomarker to Therapeutic Target. Cells 2021, 10, 2246. [Google Scholar] [CrossRef] [PubMed]
- Yamamoto, H.; Iku, S.; Adachi, Y.; Imsumran, A.; Taniguchi, H.; Nosho, K.; Min, Y.; Horiuchi, S.; Yoshida, M.; Itoh, F.; et al. Association of trypsin expression with tumour progression and matrilysin expression in human colorectal cancer. J. Pathol. 2003, 199, 176–184. [Google Scholar] [CrossRef] [PubMed]
- Xing, L.; Tian, S.; Mi, W.; Zhang, Y.; Zhang, Y.; Zhang, Y.; Xu, F.; Zhang, C.; Lou, G. PRSS1 Upregulation Predicts Platinum Resistance in Ovarian Cancer Patients. Front. Cell Dev. Biol. 2020, 8, 618341. [Google Scholar] [CrossRef]
- Lax, S.F. Pathology of Endometrial Carcinoma. Adv. Exp. Med. Biol. 2017, 943, 75–96. [Google Scholar] [CrossRef]
- Corcoran, R.B.; Chabner, B.A. Application of Cell-free DNA Analysis to Cancer Treatment. N. Engl. J. Med. 2018, 379, 1754–1765. [Google Scholar] [CrossRef]
- Elshimali, Y.I.; Khaddour, H.; Sarkissyan, M.; Wu, Y.; Vadgama, J.V. The clinical utilization of circulating cell free DNA (CCFDNA) in blood of cancer patients. Int. J. Mol. Sci. 2013, 14, 18925–18958. [Google Scholar] [CrossRef]
- Bolivar, A.M.; Luthra, R.; Mehrotra, M.; Chen, W.; Barkoh, B.A.; Hu, P.; Zhang, W.; Broaddus, R.R. Targeted next-generation sequencing of endometrial cancer and matched circulating tumor DNA: Identification of plasma-based, tumor-associated mutations in early stage patients. Mod. Pathol. 2019, 32, 405–414. [Google Scholar] [CrossRef]
- Uzel, K.; Lakhno, I. The role of endometrial thicknesses as risk factor in endometrial pathologies. Int. J. Surg. Med. 2021, 7, 23–27. [Google Scholar] [CrossRef]
- Metin, M.R.; Aydın, H.; Ünal, Ö.; Akçay, Y.; Duymuş, M.; Türkyılmaz, E.; Avcu, S. Differentiation between endometrial carcinoma and atypical endometrial hyperplasia with transvaginal sonographic elastography. Diagn. Interv. Imaging 2016, 97, 425–431. [Google Scholar] [CrossRef]
- Uzel, K.; Lakhno, I. Comparison of pre- and postoperative techniques in the assessment of histological tumor grading in patients with endometrial carcinoma: A descriptive cross-sectional study. Curr. Gynecol. Oncology Oncol. 2019, 17, 158–163. [Google Scholar] [CrossRef]
- Guler, A.H.; Ates, M.C.; Avcı, F.; Seher, N.; Cintesun, E.; Bilgi, A.; Korez, M.K.; Koplay, M.; Celik, C. The role of shear wave elastography in predicting endometrial cancer in patients presenting with abnormal uterine bleeding. Eur. Rev. Med. Pharmacol. Sci. 2024, 28, 365–372. [Google Scholar] [CrossRef]
- Richards, S.; Aziz, N.; Bale, S.; Bick, D.; Das, S.; Gastier-Foster, J.; Grody, W.W.; Hegde, M.; Lyon, E.; Spector, E.; et al. Standards and guidelines for the interpretation of sequence variants: A joint consensus recommendation of the American College of Medical Genetics and Genomics and the Association for Molecular Pathology. Genet. Med. 2015, 17, 405–424. [Google Scholar] [CrossRef] [PubMed]
- Xu, Y.; Bai, X.; Chen, Y.; Jiang, L.; Hu, B.; Hu, B.; Yu, L. Application of Real-time Elastography Ultrasound in the Diagnosis of Axillary Lymph Node Metastasis in Breast Cancer Patients. Sci. Rep. 2018, 8, 10234. [Google Scholar] [CrossRef]
- Ma, Y.; Zhang, S.; Zang, L.; Li, J.; Li, J.; Kang, Y.; Ren, W. Combination of shear wave elastography and Ki-67 index as a novel predictive modality for the pathological response to neoadjuvant chemotherapy in patients with invasive breast cancer. Eur. J. Cancer 2016, 69, 86–101. [Google Scholar] [CrossRef]
- Machida, Y.; Shimauchi, A.; Okuma, H.; Tozaki, M.; Isobe, S.; Fukuma, E. Shear Wave Speed of the Lesion in Preoperative Breast Ultrasonography: Association with Disease-free Survival of Patients with Primary Operable Invasive Breast Cancer. Acad. Radiol. 2018, 25, 1003–1009. [Google Scholar] [CrossRef] [PubMed]
- Ong, C.L.; Chew, L.E.; Han, N.R.; Ooi, C.C.; Yeo, Y.C.; Chew, S.H.; Wong, W.L.; Tang, P.H.; Teo, S.Y. The Characteristics of Real-time Transvaginal Sono-elastography in Endometrial Cancer. J. Med. Ultrasound 2022, 30, 101–108. [Google Scholar] [CrossRef]
- Tan, J.; Ong, C.K.; Lim, W.K.; Ng, C.C.; Thike, A.A.; Ng, L.M.; Rajasegaran, V.; Myint, S.S.; Nagarajan, S.; Thangaraju, S.; et al. Genomic landscapes of breast fibroepithelial tumors. Nat. Genet. 2015, 47, 1341–1345. [Google Scholar] [CrossRef] [PubMed]
- Xie, S.N.; Cai, Y.J.; Ma, B.; Xu, Y.; Qian, P.; Zhou, J.D.; Zhao, F.G.; Chen, J. The genomic mutation spectrums of breast fibroadenomas in Chinese population by whole exome sequencing analysis. Cancer Med. 2019, 8, 2372–2379. [Google Scholar] [CrossRef]
- Chen, X.; Chang, C.W.; Spoerke, J.M.; Yoh, K.E.; Kapoor, V.; Baudo, C.; Aimi, J.; Yu, M.; Liang-Chu, M.M.Y.; Suttmann, R.; et al. Low-pass Whole-genome Sequencing of Circulating Cell-free DNA Demonstrates Dynamic Changes in Genomic Copy Number in a Squamous Lung Cancer Clinical Cohort. Clin. Cancer Res. 2019, 25, 2254–2263. [Google Scholar] [CrossRef]

| Database | URL |
|---|---|
| ClinVar | https://www.ncbi.nlm.nih.gov/clinvar/ (accessed on 1 May 2021) |
| dbSNP | https://www.ncbi.nlm.nih.gov/snp/ (accessed on 1 May 2021) |
| MutationTaster | http://www.mutationtaster.org/ (accessed on 1 May 2021) |
| VarSome | https://varsome.com/ (accessed on 1 May 2021) |
| Franklin | https://franklin.genoox.com/clinical-db/home (accessed on 1 May 2021) |
| gnomAD | https://gnomad.broadinstitute.org/ (accessed on 1 May 2021) |
| Classification | Criteria and Evidence Codes |
|---|---|
| Pathogenic (P) |
|
| Likely Pathogenic (LP) |
|
| Benign (B) |
|
| Likely Benign (LB) |
|
| Variants of Uncertain Significance (VUS) |
|
| Variable | Mean ± SD | Median (Min–Max) |
|---|---|---|
| Age (years) | 59.45 ± 10.70 | 62 (30–84) |
| Gravida | 3.30 ± 2.09 | 3 (0–9) |
| Parity | 2.64 ± 1.74 | 3 (0–8) |
| Height (cm) (n = 31) | 161.65 ± 5.10 | 162 (150–170) |
| Weight (cm) (n = 31) | 94.06 ± 19.62 | 87 (65–139) |
| BMI (kg/m2) (n = 30) | 36.11 ± 7.61 | 35 (25.5–57.9) |
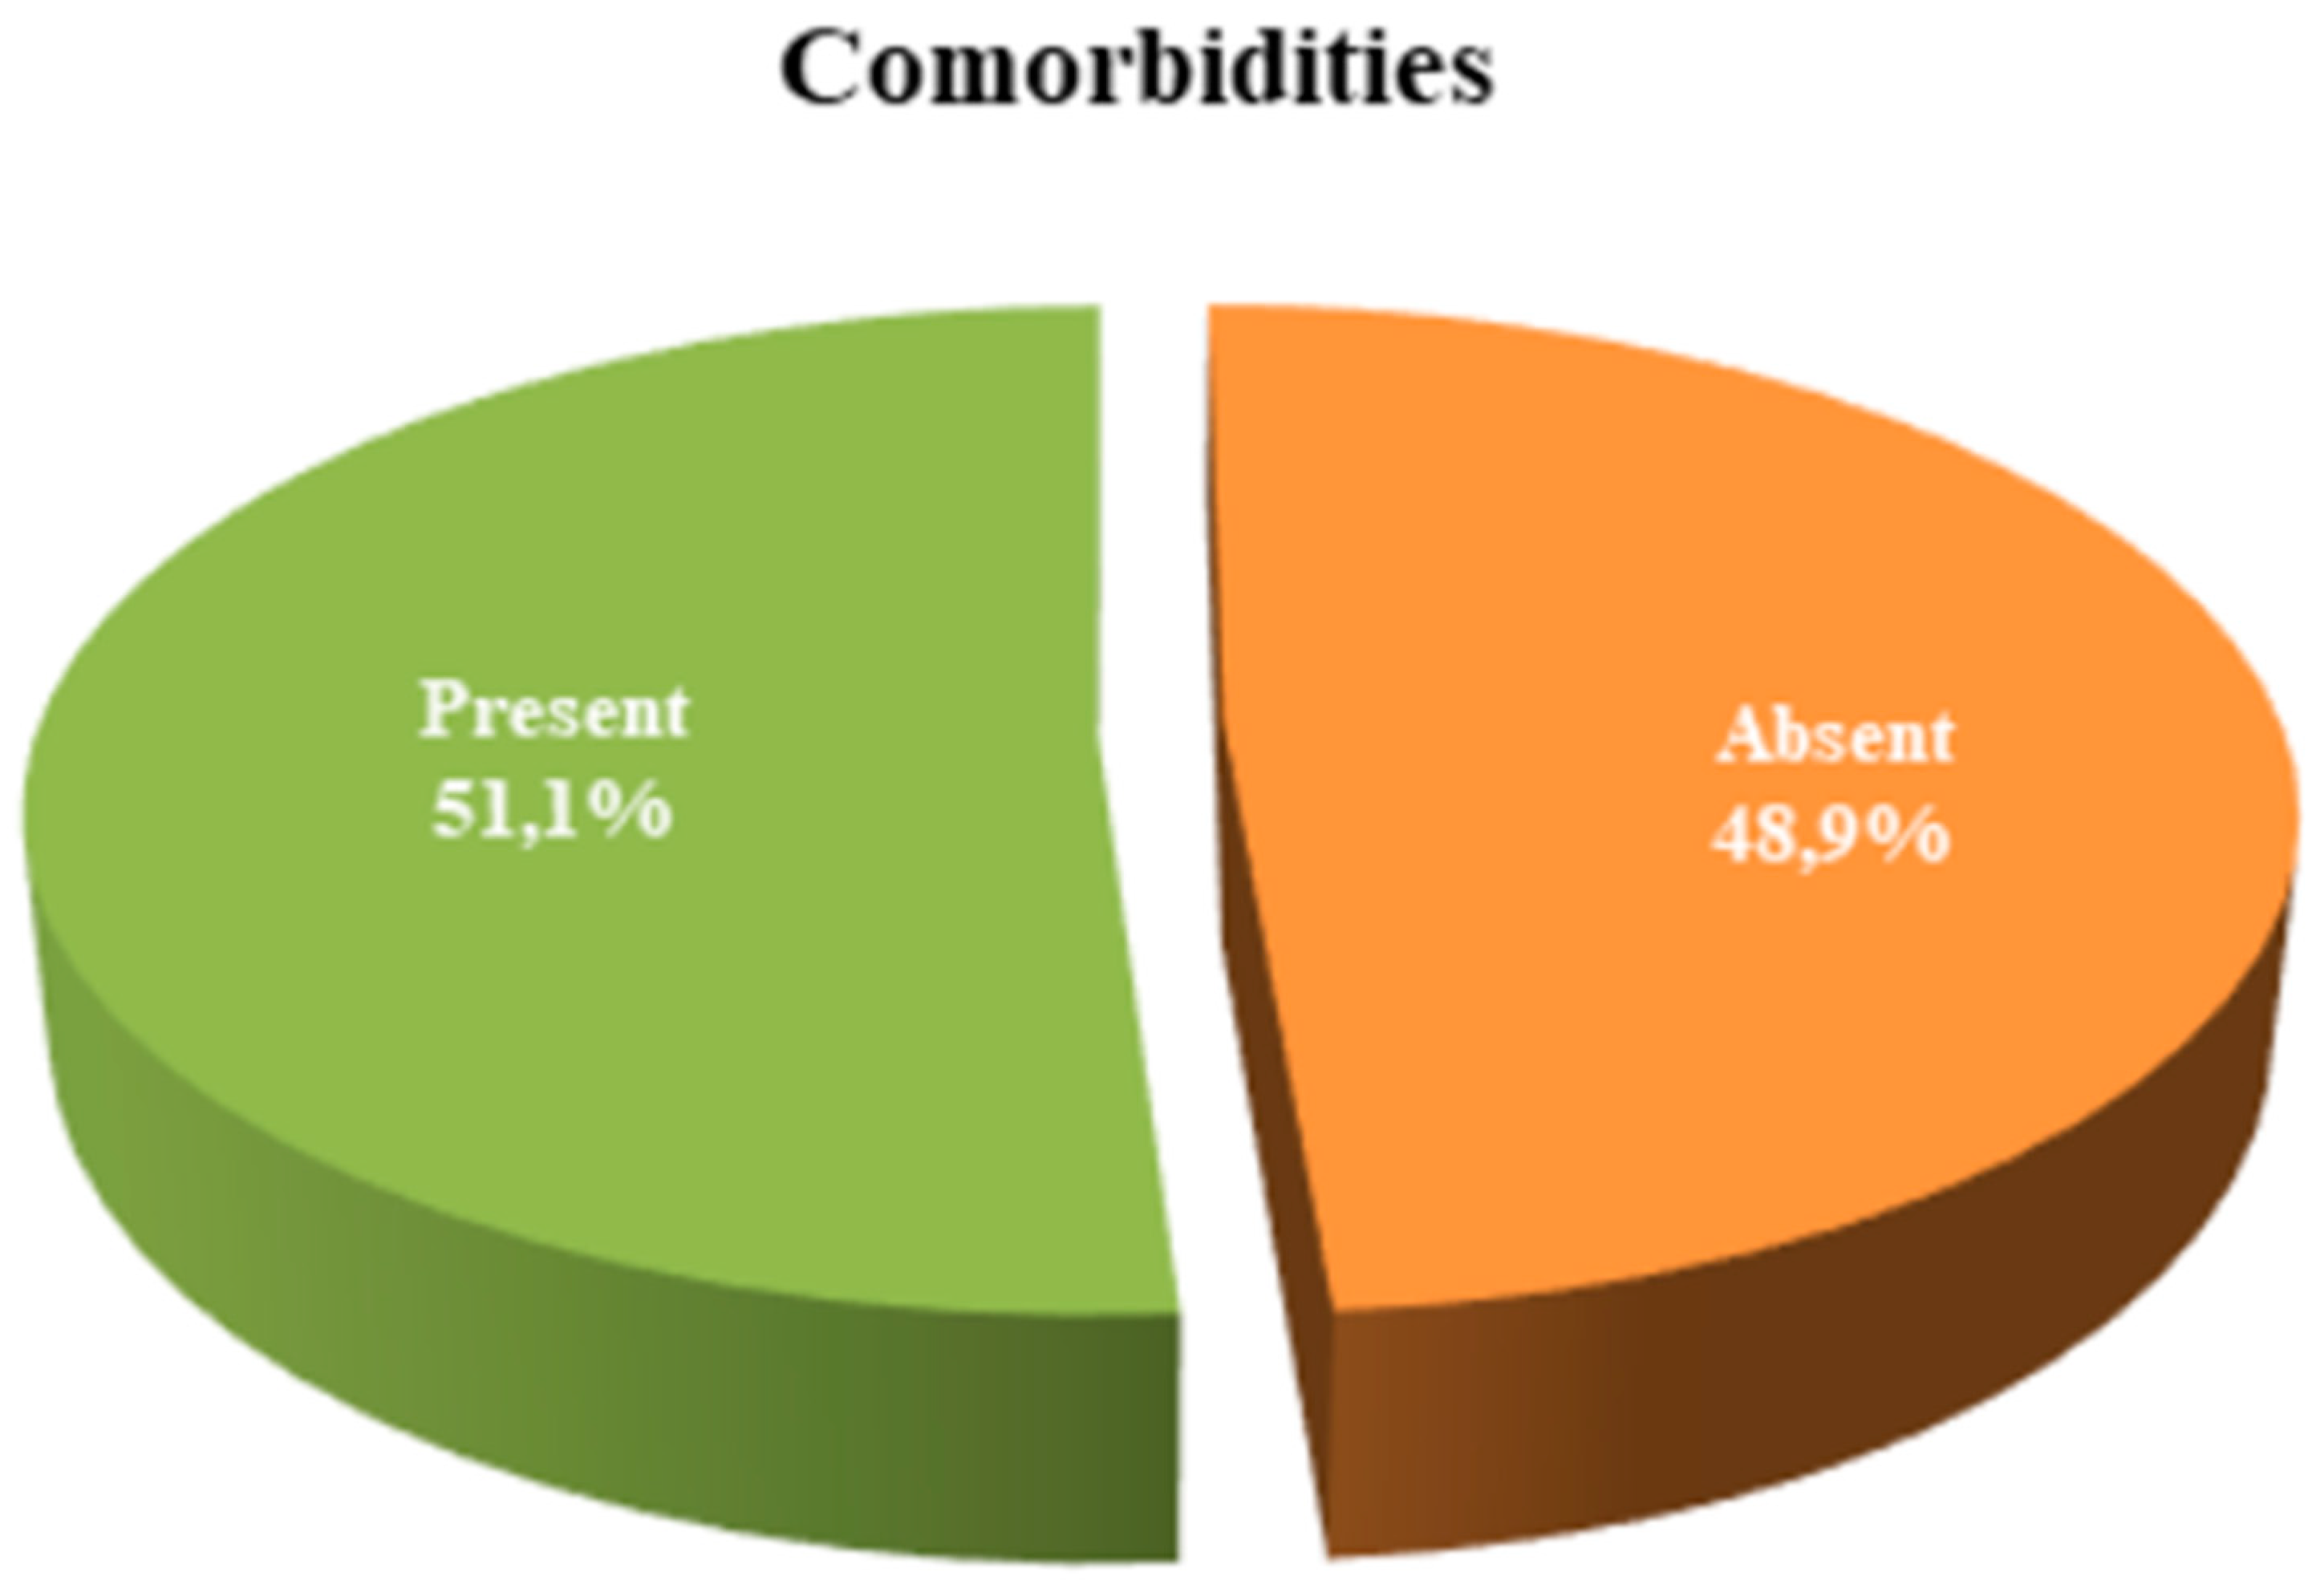
| Comorbidities | n (%) | |
| Absent | 23 (48.9) | |
| Present | 24 (51.1) | |
| Medication Use | n (%) | |
| No | 14 (29.8) | |
| Yes | 33 (70.2) | |
| Diabetes Mellitus (DM) | n (%) | |
| No | 35 (74.5) | |
| Yes | 12 (25.5) | |
| Hypertension (HT) | n (%) | |
| No | 23 (48.9) |
| Parameters | Mean ± SD | Median (Min–Max) |
|---|---|---|
| HB (g/dL) | 13.09 ± 1.68 | 13.5 (8.5–17.3) |
| HCT (%) | 39.30 ± 4.50 | 39.6 (27.1–49.6) |
| WBC (×103/µL) | 8.36 ± 2.43 | 7.8 (4.8–17.8) |
| LYM (×103/µL) | 2.32 ± 0.89 | 2.3 (0.4–4.3) |
| EOS (%) | 5.29 ± 2.34 | 4.8 (3.1–15.3) |
| PLT (×103/µL) | 277.16 ± 61.82 | 267 (155–418) |
| ALT (U/L) | 21.23 ± 10.78 | 18 (6.4–54.6) |
| AST (U/L) | 21.15 ± 7.91 | 19 (11.3–48.2) |
| LDH (U/L) (n = 41) | 221.12 ± 50.66 | 216 (151–381) |
| Urea (mg/dL) | 30.76 ± 9.59 | 29.1 (13.1–55.7) |
| Creatinine (mg/dL) | 0.76 ± 0.16 | 0.8 (0.5–1.2) |
| Albumin (g/L) (n = 45) | 43.07 ± 4.34 | 44.3 (26.5–50) |
| US Measurement (mm) (n = 38) | 19.93 ± 9.83 | 16.5 (5.5–47) |
| Treatment (n = 43) | n (%) | |
| BT | 24 (55.8%) | |
| BT + CT | 2 (4.7%) | |
| Intensity-Modulated Radiation Therapy | 1 (2.3%) | |
| Only CT | 2 (4.7%) | |
| CT + RT | 1 (2.3%) | |
| Follow-up Only | 13 (30.2%) | |
| Shear Wave Elastography (SWE. kPa) (n = 29) | Mean ± SD | Median (Min–Max) |
| kPa Measurement | 39.56 ± 14.21 | 36.5 (19.1–70.4) |
| <40 kPa n (%) | 18 (62.1%) | |
| ≥40 kPa n (%) | 11 (37.9%) | |
| Number of Gene Mutations | 2.28 ± 1.96 | 3 (0–6) |
| Mutation Status | n (%) | |
| Absent | 16 (34.0%) | |
| Present | 31 (66.0%) | |
| 1–2 Mutations | 7 (22.6%) | |
| 3–4 Mutations | 19 (61.3%) | |
| 5–6 Mutations | 5 (16.1%) |
| kPa | a p | kPa | b p | ||||
|---|---|---|---|---|---|---|---|
| Mean ± SD | Median (Min–Max) | <40 | ≥40 | ||||
| Gene mutation | Absent | 42.99 ± 14.24 | 42.2 (25–63.9) | 0.374 | 4 (22.2) | 4 (36.4) | 0.433 |
| Present | 38.26 ± 14.32 | 33 (19.1–70.4) | 14 (77.8) | 7 (63.6) | |||
| TTN | Absent | 41.44 ± 15.69 | 36.5 (24.4–70.4) | 0.650 | 10 (55.6) | 6 (54.5) | 1.000 |
| Present | 37.26 ± 12.36 | 37.7 (19.1–63.6) | 8 (44.4) | 5 (45.5) | |||
| PLEC | Absent | 40.61 ± 14.91 | 36.5 (23.2–70.4) | 0.618 | 14 (77.8) | 9 (81.8) | 1.000 |
| Present | 35.56 ± 11.32 | 34.1 (19.1–50.4) | 4 (22.2) | 2 (18.2) | |||
| PRSS1 | Absent | 37.92 ± 13.13 | 36.5 (19.1–66) | 0.328 | 15 (83.3) | 8 (72.7) | 0.646 |
| Present | 45.85 ± 17.64 | 40.1 (30.5–70.4) | 3 (16.7) | 3 (27.3) | |||
| PKD1 | Absent | 39.50 ± 13.64 | 36.5 (23.2–70.4) | 0.973 | 16 (88.9) | 10 (90.9) | 1.000 |
| Present | 40.12 ± 22.37 | 37.7 (19.1–63.6) | 2 (11.1) | 1 (9.1) | |||
| COL1A1 | Absent | 40.11 ± 14.13 | 36.5 (23.2–70.4) | 0.493 | 17 (94.4) | 10 (90.9) | 1.000 |
| Present | 32.13 ± 18.48 | 32.1 (19.1–45.2) | 1 (5.6) | 1 (9.1) | |||
| POLG | Absent | 39.80 ± 14.41 | 36.9 (19.1–70.4) | 0.897 | 17 (94.4) | 11 (100.0) | 1.000 |
| Present | 33.00 ± 0.00 | 33 (33–33) | 1 (5.6) | 0 (0.0) | |||
| Metastasis | p | |||
|---|---|---|---|---|
| Absent | Present | |||
| Gene mutation | Absent | 14 (32.6) | 2 (50.0) | b 0.597 |
| Present | 29 (67.4) | 2 (50.0) | ||
| Mutation number | Mean ± SD | 2.35 ± 1.97 | 1.50 ± 1.91 | a 0.449 |
| Median (Min–Max) | 3 (0–6) | 1 (0–4) | ||
| TTN | Absent | 23 (53.5) | 3 (75.0) | b 0.617 |
| Present | 20 (46.5) | 1 (25.0) | ||
| PLEC | Absent | 34 (79.1) | 4 (100.0) | b 0.574 |
| Present | 9 (20.9) | 0 (0.0) | ||
| PRSS1 | Absent | 35 (81.4) | 4 (100.0) | b 1.000 |
| Present | 8 (18.6) | 0 (0.0) | ||
| PKD1 | Absent | 38 (88.4) | 4 (100.0) | b 1.000 |
| Present | 5 (11.6) | 0 (0.0) | ||
| COL1A1 | Absent | 40 (93.0) | 4 (100.0) | b 1.000 |
| Present | 3 (7.0) | 0 (0.0) | ||
| POLG | Absent | 40 (93.0) | 4 (100.0) | b 1.000 |
| Present | 3 (7.0) | 0 (0.0) | ||
| kPa | Mean ± SD | 38.64 ± 14.03 | 47.53 ± 16.09 | a 0.251 |
| Median (Min–Max) | 34.7 (19.1–70.4) | 40.1 (36.5–66) | ||
Disclaimer/Publisher’s Note: The statements, opinions and data contained in all publications are solely those of the individual author(s) and contributor(s) and not of MDPI and/or the editor(s). MDPI and/or the editor(s) disclaim responsibility for any injury to people or property resulting from any ideas, methods, instructions or products referred to in the content. |
© 2025 by the authors. Licensee MDPI, Basel, Switzerland. This article is an open access article distributed under the terms and conditions of the Creative Commons Attribution (CC BY) license (https://creativecommons.org/licenses/by/4.0/).
Share and Cite
Uzel, K.; Bilir, F.; Tosun, M.; Topbas Selcuki, N.F.; Eren Keskin, S.; Gokbayrak, M.; Demir, G.; Cine, N.; Ulug, P.; Iyibozkurt, A.C.; et al. The Role of Ultrasonography in Predicting Genetic Characteristics of Endometrial Cancers. J. Clin. Med. 2025, 14, 3216. https://doi.org/10.3390/jcm14093216
Uzel K, Bilir F, Tosun M, Topbas Selcuki NF, Eren Keskin S, Gokbayrak M, Demir G, Cine N, Ulug P, Iyibozkurt AC, et al. The Role of Ultrasonography in Predicting Genetic Characteristics of Endometrial Cancers. Journal of Clinical Medicine. 2025; 14(9):3216. https://doi.org/10.3390/jcm14093216
Chicago/Turabian StyleUzel, Kemine, Filiz Bilir, Mesude Tosun, Nura Fitnat Topbas Selcuki, Seda Eren Keskin, Merve Gokbayrak, Gulhan Demir, Naci Cine, Pasa Ulug, Ahmet Cem Iyibozkurt, and et al. 2025. "The Role of Ultrasonography in Predicting Genetic Characteristics of Endometrial Cancers" Journal of Clinical Medicine 14, no. 9: 3216. https://doi.org/10.3390/jcm14093216
APA StyleUzel, K., Bilir, F., Tosun, M., Topbas Selcuki, N. F., Eren Keskin, S., Gokbayrak, M., Demir, G., Cine, N., Ulug, P., Iyibozkurt, A. C., & Savlı, H. (2025). The Role of Ultrasonography in Predicting Genetic Characteristics of Endometrial Cancers. Journal of Clinical Medicine, 14(9), 3216. https://doi.org/10.3390/jcm14093216