
Use of Metabolic Scores and Lipid Ratios to Predict Metabolic Dysfunction-Associated Steatotic Liver Disease Onset in Patients with Inflammatory Bowel Diseases

 ,
,  ,
,  ,
,  and
and
Abstract
1. Introduction
1.1. Interplay Between IBD and MASLD
1.2. Diagnostic Tools
1.3. Aim of the Study
2. Materials and Methods
2.1. Study Design
2.2. Demographic, Anthropometric, and Clinical Data Collection
2.3. Laboratory and Treatment Data Collection
2.4. Anthropometric, Clinical Scores, and Ratios Calculation
2.5. Statistical Analysis
3. Results
4. Discussion
4.1. Comparison Between the Different Cohorts
4.2. Metabolic Scores and Lipid Ratios Accuracy Analysis
4.3. Limitations
5. Conclusions
Author Contributions
Funding
Institutional Review Board Statement
Informed Consent Statement
Data Availability Statement
Acknowledgments
Conflicts of Interest
Abbreviations
| ALT | Alanine aminotransferase |
| AST | Aspartate aminotransferase |
| AUC | Area under the curve |
| BMI | Body mass index |
| CD | Crohn’s disease |
| CI | Confidence interval |
| CRP | C-reactive protein |
| FIB-4 | Fibrosis-4 index |
| HOMA-IR | Homeostasis model assessment of insulin resistance |
| HDL | High-density lipoprotein |
| IBD | Inflammatory bowel disease |
| LAP | Lipid accumulation product |
| LDL | Low-density lipoprotein |
| MAFLD | Metabolic dysfunction-associated fatty liver disease |
| MASLD | Metabolic dysfunction-associated steatotic liver disease |
| METS-IR | Metabolic score for insulin resistance |
| NAFLD | Non-alcoholic fatty liver disease |
| ROC | Receiver operating characteristic |
| SD | Standard deviation |
| T2DM | Type 2 diabetes mellitus |
| TG | Triglycerides |
| TG/HDL | Triglyceride-to-high-density lipoprotein cholesterol ratio |
| TNF-α | Tumor necrosis factor-alpha |
| TyG | Triglyceride-glucose index |
| UC | Ulcerative colitis |
| VAI | Visceral adiposity index |
References
- Chan, W.K.; Chuah, K.H.; Rajaram, R.B.; Lim, L.L.; Ratnasingam, J.; Vethakkan, S.R. Metabolic Dysfunction-Associated Steatotic Liver Disease (MASLD): A State-of-the-Art Review. J. Obes. Metab. Syndr. 2023, 32, 197–213. [Google Scholar] [CrossRef] [PubMed]
- Miao, L.; Targher, G.; Byrne, C.D.; Cao, Y.Y.; Zheng, M.H. Current status and future trends of the global burden of MASLD. Trends Endocrinol. Metab. 2024, 35, 697–707. [Google Scholar] [CrossRef]
- Hagström, H.; Shang, Y.; Hegmar, H.; Nasr, P. Natural history and progression of metabolic dysfunction-associated steatotic liver disease. Lancet Gastroenterol. Hepatol. 2024, 9, 944–956. [Google Scholar] [CrossRef]
- Noureddin, N.; Copur-Dahi, N.; Loomba, R. Monitoring disease progression in metabolic dysfunction-associated steatotic liver disease. Aliment. Pharmacol. Ther. 2024, 59, S41–S51. [Google Scholar] [CrossRef]
- Spagnuolo, R.; Larussa, T.; Iannelli, C.; Cosco, C.; Nisticò, E.; Manduci, E.; Bruno, A.; Boccuto, L.; Abenavoli, L.; Luzza, F.; et al. COVID-19 and Inflammatory Bowel Disease: Patient Knowledge and Perceptions in a Single Center Survey. Medicina 2020, 56, 407. [Google Scholar] [CrossRef]
- Lin, D.; Jin, Y.; Shao, X.; Xu, Y.; Ma, G.; Jiang, Y.; Xu, Y.; Jiang, Y.; Hu, D. Global, regional, and national burden of inflammatory bowel disease, 1990-2021: Insights from the global burden of disease 2021. Int. J. Colorectal. Dis. 2024, 39, 139. [Google Scholar] [CrossRef]
- Rogler, G.; Singh, A.; Kavanaugh, A.; Rubin, D.T. Extraintestinal Manifestations of Inflammatory Bowel Disease: Current Concepts, Treatment, and Implications for Disease Management. Gastroenterology 2021, 161, 1118–1132. [Google Scholar] [CrossRef] [PubMed]
- Scarlata, G.G.M.; Abenavoli, L. Gut microbiota: The pathogenetic bridge between inflammatory bowel disease and metabolic-associated steatotic liver disease. Expert. Rev. Gastroenterol. Hepatol. 2025, 19, 85–88. [Google Scholar] [CrossRef] [PubMed]
- Colaci, C.; Gambardella, M.L.; Scarlata, G.G.M.; Boccuto, L.; Colica, C.; Luzza, F.; Scarpellini, E.; Mendez-Sanchez, N.; Abenavoli, L. Dysmetabolic comorbidities and non-alcoholic fatty liver disease: A stairway to metabolic dysfunction-associated steatotic liver disease. Hepatoma Res. 2024, 10, 16. [Google Scholar] [CrossRef]
- Rodriguez-Duque, J.C.; Calleja, J.L.; Iruzubieta, P.; Hernández-Conde, M.; Rivas-Rivas, C.; Vera, M.I.; Garcia, M.J.; Pascual, M.; Castro, B.; García-Blanco, A.; et al. Increased risk of MAFLD and Liver Fibrosis in Inflammatory Bowel Disease Independent of Classic Metabolic Risk Factors. Clin. Gastroenterol. Hepatol. 2023, 21, 406–414.e7. [Google Scholar] [CrossRef]
- Ahmadizar, F.; Younossi, Z.M. Exploring Biomarkers in Nonalcoholic Fatty Liver Disease Among Individuals with Type 2 Diabetes Mellitus. J. Clin. Gastroenterol. 2025, 59, 36–46. [Google Scholar] [CrossRef] [PubMed]
- Lee, D.H. Imaging evaluation of non-alcoholic fatty liver disease: Focused on quantification. Clin. Mol. Hepatol. 2017, 23, 290–301. [Google Scholar] [CrossRef] [PubMed]
- Chang, P.E.; Goh, G.B.; Ngu, J.H.; Tan, H.K.; Tan, C.K. Clinical applications, limitations and future role of transient elastography in the management of liver disease. World J. Gastrointest. Pharmacol. Ther. 2016, 7, 91–106. [Google Scholar] [CrossRef]
- Hazzan, R.; Abu Ahmad, N.; Habib, A.S.; Saleh, I.; Ziv, N. Suboptimal reliability of FIB-4 and NAFLD-fibrosis scores for staging of liver fibrosis in general population. JGH Open 2024, 8, e13034. [Google Scholar] [CrossRef] [PubMed]
- Abdelhameed, F.; Kite, C.; Lagojda, L.; Dallaway, A.; Chatha, K.K.; Chaggar, S.S.; Dalamaga, M.; Kassi, E.; Kyrou, I.; Randeva, H.S. Non-invasive Scores and Serum Biomarkers for Fatty Liver in the Era of Metabolic Dysfunction-associated Steatotic Liver Disease (MASLD): A Comprehensive Review From NAFLD to MAFLD and MASLD. Curr. Obes. Rep. 2024, 13, 510–531. [Google Scholar] [CrossRef]
- Maaser, C.; Sturm, A.; Vavricka, S.R.; Kucharzik, T.; Fiorino, G.; Annese, V.; Calabrese, E.; Baumgart, D.C.; Bettenworth, D.; Borralho Nunes, P.; et al. ECCO-ESGAR Guideline for Diagnostic Assessment in IBD Part 1: Initial diagnosis, monitoring of known IBD, detection of complications. J. Crohns Colitis 2019, 13, 144–164. [Google Scholar] [CrossRef]
- Abenavoli, L.; Spagnuolo, R.; Scarlata, G.G.M.; Scarpellini, E.; Boccuto, L.; Luzza, F. Ultrasound Prevalence and Clinical Features of Nonalcoholic Fatty Liver Disease in Patients with Inflammatory Bowel Diseases: A Real-Life Cross-Sectional Study. Medicina 2023, 59, 1935. [Google Scholar] [CrossRef]
- Abenavoli, L.; Scarlata, G.G.; Spagnuolo, R.; Luzza, F. Can dysmetabolic comorbidities carry hepatic fat accumulation in patients with inflammatory bowel diseases? Minerva Gastroenterol. 2024, 71, 74–76. [Google Scholar] [CrossRef]
- Abenavoli, L.; Spagnuolo, R.; Scarlata, G.G.M.; Gambardella, M.L.; Boccuto, L.; Méndez-Sánchez, N.; Luzza, F. Metabolic Dysfunction-Associated Steatotic Liver Disease in Patients with Inflammatory Bowel Diseases: A Pilot Study. Life 2024, 14, 1226. [Google Scholar] [CrossRef]
- Mancina, R.M.; De Bonis, D.; Pagnotta, R.; Cosco, C.; Cosco, V.; Montalcini, T.; Pujia, A.; Doldo, P.; Spagnuolo, R. Ulcerative Colitis as an Independent Risk Factor for Hepatic Steatosis. Gastroenterol. Nurs. 2020, 43, 292–297. [Google Scholar] [CrossRef]
- European Association for the Study of the Liver (EASL); European Association for the Study of Diabetes (EASD); European Association for the Study of Obesity (EASO). EASL-EASD-EASO Clinical Practice Guidelines for the management of non-alcoholic fatty liver disease. J. Hepatol. 2016, 64, 1388–1402. [Google Scholar]
- Rinella, M.E.; Lazarus, J.V.; Ratziu, V.; Francque, S.M.; Sanyal, A.J.; Kanwal, F.; Romero, D.; Abdelmalek, M.F.; Anstee, Q.M.; Arab, J.P.; et al. A multisociety Delphi consensus statement on new fatty liver disease nomenclature. J. Hepatol. 2023, 79, 1542–1556. [Google Scholar] [CrossRef] [PubMed]
- Best, W.R. Predicting the Crohn’s disease activity index from the Harvey-Bradshaw Index. Inflamm. Bowel Dis. 2006, 12, 304–310. [Google Scholar] [CrossRef] [PubMed]
- Lewis, J.D.; Chuai, S.; Nessel, L.; Lichtenstein, G.R.; Aberra, F.N.; Ellenberg, J.H. Use of the noninvasive components of the Mayo score to assess clinical response in ulcerative colitis. Inflamm. Bowel Dis. 2008, 14, 1660–1666. [Google Scholar] [CrossRef] [PubMed]
- Satsangi, J.; Silverberg, M.S.; Vermeire, S.; Colombel, J.F. The Montreal classification of inflammatory bowel disease: Controversies, consensus, and implications. Gut 2006, 55, 749–753. [Google Scholar] [CrossRef]
- Hamaguchi, M.; Kojima, T.; Itoh, Y.; Harano, Y.; Fujii, K.; Nakajima, T.; Kato, T.; Takeda, N.; Okuda, J.; Ida, K.; et al. The severity of ultrasonographic findings in nonalcoholic fatty liver disease reflects the metabolic syndrome and visceral fat accumulation. Am. J. Gastroenterol. 2007, 102, 2708–2715. [Google Scholar] [CrossRef] [PubMed]
- Weir, C.B.; Jan, A. BMI Classification Percentile And Cut Off Points. [Updated 26 June 2023]. In StatPearls [Internet]; StatPearls Publishing: Treasure Island, FL, USA, 2025. Available online: https://www.ncbi.nlm.nih.gov/books/NBK541070/ (accessed on 10 March 2025).
- Kahn, H.S. The “lipid accumulation product” performs better than the body mass index for recognizing cardiovascular risk: A population-based comparison. BMC Cardiovasc. Disord. 2005, 5, 26. [Google Scholar] [CrossRef]
- Amato, M.C.; Giordano, C.; Galia, M.; Criscimanna, A.; Vitabile, S.; Midiri, M.; Galluzzo, A.; AlkaMeSy Study Group. Visceral Adiposity Index: A reliable indicator of visceral fat function associated with cardiometabolic risk. Diabetes Care 2010, 33, 920–922. [Google Scholar] [CrossRef]
- Haffner, S.M.; Miettinen, H.; Stern, M.P. The homeostasis model in the San Antonio Heart Study. Diabetes Care 1997, 20, 1087–1092. [Google Scholar] [CrossRef]
- Bello-Chavolla, O.Y.; Almeda-Valdes, P.; Gomez-Velasco, D.; Viveros-Ruiz, T.; Cruz-Bautista, I.; Romo-Romo, A.; Sánchez-Lázaro, D.; Meza-Oviedo, D.; Vargas-Vázquez, A.; Campos, O.A.; et al. METS-IR, a novel score to evaluate insulin sensitivity, is predictive of visceral adiposity and incident type 2 diabetes. Eur. J. Endocrinol. 2018, 178, 533–544. [Google Scholar] [CrossRef]
- Baneu, P.; Văcărescu, C.; Drăgan, S.R.; Cirin, L.; Lazăr-Höcher, A.I.; Cozgarea, A.; Faur-Grigori, A.A.; Crișan, S.; Gaiță, D.; Luca, C.T.; et al. The Triglyceride/HDL Ratio as a Surrogate Biomarker for Insulin Resistance. Biomedicines 2024, 12, 1493. [Google Scholar] [CrossRef] [PubMed]
- Nayak, S.S.; Kuriyakose, D.; Polisetty, L.D.; Patil, A.A.; Ameen, D.; Bonu, R.; Shetty, S.P.; Biswas, P.; Ulrich, M.T.; Letafatkar, N.; et al. Diagnostic and prognostic value of triglyceride glucose index: A comprehensive evaluation of meta-analysis. Cardiovasc. Diabetol. 2024, 23, 310. [Google Scholar] [CrossRef] [PubMed]
- Tamada, M.; Makita, S.; Abiko, A.; Naganuma, Y.; Nagai, M.; Nakamura, M. Low-density lipoprotein cholesterol to high-density lipoprotein cholesterol ratio as a useful marker for early-stage carotid atherosclerosis. Metabolism 2010, 59, 653–657. [Google Scholar] [CrossRef]
- Blanco-Grau, A.; Gabriel-Medina, P.; Rodriguez-Algarra, F.; Villena, Y.; Lopez-Martínez, R.; Augustín, S.; Pons, M.; Cruz, L.M.; Rando-Segura, A.; Enfedaque, B.; et al. Assessing Liver Fibrosis Using the FIB4 Index in the Community Setting. Diagnostics 2021, 11, 2236. [Google Scholar] [CrossRef] [PubMed]
- Robin, X.; Turck, N.; Hainard, A.; Tiberti, N.; Lisacek, F.; Sanchez, J.C.; Müller, M. pROC: An open-source package for R and S+ to analyze and compare ROC curves. BMC Bioinform. 2011, 12, 77. [Google Scholar] [CrossRef]
- R Core Team. R: A Language and Environment for Statistical Computing; R Foundation for Statistical Computing: Vienna, Austria, 2025. [Google Scholar]
- He, Q.J.; Li, Y.F.; Zhao, L.T.; Lin, C.T.; Yu, C.Y.; Wang, D. Recent advances in age-related metabolic dysfunction-associated steatotic liver disease. World J. Gastroenterol. 2024, 30, 652–662. [Google Scholar] [CrossRef]
- Lin, Y.; Feng, X.; Cao, X.; Miao, R.; Sun, Y.; Li, R.; Ye, J.; Zhong, B. Age patterns of nonalcoholic fatty liver disease incidence: Heterogeneous associations with metabolic changes. Diabetol. Metab. Syndr. 2022, 14, 181. [Google Scholar] [CrossRef]
- Corrao, S.; Calvo, L.; Granà, W.; Scibetta, S.; Mirarchi, L.; Amodeo, S.; Falcone, F.; Argano, C. Metabolic dysfunction-associated steatotic liver disease: A pathophysiology and clinical framework to face the present and the future. Nutr. Metab. Cardiovasc. Dis. 2025, 35, 103702. [Google Scholar] [CrossRef]
- Pastras, P.; Papantoniou, K.; Tsounis, E.; Kanaloupitis, S.; Aggeletopoulou, I.; Geramoutsos, G.; Sotiropoulos, C.; Zisimopoulos, K.; Thomopoulos, K.; Theocharis, G.; et al. P1264 Metabolic dysfunction-associated steatotic liver disease (MASLD) in patients with Inflammatory Bowel Disease (IBD). A prospective single-center study. J. Crohn’s Colitis 2025, 19, i2286. [Google Scholar] [CrossRef]
- Zou, H.; Ma, X.; Pan, W.; Xie, Y. Comparing similarities and differences between NAFLD, MAFLD, and MASLD in the general U.S. population. Front. Nutr. 2024, 11, 1411802. [Google Scholar] [CrossRef]
- Zheng, H.; Sechi, L.A.; Navarese, E.P.; Casu, G.; Vidili, G. Metabolic dysfunction-associated steatotic liver disease and cardiovascular risk: A comprehensive review. Cardiovasc. Diabetol. 2024, 23, 346. [Google Scholar] [CrossRef] [PubMed]
- Capela, T.L.; Silva, V.M.; Freitas, M.; Arieira, C.; Gonçalves, T.C.; de Castro, F.D.; Magalhães, J.; Cotter, J. Identifying inflammatory bowel disease patients at risk of metabolic dysfunction-associated fatty liver disease: Usefulness of non-invasive steatosis predictive scores. BMC Gastroenterol. 2023, 23, 437. [Google Scholar] [CrossRef] [PubMed]
- Adolph, T.E.; Meyer, M.; Jukic, A.; Tilg, H. Heavy arch: From inflammatory bowel diseases to metabolic disorders. Gut 2024, 73, 1376–1387. [Google Scholar] [CrossRef] [PubMed]
- Sun, J.; Yan, C.; Wen, J.; Wang, F.; Wu, H.; Xu, F. Association between different obesity patterns and the risk of NAFLD detected by transient elastography: A cross-sectional study. BMC Gastroenterol. 2024, 24, 221. [Google Scholar] [CrossRef]
- Chen, J.; Zhou, H.; Liu, K. Normal weight and central obesity as predictors of increased all-cause mortality in metabolic dysfunction associated steatotic liver disease. J. Hepatol. 2024, 80, e143–e145. [Google Scholar] [CrossRef]
- Wu, Y.; Li, H.; Tao, X.; Fan, Y.; Gao, Q.; Yang, J. Optimised anthropometric indices as predictive screening tools for metabolic syndrome in adults: A cross-sectional study. BMJ Open 2021, 11, e043952. [Google Scholar] [CrossRef]
- Ramírez-Manent, J.I.; Jover, A.M.; Martinez, C.S.; Tomás-Gil, P.; Martí-Lliteras, P.; López-González, Á.A. Waist Circumference Is an Essential Factor in Predicting Insulin Resistance and Early Detection of Metabolic Syndrome in Adults. Nutrients 2023, 15, 257. [Google Scholar] [CrossRef]
- Özcabı, B.; Demirhan, S.; Akyol, M.; Öztürkmen Akay, H.; Güven, A. Lipid accumulation product is a predictor of nonalcoholic fatty liver disease in childhood obesity. Korean J. Pediatr. 2019, 62, 450–455. [Google Scholar] [CrossRef]
- Dai, H.; Wang, W.; Chen, R.; Chen, Z.; Lu, Y.; Yuan, H. Lipid accumulation product is a powerful tool to predict non-alcoholic fatty liver disease in Chinese adults. Nutr. Metab. 2017, 14, 49. [Google Scholar] [CrossRef]
- Yi, X.; Zhu, S.; Zhu, L. Diagnostic accuracy of the visceral adiposity index in patients with metabolic-associated fatty liver disease: A meta-analysis. Lipids Health Dis. 2022, 21, 28. [Google Scholar] [CrossRef]
- Zhao, Y.; He, Y.; Zhang, L.; Liu, J.; Bai, Y.; Wang, M.; Zheng, S. Effect of CVAI on the incidence of MASLD compared to BMI in populations with different body types: A prospective cohort study in China. Nutr. Metab. Cardiovasc. Dis. 2024, 34, 307–316. [Google Scholar] [CrossRef] [PubMed]
- Ma, X.; Ji, B.; Du, W.; Shi, S.; Zhao, H.; Sheng, J.; Jiang, X.; Ban, B.; Gao, G. METS-IR, a Novel Simple Insulin Resistance Index, is Associated with NAFLD in Patients with Type 2 Diabetes Mellitus. Diabetes Metab. Syndr. Obes. 2024, 17, 3481–3490. [Google Scholar] [CrossRef] [PubMed]
- Duan, M.; Zhao, X.; Li, S.; Miao, G.; Bai, L.; Zhang, Q.; Yang, W.; Zhao, X. Metabolic score for insulin resistance (METS-IR) predicts all-cause and cardiovascular mortality in the general population: Evidence from NHANES 2001–2018. Cardiovasc. Diabetol. 2024, 23, 243. [Google Scholar] [CrossRef]
- Lee, J.H.; Park, K.; Lee, H.S.; Park, H.K.; Han, J.H.; Ahn, S.B. The usefulness of metabolic score for insulin resistance for the prediction of incident non-alcoholic fatty liver disease in Korean adults. Clin. Mol. Hepatol. 2022, 28, 814–826. [Google Scholar] [CrossRef]
- Eslam, M.; Newsome, P.N.; Sarin, S.K.; Anstee, Q.M.; Targher, G.; Romero-Gomez, M.; Zelber-Sagi, S.; Wai-Sun Wong, V.; Dufour, J.F.; Schattenberg, J.M.; et al. A new definition for metabolic dysfunction-associated fatty liver disease: An international expert consensus statement. J. Hepatol. 2020, 73, 202–209. [Google Scholar] [CrossRef]
- Colantoni, A.; Bucci, T.; Cocomello, N.; Angelico, F.; Ettorre, E.; Pastori, D.; Lip, G.Y.H.; Del Ben, M.; Baratta, F. Lipid-based insulin-resistance markers predict cardiovascular events in metabolic dysfunction associated steatotic liver disease. Cardiovasc. Diabetol. 2024, 23, 175. [Google Scholar] [CrossRef] [PubMed]
- Wan, H.; Gui, Z.; Liu, L.; Wang, N.; Shen, J. Hs-CRP and HOMA-IR: Include them in the MASLD definition, or treat them as mediators between MASLD and atherosclerotic cardiovascular disease? J. Hepatol. 2025, 82, e26–e28. [Google Scholar] [CrossRef]
- Qiao, Y.; Wang, Y.; Chen, C.; Huang, Y.; Zhao, C. Association between triglyceride-glucose (TyG) related indices and cardiovascular diseases and mortality among individuals with metabolic dysfunction-associated steatotic liver disease: A cohort study of UK Biobank. Cardiovasc. Diabetol. 2025, 24, 12. [Google Scholar] [CrossRef]
- Martínez-Montoro, J.I.; Martínez-Sánchez, M.A.; Balaguer-Román, A.; Fernández-Ruiz, V.E.; Hernández-Barceló, J.E.; Ferrer-Gómez, M.; Frutos, M.D.; Núñez-Sánchez, M.Á.; Fernández-García, J.C.; Ramos-Molina, B. Triglyceride to HDL Cholesterol Ratio for the Identification of MASLD in Obesity: A Liver Biopsy-Based Case-Control Study. Nutrients 2024, 16, 1310. [Google Scholar] [CrossRef]
- Zou, Y.; Zhong, L.; Hu, C.; Zhong, M.; Peng, N.; Sheng, G. LDL/HDL cholesterol ratio is associated with new-onset NAFLD in Chinese non-obese people with normal lipids: A 5-year longitudinal cohort study. Lipids Health Dis. 2021, 20, 28. [Google Scholar] [CrossRef]
- Ferraz-Amaro, I.; Hernández-Camba, A.; Carrillo-Palau, M.; Hernández Álvarez-Buylla, N.; de Vera-González, A.; González-Delgado, A.; Heras-Recuero, E.; González-Gay, M.Á. Liver Fibrosis Index-4 Does Not Correlate to Liver Elastography in Patients with Inflammatory Bowel Disease. J. Clin. Med. 2024, 13, 6430. [Google Scholar] [CrossRef] [PubMed]
- De Vincentis, A.; Tavaglione, F.; Spagnuolo, R.; Pujia, R.; Tuccinardi, D.; Mascianà, G.; Picardi, A.; Antonelli Incalzi, R.; Valenti, L.; Romeo, S.; et al. Metabolic and genetic determinants for progression to severe liver disease in subjects with obesity from the UK Biobank. Int. J. Obes. 2022, 46, 486–493. [Google Scholar] [CrossRef] [PubMed]

| IBD-NAFLD (n = 14) | IBD-MASLD (n = 67) | IBD (n = 277) | p-Value | |
|---|---|---|---|---|
| Demographic and anthropometric | ||||
| Age (years) | 37 ± 15 | 52 ± 12 | 46 ± 16 | <0.001 |
| Male sex, n (%) | 13 (93) | 48 (72) | 151 (54) | <0.001 |
| Active smokers, n (%) | 0 | 4 (6) | 33 (12) | 0.154 |
| BMI (kg/m2) | 22 ± 2 | 27 ± 4 | 24 ± 4 | <0.001 |
| Waist circumference (cm) | 85 ± 4 | 100 ± 11 | 90 ± 11 | <0.001 |
| LAP | 18 ± 5 | 50 ± 29 | 31 ± 22 | <0.001 |
| VAI | 1 ± 0.2 | 2 ± 1 | 1 ± 1 | <0.001 |
| Disease characteristics | ||||
| Disease duration (years) | 16 ± 11 | 14 ± 11 | 12 ± 11 | 0.369 |
| Age at onset (years) | 22 ± 10 | 38 ± 15 | 34 ± 15 | <0.001 |
| Crohn’s disease, n (%) | 6 (43) | 22 (33) | 97 (35) | 0.772 |
| CD (Harvey–Bradshaw index) | 3 ± 2 | 5 ± 2 | 6 ± 3 | 0.092 |
| Ulcerative colitis, n (%) | 8 (57) | 45 (67) | 180 (65) | 0.772 |
| UC (full Mayo Score) | 2 ± 1 | 2 ± 1 | 3 ± 2 | 0.109 |
| Active disease, n (%) | 2 (14) | 18 (27) | 84 (30) | 0.396 |
| Extraintestinal manifestations, n (%) | 3 (21) | 13 (19) | 34 (12) | 0.228 |
| Mild steatosis, n (%) | 7 (50) | 37 (55) | - | <0.001 |
| Moderate steatosis, n (%) | 6 (42) | 23 (34) | - | |
| Severe steatosis, n (%) | 1 (7) | 7 (10) | - | |
| Surgery, n (%) | 2 (14) | 15 (22) | 44 (16) | 0.492 |
| CD disease location and phenotype, n (%) | ||||
| Ileal * | 4 (67) | 10 (45) | 57 (59) | 0.736 |
| Colonic * | 2 (33) | 4 (18) | 8 (9) | |
| Ileo-colonic * | 0 | 8 (36) | 31 (32) | |
| Upper GI * | 0 | 0 | 1 (1) | |
| Inflammatory * | 5 (83) | 7 (32) | 41 (42) | 0.075 |
| Fistulizing * | 1 (17) | 5 (23) | 32 (33) | |
| Stenosing * | 0 | 10 (45) | 24 (25) | |
| UC disease location, n (%) | ||||
| Proctitis * | 1 (12) | 3 (7) | 18 (10) | 0.992 |
| Proctosigmoiditis * | 2 (25) | 12 (27) | 46 (25) | |
| Left side * | 1 (12) | 9 (20) | 31 (17) | |
| Pancolitis * | 4 (50) | 21 (47) | 85 (47) | |
| Cardiometabolic comorbidities, n (%) | ||||
| T2DM | 0 | 9 (13) | 9 (3) | 0.002 |
| Hypertension | 0 | 24 (36) | 36 (13) | <0.001 |
| Dyslipidemia | 0 | 10 (15) | 23 (8) | 0.11 |
| IBD-NAFLD (n = 14) | IBD-MASLD (n = 67) | IBD (n = 277) | p-Value | |
|---|---|---|---|---|
| Laboratory parameters and scores (mean ± SD) | ||||
| ALT (UI/L) | 24 ± 9 | 27 ± 26 | 19 ± 11 | 0.001 |
| AST (UI/L) | 25 ± 9 | 23 ± 12 | 20 ± 13 | 0.017 |
| Total cholesterol (mg/dL) | 175 ± 20 | 173 ± 43 | 169 ± 43 | 0.320 |
| LDL (mg/dL) | 108 ± 23 | 110 ± 37 | 103 ± 37 | 0.106 |
| HDL (mg/dL) | 58 ± 12 | 49 ± 13 | 57 ± 15 | 0.021 |
| TG (mg/dL) | 82 ± 15 | 118 ± 52 | 95 ± 46 | <0.001 |
| Fasting blood glucose (mg/dL) | 87 ± 7 | 93 ± 21 | 86 ± 14 | <0.001 |
| Fasting insulinemia (mg/dL) | 7 ± 1 | 11 ± 8 | 8 ± 5 | <0.001 |
| CRP (mg/L) | 5 ± 3 | 7 ± 12 | 8 ± 12 | 0.442 |
| Platelets (×103/uL) | 289 ± 185 | 267 ± 123 | 250 ± 102 | 0.772 |
| Fecal calprotectin (mcg/gr) | 314 ± 457 | 403 ± 833 | 696 ± 1427 | 0.191 |
| HOMA-IR | 1.5 ± 0.4 | 3 ± 2 | 2 ± 1.5 | <0.001 |
| METS-IR | 31 ± 4 | 40 ± 8 | 33 ± 6 | <0.001 |
| TyG | 8 ± 0.2 | 8 ± 0.4 | 8 ± 0.5 | <0.001 |
| TG/HDL | 1.5 ± 0.5 | 3 ± 2 | 2 ± 1 | <0.001 |
| LDL/HDL | 2 ± 1 | 3 ± 1 | 2 ± 1 | <0.001 |
| FIB-4 | 1 ± 0.5 | 1 ± 0.5 | 1 ± 1 | 0.546 |
| Medications | ||||
| Salicylates, n (%) | 6 (43) | 37 (55) | 148 (53) | 0.700 |
| Azathioprine, n (%) | 1 (7) | 4 (6) | 37 (13) | 0.208 |
| >3 cycles of steroids, n (%) | 1 (7) | 6 (9) | 22 (8) | 0.955 |
| Biological therapy, n (%) | 7 (50) | 28 (42) | 101 (36) | 0.529 |
| Anti-TNF-α, n (%) | 6 (86) | 20 (71) | 65 (64) | 0.174 |
| Vedolizumab, n (%) | 1 (14) | 3 (11) | 26 (26) | 0.428 |
| Ustekinumab, n (%) | 0 | 5 (18) | 10 (10) | 0.268 |
| >1 Biological drug, n (%) | 0 | 6 (9) | 20 (7) | 0.501 |
| Current biological therapy duration (years) | 5 ± 3 | 3 ± 2 | 2 ± 2 | 0.209 |
| Total biological therapy duration (years) | 7 ± 2 | 4 ± 3 | 4 ± 4 | 0.507 |
| IBD-NAFLD (n = 14) | IBD-MASLD (n = 67) | IBD (n = 277) | IBD-NAFLD vs. IBD-MASLD p Value | IBD-NAFLD vs. IBD p Value | IBD-MASLD vs. IBD p Value | |
|---|---|---|---|---|---|---|
| Demographic and anthropometric | ||||||
| Age (years) | 37 ± 15 | 52 ± 12 | 46 ± 16 | <0.001 | 0.089 | <0.001 |
| BMI (kg/m2) | 22 ± 2 | 27 ± 4 | 24 ± 4 | <0.001 | 0.096 | <0.001 |
| Waist circumference (cm) | 85 ± 4 | 100 ± 11 | 90 ± 11 | <0.001 | 0.110 | <0.001 |
| LAP | 18 ± 5 | 50 ± 29 | 31 ± 22 | <0.001 | 0.179 | <0.001 |
| VAI | 0.9 ± 0.2 | 2 ± 1 | 1 ± 1 | 0.005 | 0.286 | <0.001 |
| Disease characteristics | ||||||
| Disease duration (years) | 16 ± 11 | 14 ± 11 | 12 ± 11 | 0.875 | 0.431 | 0.214 |
| Age at onset (years) | 22 ± 10 | 38 ± 15 | 34 ± 15 | <0.001 | 0.025 | 0.001 |
| CD (Harvey–Bradshaw index) | 3 ± 2 | 5 ± 2 | 6 ± 3 | 0.175 | 0.041 | 0.323 |
| UC (full Mayo Score) | 2 ± 1 | 2 ± 1 | 3 ± 2 | 0.315 | 0.088 | 0.165 |
| Laboratory parameters and scores | ||||||
| ALT (UI/L) | 24 ± 9 | 27 ± 26 | 19 ± 11 | 0.963 | 0.088 | <0.001 |
| AST (UI/L) | 25 ± 9 | 23 ± 12 | 20 ± 13 | 0.667 | 0.093 | 0.014 |
| Total cholesterol (mg/dL) | 175 ± 20 | 173 ± 43 | 169 ± 43 | 0.992 | 0.481 | 0.163 |
| LDL (mg/dL) | 108 ± 23 | 110 ± 37 | 103 ± 37 | 0.741 | 0.502 | 0.039 |
| HDL (mg/dL) | 58 ± 12 | 49 ± 13 | 57 ± 15 | 0.171 | 0.922 | 0.006 |
| TG (mg/dL) | 82 ± 15 | 118 ± 52 | 95 ± 46 | 0.048 | 0.988 | <0.001 |
| Fasting blood glucose (mg/dL) | 87 ± 7 | 93 ± 21 | 86 ± 14 | 0.248 | 0.444 | <0.001 |
| Fasting insulinemia (mg/dL) | 7 ± 1 | 11 ± 8 | 8 ± 5 | 0.068 | 0.557 | <0.001 |
| CRP (mg/L) | 5 ± 3 | 7 ± 12 | 8 ± 12 | 0.886 | 0.768 | 0.908 |
| Platelets (×103/uL) | 289 ± 185 | 267 ± 123 | 250 ± 102 | 0.943 | 0.790 | 0.489 |
| Fecal calprotectin (mcg/gr) | 314 ± 457 | 403 ± 833 | 696 ± 1427 | 0.920 | 0.354 | 0.099 |
| HOMA-IR | 1.5 ± 0.4 | 3 ± 2 | 2 ± 1.5 | 0.139 | 0.441 | <0.001 |
| METS-IR | 31 ± 4 | 40 ± 8 | 33 ± 6 | <0.001 | 0.409 | <0.001 |
| TyG | 8 ± 0.2 | 8 ± 0.4 | 8 ± 0.5 | 0.063 | 0.928 | <0.001 |
| TG/HDL | 1.5 ± 0.5 | 3 ± 2 | 2 ± 1 | 0.028 | 0.909 | <0.001 |
| LDL/HDL | 2 ± 1 | 3 ± 1 | 2 ± 1 | 0.265 | 0.105 | <0.001 |
| FIB-4 | 1 ± 0.5 | 1 ± 0.5 | 1 ± 1 | 0.548 | 0.704 | 0.769 |
| Medications | ||||||
| Current biological therapy duration (years) | 5 ± 3 | 3 ± 2 | 2 ± 2 | 0.733 | 0.532 | 0.086 |
| Total biological therapy duration (years) | 7 ± 2 | 4 ± 3 | 4 ± 4 | 0.736 | 0.762 | 0.248 |
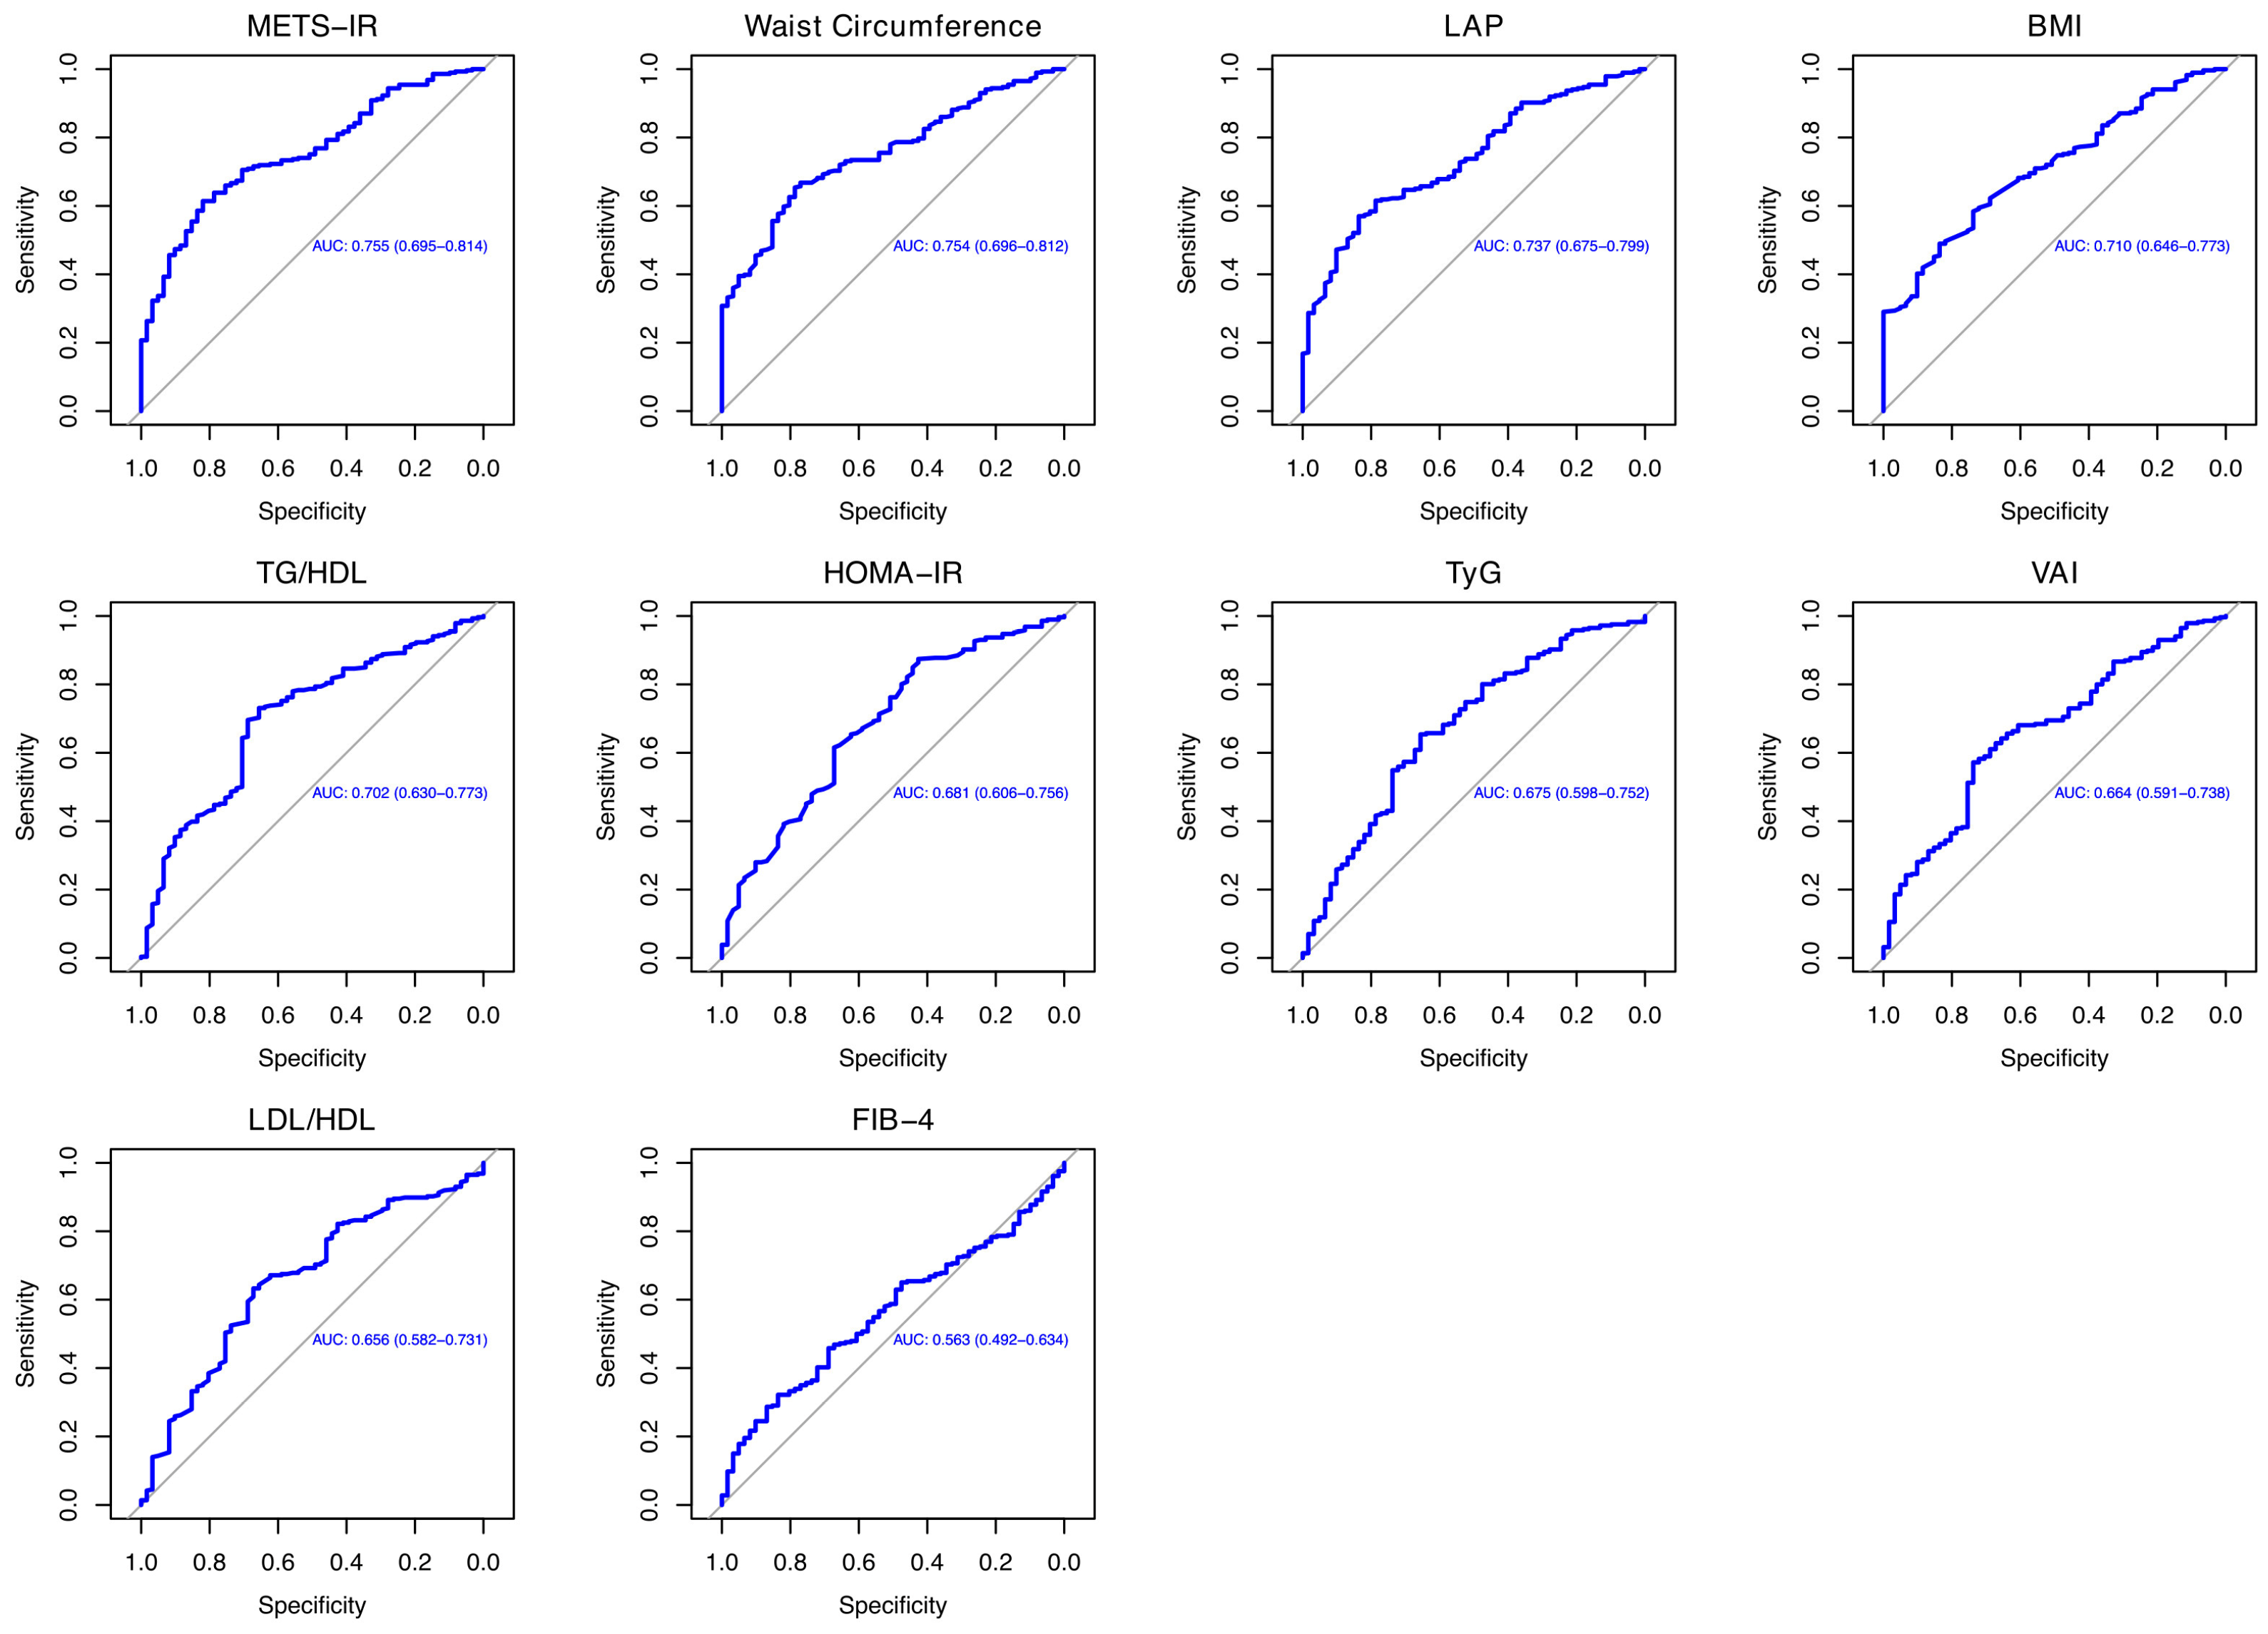
| Variable | AUC (95% CI) | Sensitivity | Specificity | Cut-Off |
|---|---|---|---|---|
| METS-IR | 0.754 (0.694–0.814) | 70.5% | 70.4% | 36.52 |
| Waist circumference (cm) | 0.754 (0.696–0.811) | 66.7% | 77% | 93.55 |
| LAP | 0.737 (0.675–0.798) | 61.5% | 78.6% | 29.8 |
| BMI (kg/m2) | 0.709 (0.646–0.773) | 62.2% | 68.8% | 24.99 |
| TG/HDL | 0.701 (0.630–0.773) | 69.5% | 68.8% | 1.91 |
| HOMA-IR | 0.680 (0.605–0.755) | 61.5% | 67.2% | 1.65 |
| TyG | 0.674 (0.598–0.751) | 65.3% | 65.5% | 8.33 |
| VAI | 0.664 (0.590–0.737) | 62.8% | 67.2% | 1.22 |
| LDL/HDL | 0.656 (0.581–0.730) | 63.2% | 67.2% | 1.96 |
| FIB-4 | 0.562 (0.491–0.634) | 46.8% | 67.2% | 10.8 |
Disclaimer/Publisher’s Note: The statements, opinions and data contained in all publications are solely those of the individual author(s) and contributor(s) and not of MDPI and/or the editor(s). MDPI and/or the editor(s) disclaim responsibility for any injury to people or property resulting from any ideas, methods, instructions or products referred to in the content. |
© 2025 by the authors. Licensee MDPI, Basel, Switzerland. This article is an open access article distributed under the terms and conditions of the Creative Commons Attribution (CC BY) license (https://creativecommons.org/licenses/by/4.0/).
Share and Cite
Abenavoli, L.; Scarlata, G.G.M.; Borelli, M.; Suraci, E.; Marasco, R.; Imeneo, M.; Spagnuolo, R.; Luzza, F. Use of Metabolic Scores and Lipid Ratios to Predict Metabolic Dysfunction-Associated Steatotic Liver Disease Onset in Patients with Inflammatory Bowel Diseases. J. Clin. Med. 2025, 14, 2973. https://doi.org/10.3390/jcm14092973
Abenavoli L, Scarlata GGM, Borelli M, Suraci E, Marasco R, Imeneo M, Spagnuolo R, Luzza F. Use of Metabolic Scores and Lipid Ratios to Predict Metabolic Dysfunction-Associated Steatotic Liver Disease Onset in Patients with Inflammatory Bowel Diseases. Journal of Clinical Medicine. 2025; 14(9):2973. https://doi.org/10.3390/jcm14092973
Chicago/Turabian StyleAbenavoli, Ludovico, Giuseppe Guido Maria Scarlata, Massimo Borelli, Evelina Suraci, Raffaella Marasco, Maria Imeneo, Rocco Spagnuolo, and Francesco Luzza. 2025. "Use of Metabolic Scores and Lipid Ratios to Predict Metabolic Dysfunction-Associated Steatotic Liver Disease Onset in Patients with Inflammatory Bowel Diseases" Journal of Clinical Medicine 14, no. 9: 2973. https://doi.org/10.3390/jcm14092973
APA StyleAbenavoli, L., Scarlata, G. G. M., Borelli, M., Suraci, E., Marasco, R., Imeneo, M., Spagnuolo, R., & Luzza, F. (2025). Use of Metabolic Scores and Lipid Ratios to Predict Metabolic Dysfunction-Associated Steatotic Liver Disease Onset in Patients with Inflammatory Bowel Diseases. Journal of Clinical Medicine, 14(9), 2973. https://doi.org/10.3390/jcm14092973