Article

Intra-Individual Differences of the Femoral Cortical Thickness Index in Elderly Patients with a Proximal Femoral Fracture

1
Medical School, University of Zürich, 8006 Zürich, Switzerland
2
Clinic for Orthopaedics, Hand Surgery and Trauma Surgery, Stadtspital Zürich, Tièchestrasse 99, 8037 Zürich, Switzerland
*
Author to whom correspondence should be addressed.
J. Clin. Med. 2025, 14(8), 2654; https://doi.org/10.3390/jcm14082654
Submission received: 20 March 2025 / Revised: 9 April 2025 / Accepted: 11 April 2025 / Published: 12 April 2025
(This article belongs to the Section Orthopedics)

Abstract

:
Background/Objectives: Osteoporosis is prevalent in the elderly and increases fracture risk. Bone density is commonly assessed using dual-energy X-ray absorptiometry (DEXA). The femoral cortical thickness index (CTI) also provides indirect information for osteoporosis. It remains unclear whether there are intra-individual differences and if a correlation to fracture risk of the CTI in fractured femora results due to fracture related malrotation during X-rays. The aim of this study was to investigate the individual bilateral CTI in patients with proximal femoral fractures. Methods: A retrospective analysis of 200 surgically treated patients (100 trochanteric, 100 femoral neck fractures) was performed. Measurements included the bilateral CTI at 10 and 15 cm below the lesser trochanter. Analysis of the correlation of those examinations, in comparison to the contralateral CTI at 15 cm, and correlation of the CTI with the body mass index (BMI) and age was performed. Results: Results showed significant differences (p < 0.001) in bilateral CTIs for both fracture types at 15 cm with a strong inter-rater reliability (ICC > 0.9). There was no significant correlation between age and CTI, as well as BMI and CTI in both cohorts (p > 0.1). Sex-specific subgroup analyses revealed that females exhibited significant differences in CTI between fractured and non-fractured sides (p < 0.001). Conclusions: In conclusion, CTI, and the modified CTI at 15 cm below the lesser trochanter in fractured proximal femora, is lower compared to the non-fractured side. The femoral CTI could help in daily clinical routines and circumstances, where more detailed risk prediction tools are lacking.

1. Introduction

With increasing age, diminishing bone mineral density (BMD) results in osteoporosis. This osseus disease pattern is a condition defined by the World Health Organization (WHO) as a BMD-T-score more than 2.5 standard deviations (SD) below the population mean of young adults, typically assessed via dual-energy X-ray absorptiometry (DEXA) [1,2,3]. Osteoporosis affects around 19.7% of the global population, with higher prevalence in developing countries [4]. As the population ages, the number of affected individuals increases. In the US, the number of over 50-year-old individuals was estimated to reach 71 million by 2030 [5].
This is, continuously, a major issue, as osteoporotic fractures represent the most severe consequence of the disease and pose a major economic burden. In the United States, the annual financial burden exceeds 20 billion USD, with hip fractures accounting for the largest proportion of these costs, primarily due to prolonged hospitalization and rehabilitation requirements [6,7,8]. Hip fractures represent the most severe form of osteoporotic fractures. The majority of hip fractures require hospitalization, and up to 20% of patients die within the first year following the fracture, primarily due to severe underlying medical conditions [9,10]. Hip fractures frequently result in a loss of independence, the necessity of institutionalization, and an elevated risk of subsequent fractures [11].
The risk of fractures due to low-energy trauma and falls increases with age, making osteoporosis a significant burden on healthcare [3,5,12,13,14]. Common osteoporotic fractures include those of the hip, vertebrae, and distal radius [4,12], with case numbers increasing significantly worldwide [12,13,15,16]. These are just some of the reasons why prevention strategies are important.
DEXA measurements remain the gold standard for BMD assessment. However, this measuring modality is not universally available, particularly in emergency or resource-limited settings, and involves additional costs, radiation exposure, and time, whereas X-rays are routine, fast, and low-cost examinations [17,18]. The relationship between various plain radiological parameters and BMD has previously been investigated, including the femoral cortical thickness index (CTI) [19,20,21,22]. The CTI has shown moderate to strong correlation with BMD T-scores and has potential to aid in the identification of local osteoporosis in elderly and postmenopausal populations [21,22,23]. Patient cohorts with femoral fractures were frequently examined, whereas a great heterogeneity regarding the measured side was observed. Previous studies focused on the examination of the fractured femur, which is commonly malrotated in post-traumatic X-rays and, therefore, may lead to distorted measuring results. Until today, it remains uncertain whether there are bilateral intra-individual differences of the CTI in patients suffering a proximal femoral fracture [23,24,25,26]. Measurements of the CTI on post-operative X-rays may be incorrect due to surgical procedures such as endomedullary reaming or implantation of nails, which could potentially modify the cortical thickness [27].
In this retrospective study, the primary objective was to determine whether the contralateral non-fractured femur may serve as a reliable site for estimating bone quality by using the previously established measurement of the CTI. The secondary objective was to evaluate whether CTI measurements correspond with established risk factors for osteoporosis, such as age, sex, or body mass index (BMI). We hypothesized that CTI values differ significantly between non-fractured and fractured femoral bones, and that measurements on the non-fractured side reflect baseline bone status more accurately.

2. Materials and Methods

A retrospective analysis was conducted on 200 patients who underwent surgical treatment for proximal femoral fractures (100 trochanteric fractures and 100 femoral neck fractures) between June 2022 and April 2024 at the City Hospital Zurich. Inclusion criteria were as follows: a minimum age of 60 years of age at the time of fracture occurrence, presence of a unilateral proximal femoral fracture (trochanteric or femoral neck), lack of evidence for a pathological fracture, absence of previous surgery on the non-fractured contralateral femur, a complete set of radiographs (pre- and post-operative anteroposterior (ap) pelvis) with correct patient positioning, and the presence of informed consent. Patients not meeting the aforementioned criteria were excluded. Figure 1 shows a flowchart of the patient selection process. Approval of the local ethics committee was given (BASEC number 2024-00290). Patient demographics, previous fractures, and surgical history were extracted from the hospital’s electronic medical record (KISIM, Cistec AG, Zurich, Switzerland). All data were reviewed retrospectively as part of the study design.

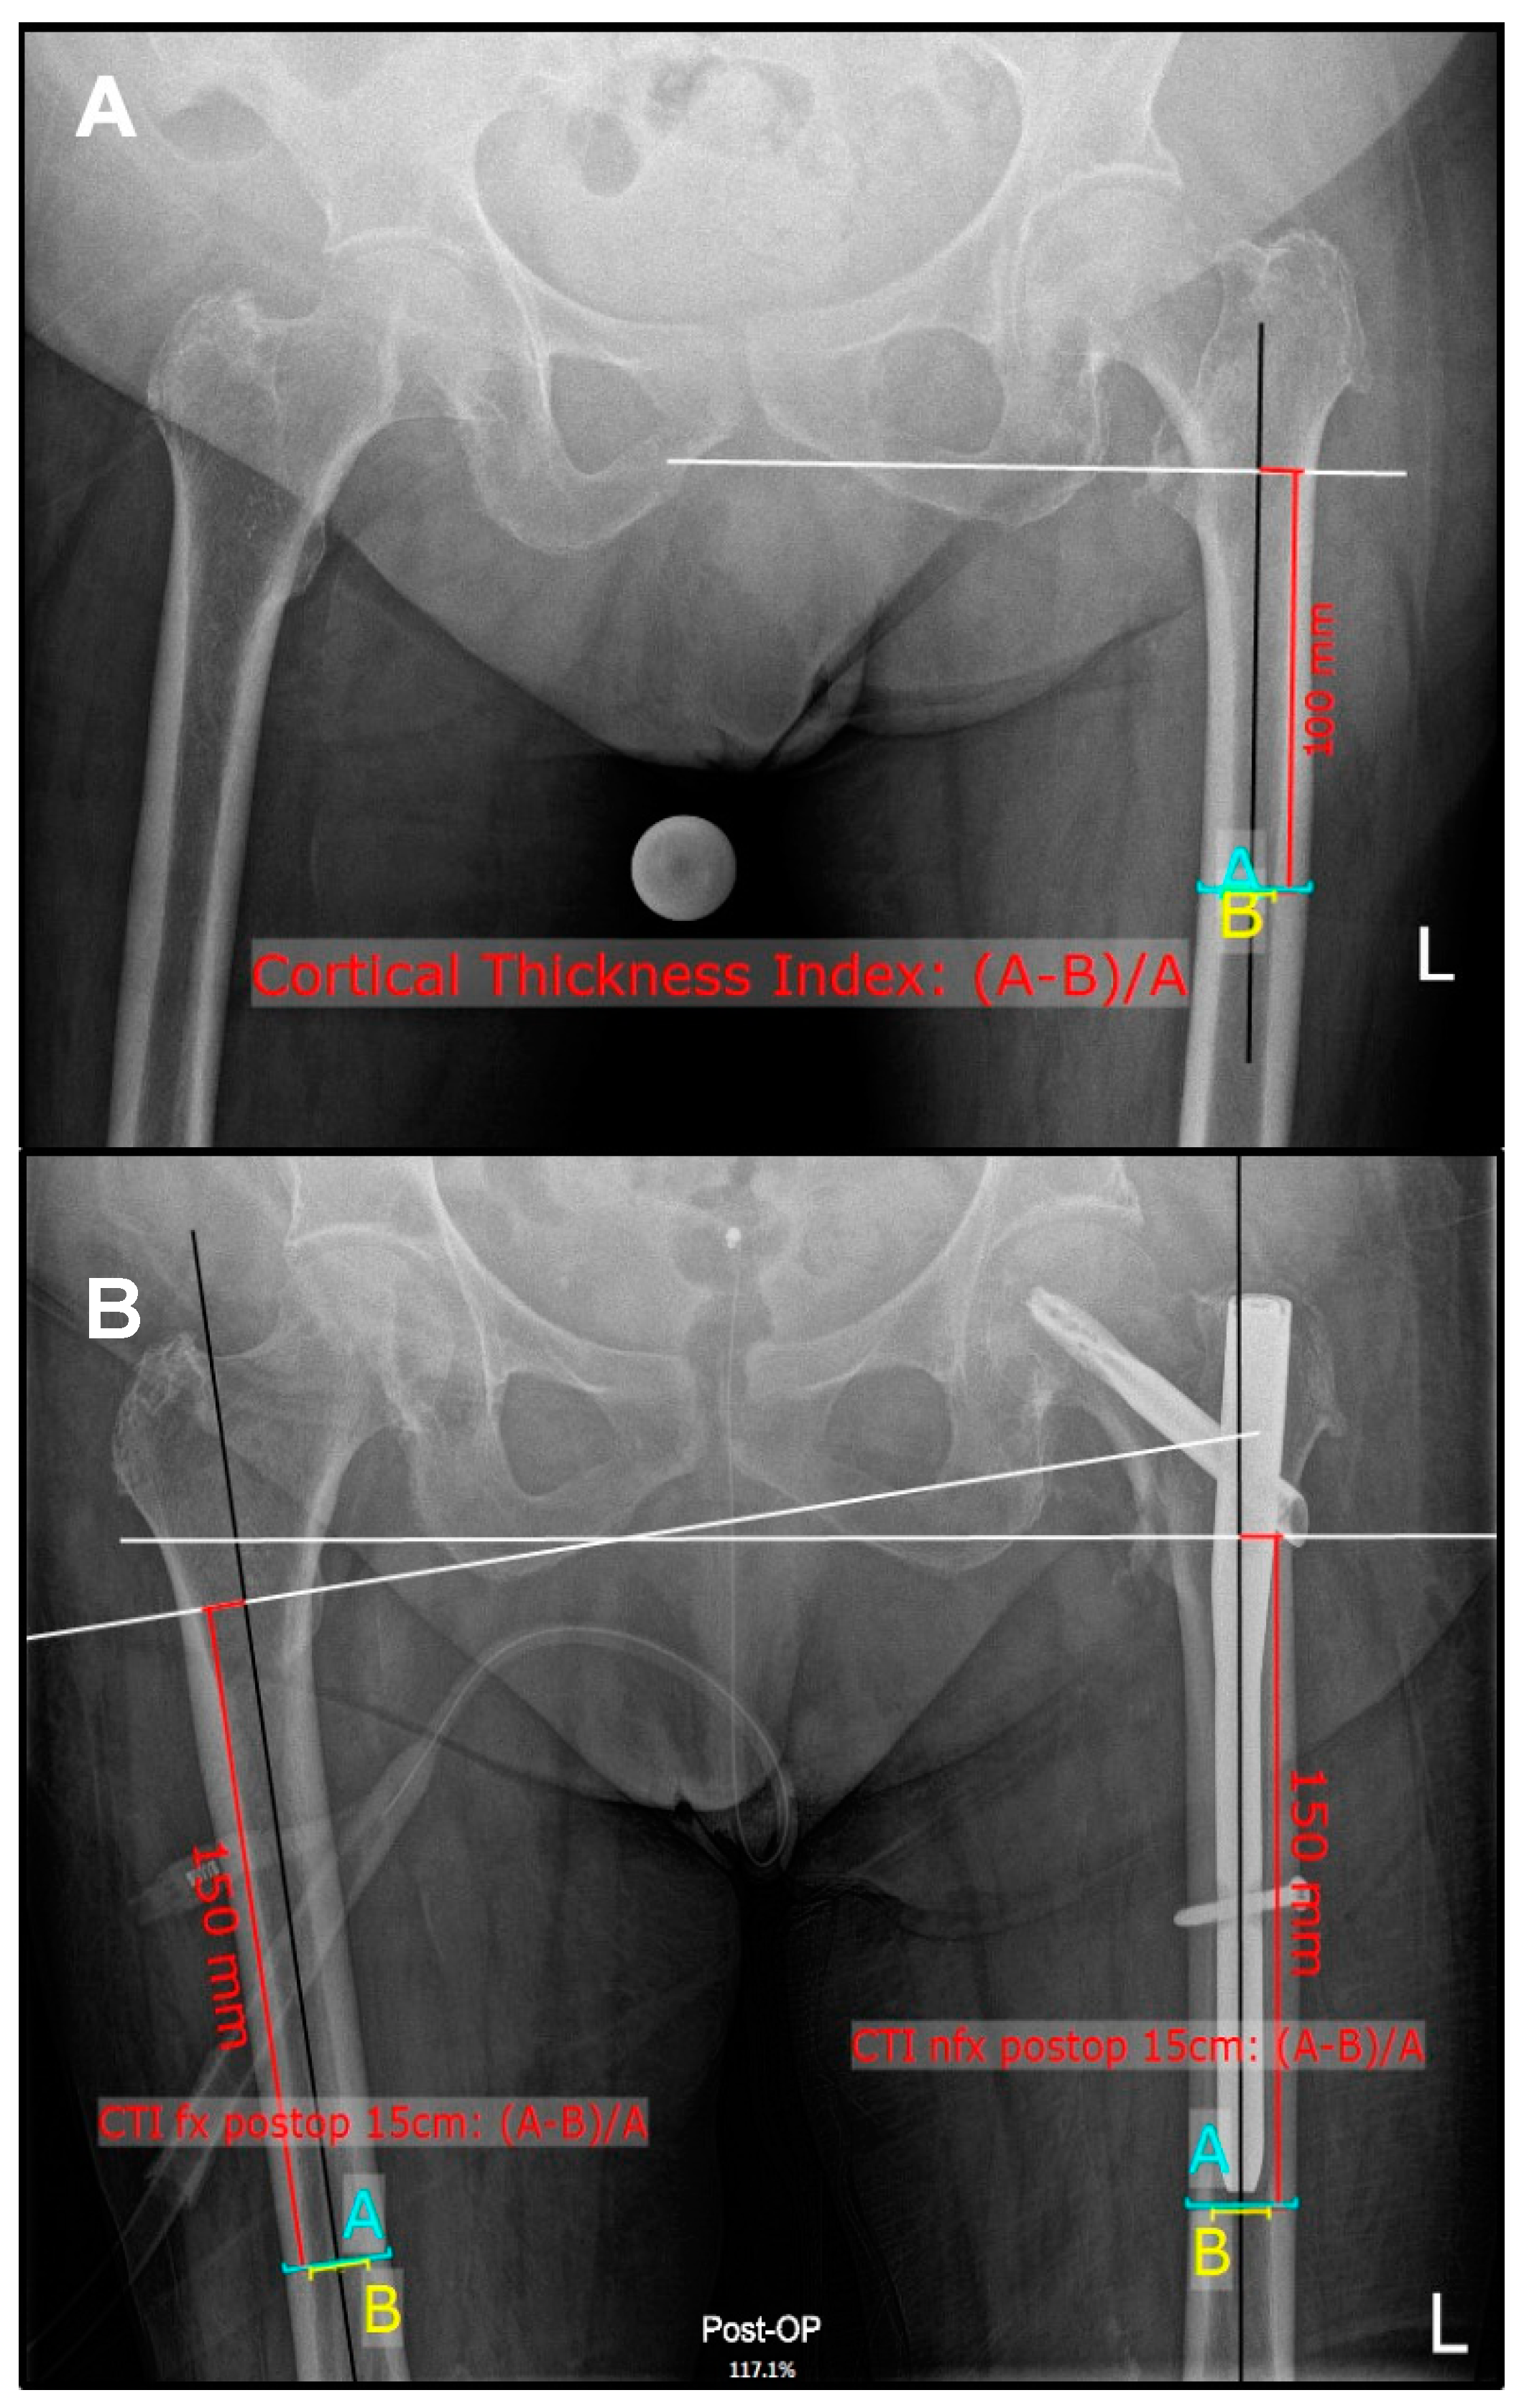
2.1. Radiographic Measurements

The decision was made to solely measure CTI in the anteroposterior projection. As demonstrated in previous studies, ap radiographs have been shown to exhibit higher levels of reproducibility when comparing them with lateral images [26]. In the same study, a significant correlation between the CTI on ap radiographic imaging and BMD assessments were obtained; however, these parameters were not observed in the lateral measurements. The radiology assistant positioned the patient supine with both legs internally rotated (15°) if technically possible. The X-ray was centered on the symphysis pubis. All measurements were performed using mediCAD clinical software Version 6.5 (mediCAD Hectec GmbH, Altdorf, Germany). The outer (A) and inner (B) diameter of the diaphysis ten centimeters below the most prominent point of the lesser trochanter were measured, according to Dorr et al. (Figure 2A) [19], to calculate the CTI (CTI = (A − B)/A). Analysis of the non-fractured contralateral femur was performed on the pre-operative anteroposterior radiograph of the pelvis on the unaffected side for both fracture cohorts. To avoid measurement interference with femoral implants (prosthesis, endomedullary nail) or iatrogenic altered cortical thickness (e.g., through endomedullary reaming) a modified CTI was assessed at 15 cm below the lesser trochanter bilaterally in the post-operative radiograph (Figure 2B). All measurements were carried out by two blinded, independent observers with different levels of experience (orthopedic consultant, medical student) (M.K., F.G.) to assure interobserver reliability. Both observers have previously been trained in measuring the femoral CTI.

2.2. Statistical Analysis

An a priori power analysis estimated a number of 100 patients from each group to detect a difference in a small effect size of d = 0.2 using Cohen’s (1988) [28] criteria with a power of 80% and an α of 0.05 using G*Power tool (version 3.1; Universität Düsseldorf Germany). The patients’ clinical features were determined using descriptive statistics. Shapiro–Wilk test was used to evaluate all data for normality distribution. For normally distributed data we used a paired t-test, and for non-normally distributed data we used the Wilcoxon signed-rank test to compare the fractured proximal femora with the contralateral uninjured side. To compare continuous variables of the two fracture groups, we used an independent t-test (normal distribution) and the Mann–Whitney U test (non-normal distribution). To assess the relationship between radiographic measurements, Pearson’s correlation was used. According to Cohen’s assessment, a correlation of r > 0.5 is considered strong, an r value of 0.5–0.3 is considered moderate, and an r value of r < 0.3 is considered weak [28]. Statistical analysis was carried out using SPSS for Mac (version 23.0, SPSS Inc., Chicago, IL, USA). The level of significance was set at p < 0.05. A subgroup analysis with regards to age, gender, and BMI, with those measures being of relevance concerning the change of BMD, was conducted.

3. Results

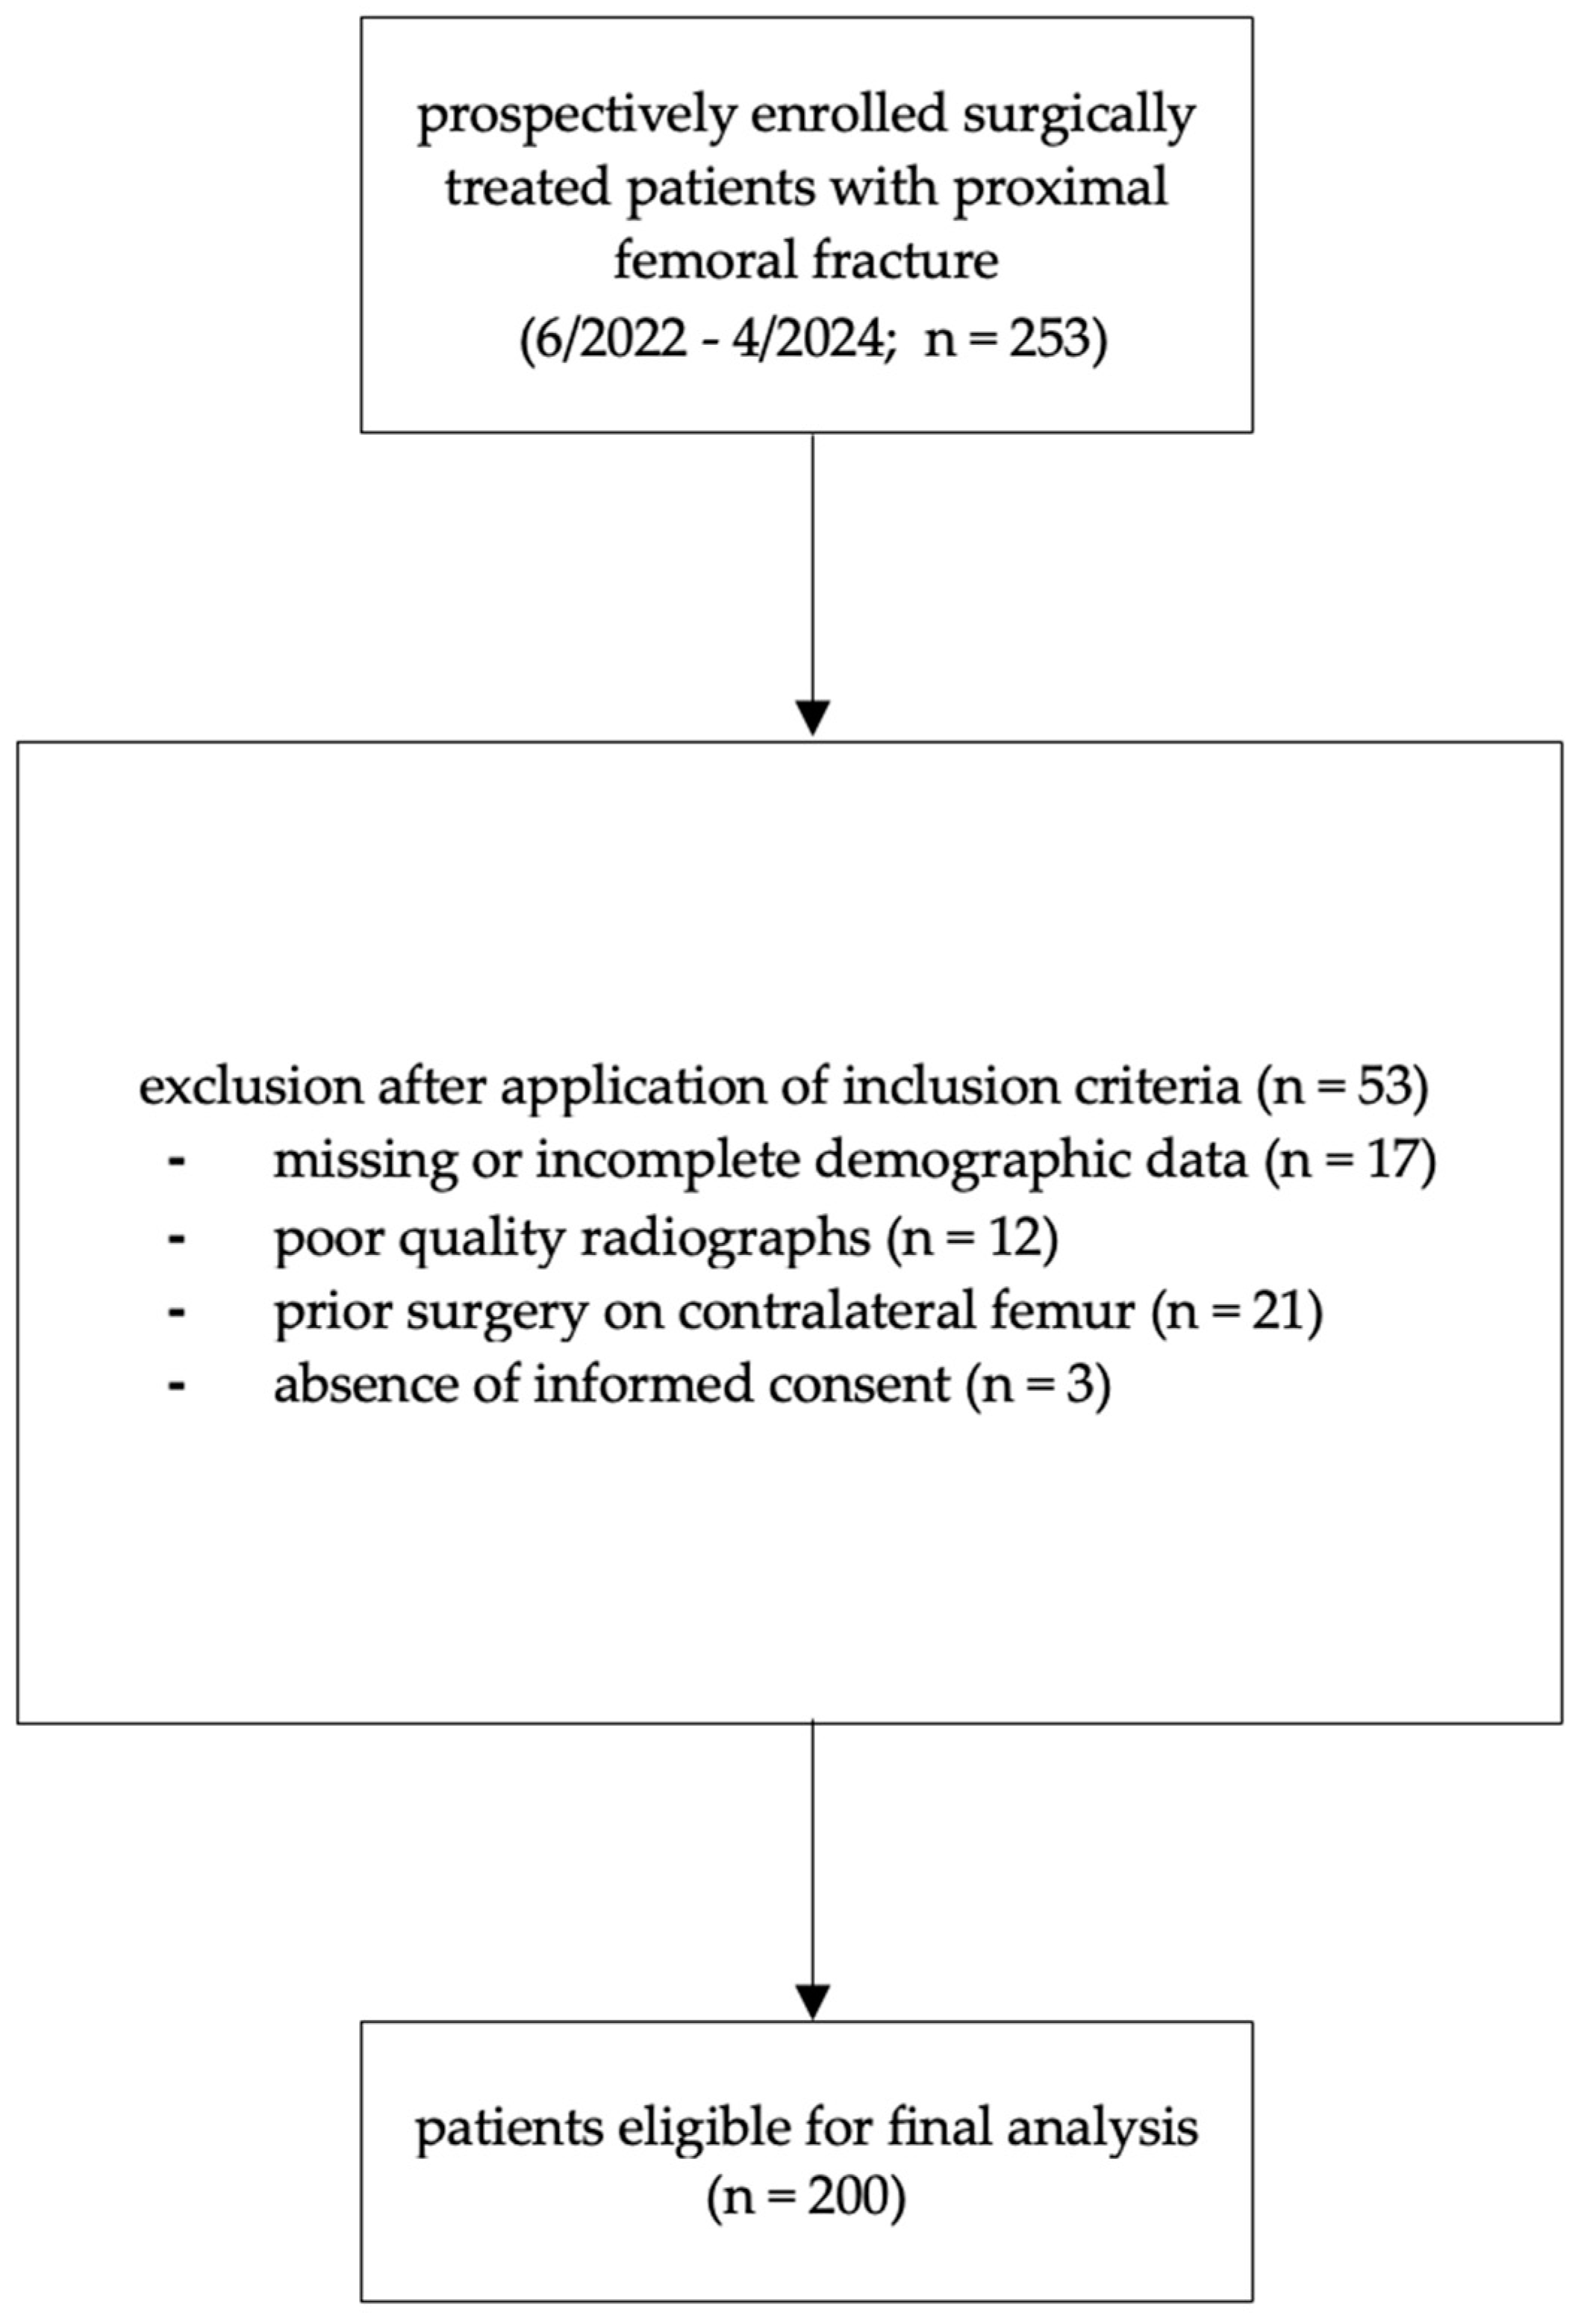
3.1. Patient Demographics

For the final analysis, 100 patients of each fracture type (trochanteric, femoral neck) were included. The overall mean age was 84, ranging from 60 to 101 years. The majority of the patients were female (72%) The group-specific distribution of demographic data is shown in Table 1.

3.2. Inter-Rater Reliability

The mean inter-rater reliability for the measurements on a height of 15 cm below the lesser trochanter was excellent, with an ICC of >0.9, where an ICC > 0.8 is considered almost perfect and an ICC between 0.8 and 0.6 is considered substantial, according to Landis and Koch [29]. In the group with a trochanteric f fracture, the ICC on the non-fractured side was 0.916 (95%CI: 0.857–0.948), and 0.937 (95%CI: 0.896–0.960) on the fractured side, respectively. For the femoral neck cohort, the ICC on the non-fractured and fractured side was 0.928 (95%CI: 0.869–0.958) and 0.912 (95%CI: 0.848–0.946), respectively. All measurements showed a significance of p < 0.001.

3.3. Comparison of CTI Within the Subgroups

In both groups, a strong correlation between the CTI at 10 cm and 15 cm below the lesser trochanter was observed (Table 2).
Furthermore, there was a significant difference in the CTI measured 15 cm below the trochanter minor (Table 3).

3.4. Correlations Between CTI and Age at Surgery and BMI

When examining the relationship between age and CTI, no statistically significant correlation in both cohorts, on the non-fractured and fractured sides (femoral neck fracture: r = −0.095, p = 0.347, resp. r = −0.187, p = 0.062; trochanteric fracture: r = −0.151, p = 0.134, resp. r = −0.127, p = 0.208) were detected. Comparing the BMI with the CTI, no correlations for the fractured and non-fractured sides in the trochanteric fracture (fractured: r = −0.023, p = 0.821; non-fractured: r = −0.010, p = 926) or femoral neck fracture cohorts (fractured: r = −0.006, p = 0.951; non-fractured: r = 0.112, p = 0.265) were observed.

3.5. Sex-Specific Differences Within the Subgroups

Concerning the subgroup analysis, there was a strong correlation between CTI values at 10 and 15 cm in females in the non-fractured contralateral femur (r > 0.7, p < 0.001). When comparing the CTI at 15 cm of the fractured and non-fractured contralateral side, significant differences in all subgroups were found (p ≤ 0.001). Males presented an exception, with a femoral neck fracture that demonstrated a trend towards lower CTI on the fractured side (p = 0.83). Detailed data can be found in Table 4 and Table 5.

4. Discussion

The main finding of the present study is that the CTI 10 centimeters below the mid lesser trochanteric line strongly correlated to the modified CTI at 15 cm in the non-fractured contralateral proximal femora in a cohort of elderly patients with a proximal femoral fracture. Secondly, the modified femoral cortical thickness index fifteen centimeters below the lesser trochanter differs significantly when comparing the fractured side with the non-fractured contralateral femur.
Former studies showed the CTI being significantly lower in patients diagnosed with osteoporosis using DEXA. Additionally, a positive correlation between the CTI and BMD was observed [20,24]. Those correlations were found in patients without a hip fracture. Sah et al. described a positive correlation (r = 0.5814, p = 0.0005) between the CTI and T-scores in anteroposterior radiographs for osteoarthritic females [21]. Ilyas et al. observed a strong correlation (r = 0.632, p < 0.001) between those two measuring modalities in over 50-year-old females without a hip fracture [22]. Using this knowledge, the CTI and other plain radiological measures of the proximal femur could potentially be a helpful tool to assess the risk for hip fractures [30,31].
However, a certain inhomogeneity regarding the analyzed cohort, or the measurement of CTI and BMD exists. Faundez et al. previously showed a moderate correlation between CTI and BMD in over 45-year-old patients without a hip fracture [25]. Nguyen et al. found the femoral neck BMD to have a significant positive correlation (male r = 0.4, female r = 0.52, p < 0.001) with the CTI in anteroposterior radiographs, although they did not observe actual fracture incidence in their study population [23]. In contrast, another study observed the CTI in hip fracture patients to be correlated to the BMD at the femoral neck, finding no correlation to overall BMD [26]. In patients with a unilateral hip fracture, the CTI was found to be helpful in predicting proximal femoral fractures in the contralateral hip [32,33].
Moreover, in various studies, the presence or absence of a fracture was somehow neglected. Several authors measured the CTI in a cohort of non-fractured patients [21,22,25], whereas others observed the CTI in the contralateral uninjured femur of a fracture cohort [26]. Further groups determined the CTI in the contralateral, initially non-fractured side [32,33], and in certain studies it remained unclear on which side the CTI was measured [23,34].
Furthermore, a vast majority of previous studies neglected the fact that fractured femora can be associated with malrotation on radiographs and, therefore, create a different anteroposterior CTI [35,36,37]. Additionally, post-operative radiographs of fractured femora could potentially show altered CTI values due to mechanical medullary preparation (reaming in intramedullary nailing and femoral preparation with rasps in arthroplasty). Those are two potential sources of measuring errors which the present study overcame with the initial comparison of the CTI at 10 and 15 cm below the lesser trochanter, and the secondary measurement of the CTI in post-operative radiographs at 15 cm, where a pain-induced malrotation of the femur was ruled out. The current study shows that the CTI of both sides are significantly different and, therefore, the use of the CTI of the non-fractured contralateral femur to predict fracture risk must be questioned.
Similar to the CTI at 10 centimeters, the CTI at 15 cm showed good to excellent inter-rater reliability. This is consistent with the findings of the good to excellent inter-rater and intra-rater reliability amongst conventional radiological parameters of the proximal femur of previous studies [23,25,26,32,38]. As a reliable method, the CTI could be used as a simple evaluation of patients at risk for a proximal femur fracture as DEXA measuring modality is not universally available, includes additional costs, time, and effort, whereas X-rays are routine examinations [12]. Furthermore, DEXA measurements of the hip have significant limitations for predicting osteoporotic fractures, such as the need for strict quality standards, operator dependency, low resolution, and an inability to directly image bone microstructure [20,39,40].
Looking at the subgroup analyses for both sex-specific differences, the two CTI values at a height of 15 and 10 centimeters on the non-fractured contralateral side strongly correlated with each other. Therefore, a comparison of the CTI at 15 cm within both fracture groups with that of the respective opposite side was performed. A significant difference was found in most groups, except for males with a femoral neck fracture, likely due to the small sample size.
Moreover, no correlation between age and CTI was shown, for both the fractured and the non-fractured side in both cohorts. This issue might have been due to the CTI not being informative enough to show inverse correlations between BMD and age, as other studies have found in the past with DEXA measurements [20]. Again, other studies in the past have found correlations between age and cortical thickness, although their results focused on the femoral shaft or distal femur, and other measurement methods to examine cortical thickness were used [41,42].
The current results regarding BMI and CTI were not as expected, mostly showing insignificant weak inverse correlations, while other studies have found a positive correlation between BMI and cortical thickness [43,44]. This issue might have been due to the current smaller sample size, or measurement angle of the CTI, as there is no literature yet about CTI measurements at a height of 15 cm distal to the mid lesser trochanteric line.
This study has certain limitations: besides its retrospective design, the study contained a rather small sample size. Furthermore, no comparison of BMD measured by DEXA and CTI was conducted. Moreover, a comparison with a cohort of non-fractured patients was lacking. However, a recent study showed that the CTI of non-affected individuals did not show intra-individual differences when comparing both femora [38].

5. Conclusions

In conclusion, the CTI and modified CTI at 15 cm below the lesser trochanter in the fractured proximal femora are lower compared to the non-fractured contralateral side. The femoral CTI could help in daily clinical routine and circumstances, where more detailed risk prediction tools are lacking, in order to predict fracture risk in elderly patients. Furthermore, it may be used for the detection of local osteoporosis.

Author Contributions

Conceptualization, M.K. and M.D.; methodology, M.K., M.W. and M.D.; validation, M.K. and M.W.; formal analysis, M.K. and F.G.; investigation, F.G. and M.K.; writing—original draft preparation, F.G., M.K. and M.W.; writing—review and editing, F.G., M.K. and M.D.; visualization, F.G. and M.K.; supervision, M.K., M.W. and M.D.; project administration, M.K. All authors have read and agreed to the published version of the manuscript.

Funding

This research received no external funding.

Institutional Review Board Statement

Approval was granted by the local ethics committee (Cantonal Ethics Committee Zurich (BASEC-Nr. 2024-00290, 12.04.2024). All procedures performed in studies involving human participants were in accordance with the ethical standards of the institutional and/or national research committee and with the 1964 Helsinki declaration and its later amendments or comparable ethical standards.

Informed Consent Statement

Informed consent was obtained from all subjects involved in the study.

Data Availability Statement

The datasets presented in this article are not readily available because of ongoing studies. Requests to access the datasets should be directed to the corresponding author.

Conflicts of Interest

The authors declare no conflicts of interest.

References

  1. WHO. Consensus development conference: Diagnosis, prophylaxis, and treatment of osteoporosis. Am. J. Med. 1993, 94, 646–650. [Google Scholar] [CrossRef]
  2. NIH. Consensus Development Panel on Osteoporosis Prevention, Diagnosis, and Therapy. JAMA 2001, 285, 785–795. [Google Scholar] [CrossRef]
  3. Reginster, J.-Y.; Burlet, N. Osteoporosis: A still increasing prevalence. Bone 2006, 38, 4–9. [Google Scholar] [CrossRef]
  4. Xiao, P.-L.; Cui, A.-Y.; Hsu, C.-J.; Peng, R.; Jiang, N.; Xu, X.-H.; Ma, Y.-G.; Liu, D.; Lu, H.-D. Global, regional prevalence, and risk factors of osteoporosis according to the World Health Organization diagnostic criteria: A systematic review and meta-analysis. Osteoporos. Int. 2002, 33, 2137–2153. [Google Scholar] [CrossRef]
  5. Wright, N.C.; Looker, A.C.; Saag, K.G.; Curtis, J.R.; Delzell, E.S.; Randall, S.; Dawson-Hughes, B. The Recent Prevalence of Osteoporosis and Low Bone Mass in the United States Based on Bone Mineral Density at the Femoral Neck or Lumbar Spine. JBMR 2014, 29, 2520–2526. [Google Scholar] [CrossRef]
  6. Rashki Kemmak, A.; Rezapour, A.; Jahangiri, R.; Nikjoo, S.; Farabi, H.; Soleimanpour, S. Economic burden of osteoporosis in the world: A systematic review. Med. J. Islam. Repub. Iran. 2020, 34, 154. [Google Scholar] [CrossRef]
  7. Burge, R.; Dawson-Hughes, B.; Solomon, D.H.; Wong, J.B.; King, A.; Tosteson, A. Incidence and economic burden of osteoporosis-related fractures in the United States, 2005–2025. J. Bone Miner. Res. 2007, 22, 465–475. [Google Scholar] [CrossRef]
  8. Johnell, O.; Kanis, J.A. An estimate of the worldwide prevalence and disability associated with osteoporotic fractures. Osteoporos. Int. 2006, 17, 1726–1733. [Google Scholar] [CrossRef]
  9. Keene, G.S.; Parker, M.J.; Pryor, G.A. Mortality and morbidity after hip fractures. BMJ 1993, 307, 1248–1250. [Google Scholar] [CrossRef]
  10. Poór, G.; Atkinson, E.J.; O’Fallon, W.M.; Melton, L.J., 3rd. Determinants of reduced survival following hip fractures in men. Clin. Orthop. Relat. Res. 1995, 319, 260–265. [Google Scholar] [PubMed]
  11. Hernlund, E.; Svedbom, A.; Ivergard, M.; Compston, J.; Cooper, C.; Stenmark, J.; McCloskey, E.V.; Jonsson, B.; Kanis, J.A. Osteoporosis in the European Union: Medical management, epidemiology and economic burden. Arch. Osteoporos. 2013, 8, 136. [Google Scholar] [CrossRef] [PubMed]
  12. Kanis, J.A.; Johnell, O. Requirements for DXA for the management of osteoporosis in Europe. Osteoporos. Int. 2005, 16, 229–238. [Google Scholar] [CrossRef] [PubMed]
  13. Cummings, S.R.; Melton, L.J. Epidemiology and outcomes of osteoporotic fractures. Lancet 2002, 359, 1761–1767. [Google Scholar] [CrossRef]
  14. Abrahamsen, B.; van Staa, T.; Ariely, R.; Olson, M.; Cooper, C. Excess mortality following hip fracture: A systematic epidemiological review. Osteoporos. Int. 2009, 20, 1633–1650. [Google Scholar] [CrossRef]
  15. Gullberg, B.; Johnell, O.; Kanis, J.A. World-wide Projections for Hip Fracture. Osteoporos. Int. 1997, 7, 407–413. [Google Scholar] [CrossRef]
  16. Cooper, C.; Campion, G.; Melton, L.J. Hip fractures in the elderly: A world-wide projection. Osteoporos. Int. 1992, 2, 285–289. [Google Scholar] [CrossRef]
  17. Deshpande, N.; Hadi, M.S.; Lillard, J.C.; Passias, P.G.; Linzey, J.R.; Saadeh, Y.S.; LaBagnara, M.; Park, P. Alternatives to DEXA for the assessment of bone density: A systematic review of the literature and future recommendations. J. Neurosurg. Spine 2023, 38, 436–445. [Google Scholar] [CrossRef] [PubMed]
  18. Choksi, P.; Jepsen, K.J.; Clines, G.A. The challenges of diagnosing osteoporosis and the limitations of currently available tools. Clin. Diabetes Endocrinol. 2018, 4, 12. [Google Scholar] [CrossRef]
  19. Dorr, L.D.; Faugere, M.-C.; Mackel, A.M.; Gruen, T.A.; Bognar, B.; Malluche, H.H. Structural and cellular assessment of bone quality of proximal femur. Bone 1993, 14, 231–242. [Google Scholar] [CrossRef]
  20. Hadidi, F.; Khalil, O.A.; Alhadidy, A.; Alqawaba, R.; Hammad, Y.; Samarah, O.Q.; Hamdan, M.; Yasin, M.S.; Hawa, A.F.; AlRyalat, A. Correlation between plain X-ray measurements and DXA scans, and its possible use as a screening tool for performing DXA scans. Int. J. Clin. Pract. 2021, 75, e14784. [Google Scholar] [CrossRef]
  21. Sah, A.P.; Thornhill, T.S.; LeBoff, M.S.; Glowacki, J. Correlation of plain radiographic indices of the hip with quantitative bone mineral density. Osteoporos. Int. 2007, 18, 1119–1126. [Google Scholar] [CrossRef] [PubMed]
  22. Ilyas, G.; Ipci, F.B. Evaluation of the Relationship between Osteoporosis Parameters in Plain Hip Radiography and DXA Results in 156 Patients at a Single Center in Turkey. Diagnostics 2023, 13, 2519. [Google Scholar] [CrossRef]
  23. Nguyen, B.N.; Hoshino, H.; Togawa, D.; Matsuyama, Y. Cortical Thickness Index of the Proximal Femur: A Radiographic Parameter for Preliminary Assessment of Bone Mineral Density and Osteoporosis Status in the Age 50 Years and Over Population. Clin. Orthop. Surg. 2018, 10, 149. [Google Scholar] [CrossRef]
  24. Im, G.-I.; Park, P.-G.; Moon, S.-W. The relationship between radiological parameters from plain hip radiographs and bone mineral density in a Korean population. J. Bone Miner. Metab. 2012, 30, 504–508. [Google Scholar] [CrossRef]
  25. Faundez, J.; Carmona, M.; Klaber, I.; Zamora, T.; Botello, E.; Schweitzer, D. Radiographic Assessment of Bone Quality Using 4 Radiographic Indexes: Canal Diaphysis Ratio Is Superior. J. Arthroplast. 2024, 39, 427–432. [Google Scholar] [CrossRef]
  26. Baumgärtner, R.; Heeren, N.; Quast, D.; Babst, R.; Brunner, A. Is the cortical thickness index a valid parameter to assess bone mineral density in geriatric patients with hip fractures? Arch. Orthop. Trauma. Surg. 2015, 135, 805–810. [Google Scholar] [CrossRef]
  27. Rudloff, M.I.; Smith, W.R. Intramedullary Nailing of the Femur: Current Concepts Concerning Reaming. J. Orthop. Trauma. 2009, 23, S12–S17. [Google Scholar] [CrossRef]
  28. Cohen, J. Statistical Power Analysis for the Behavioral Sciences; Lawrence Erlbaum Associates: Hillsdale, NJ, USA, 1988. [Google Scholar]
  29. Landis, J.R.; Koch, G.G. The measurement of observer agreement for categorical data. Biometrics 1977, 33, 159–174. [Google Scholar] [CrossRef]
  30. Pulkkinen, P.; Partanen, J.; Jalovaara, P.; Jämsä, T. Combination of bone mineral density and upper femur geometry improves the prediction of hip fracture. Osteoporos. Int. 2004, 15, 274–280. [Google Scholar] [CrossRef]
  31. Kanis, J.A.; Johnell, O.; Oden, A.; Johansson, H.; McCloskey, E. FRAXTM and the assessment of fracture probability in men and women from the UK. Osteoporos. Int. 2008, 19, 385–397. [Google Scholar] [CrossRef]
  32. Pothong, W.; Adulkasem, N. Comparative evaluation of radiographic morphologic parameters for predicting subsequent contralateral fragility hip fracture. Int. Orthop. 2023, 47, 1837–1843. [Google Scholar] [CrossRef] [PubMed]
  33. Pellegrini, A.; Tacci, F.; Leigheb, M.; Costantino, C.; Pedrazzini, A.; Pedrazzi, G.; Vaienti, E.; Ceccarelli, F.; Pogliacomi, F. Injuries of the trochanteric region: Can analysis of radiographic indices help in prediction of recurrent osteoporotic hip fractures? Acta Biomed. 2017, 88, 43–49. [Google Scholar] [PubMed]
  34. Nash, W.; Harris, A. The Dorr Type and Cortical Thickness Index of the Proximal Femur for Predicting Peri-Operative Complications during Hemiarthroplasty. J. Orthop. Surg. 2014, 22, 92–95. [Google Scholar] [CrossRef] [PubMed]
  35. Courtney, A.C.; Hayes, W.C.; Gibson, L.J. Age-related differences in post-yield damage in human cortical bone. Experiment and model. J. Biomech. 1996, 29, 1463–1471. [Google Scholar] [CrossRef]
  36. Pistoia, W.; van Rietbergen, B.; Lochmüller, E.-M.; Lill, C.; Eckstein, F.; Rüegsegger, P. Estimation of distal radius failure load with micro-finite element analysis models based on three-dimensional peripheral quantitative computed tomography images. Bone 2002, 30, 842–848. [Google Scholar] [CrossRef]
  37. Nishiyama, K.K.; Macdonald, H.M.; Buie, H.R.; A Hanley, D.; Boyd, S.K. Postmenopausal women with osteopenia have higher cortical porosity and thinner cortices at the distal radius and tibia than women with normal aBMD: An in vivo HR-pQCT study. J. Bone Miner. Res. 2010, 25, 882–890. [Google Scholar] [CrossRef]
  38. Guyan, F.; Gianduzzo, E.; Waltenspül, M.; Dietrich, M.; Kabelitz, M. Cortical Thickness Index and Canal Calcar Ratio: A Comparison of Proximal Femoral Fractures and Non-Fractured Femora in Octogenarians to Centenarians. J. Clin. Med. 2024, 13, 981. [Google Scholar] [CrossRef]
  39. Kanis, J.A. Diagnosis of osteoporosis and assessment of fracture risk. Lancet 2002, 359, 1929–1936. [Google Scholar] [CrossRef]
  40. Yu, E.W.; Thomas, B.J.; Brown, J.K.; Finkelstein, J.S. Simulated increases in body fat and errors in bone mineral density measurements by DXA and QCT. J. Bone Miner. Res. 2012, 27, 119–124. [Google Scholar] [CrossRef]
  41. Someya, K.; Mochizuki, T.; Hokari, S.; Tanifuji, O.; Katsumi, R.; Koga, H.; Takahashi, Y.; Kobayashi, K.; Morise, Y.; Sakamoto, M.; et al. Age- and sex-related characteristics in cortical thickness of femoral diaphysis for young and elderly subjects. J. Bone Miner. Metab. 2020, 38, 533–543. [Google Scholar] [CrossRef]
  42. Huppke, C.M.; Fahlbusch, H.; Frosch, K.-H.; Krause, M.; von Rehlingen-Prinz, F. Cortical bone thickness on preoperative CT scans as predictor of bone quality in distal femur fractures: A retrospective study in Caucasians. Arch. Orthop. Trauma. Surg. 2023, 144, 731–740. [Google Scholar] [CrossRef] [PubMed]
  43. Duan, Y.; Beck, T.J.; Wang, X.-F.; Seeman, E. Structural and Biomechanical Basis of Sexual Dimorphism in Femoral Neck Fragility Has Its Origins in Growth and Aging. J. Bone Miner. Res. 2003, 18, 1766–1774. [Google Scholar] [CrossRef] [PubMed]
  44. Cui, P.; Wang, W.; Wang, Z.; Hu, X.; Liu, X.; Kong, C.; Lu, S. The association between body mass index and bone mineral density in older adults: A cross-sectional study of community population in Beijing. BMC Musculoskelet. Disord. 2024, 25, 655. [Google Scholar] [CrossRef] [PubMed]
Figure 1. Flowchart of patient selection.
Jcm 14 02654 g001
Figure 2. Anteroposterior X-ray of the pelvis: measurement of CTI at ten centimeters below the mid lesser trochanteric line in the left, non-fractured femur (A) and 15 cm bilaterally, after implantation of an endomedullary nail (B).
Jcm 14 02654 g002
Table 1. Patients’ demographics characteristics.
VariableFemoral Neck FractureTrochanteric Fracture
Number of patients100100
Sex, n (%)
female70 (70)74 (74)
male30 (30)26 (26)
Age at time of surgery, years ± SD82 ± 985 ± 8.45
BMI (kg/m2) ± SD23.3 ± 4.2922.9 ± 4.15
Body weight (kg) ± SD64.3 ± 12.4661.7 ± 12.33
Affected side, n
left4150
right5950
SD = standard deviation.
Table 2. Correlation of CTI at 10 and 15 cm below lesser trochanter on the unaffected side.
CTI ± SD NFx at 10 cmCTI ± SD NFx at 15 cmr Valuep Value
Femoral neck fracture0.544 ± 0.0610.502 ± 0.06r = 0.664p < 0.001
Trochanteric fracture0.512 ± 0.0780.481 ± 0.072r = 0.766p < 0.001
CTI = cortical thickness index, SD = standard deviation, NFx = non-fractured. Data are presented as mean ± SD, significance was set at p < 0.05.
Table 3. CTI values at 15 cm on both sides, as well as the significant differences for both groups.
CTI ± SD NFx at 15 cmCTI ± SD Fx at 15 cmp Value
Femoral neck fracture0.502 ± 0.060.478 ± 0.065p < 0.001
Trochanteric fracture0.481 ± 0.0720.457 ± 0.069p < 0.001
CTI = cortical thickness index, SD = standard deviation, NFx = non-fractured, Fx = fractured. Data are presented as mean ± SD, significance was set at p < 0.05.
Table 4. Correlations comparing the CTI values in the non-fractured side of the subgroups.
VariableFemoral
Neck
Fracture
Females
Femoral
Neck
Fracture
Males
Trochanteric
Fracture
Females
Trochanteric
Fracture
Males
CTI ± SD NFx at 10 cm0.540 ± 0.0620.552 ± 0.0570.514 ± 0.0790.506 ± 0.077
CTI ± SD NFx at 15 cm0.488 ± 0.0640.534 ± 0.0450.473 ± 0.0750.504 ± 0.069
Pearson’s correlationr = 0.716r = 0.538r = 0.807r = 0.742
p valuep < 0.001 p = 0.046p < 0.001p = 0.841
CTI = cortical thickness index, SD = standard deviation, NFx = non-fractured. Data are presented as mean ± SD, significance was set at p < 0.05.
Table 5. Significant differences comparing the CTI values of the fractured and the non-fractured side.
VariableFemoral
Neck
Fracture
Females
Femoral
Neck
Fracture
Males
Trochanteric
Fracture
Females
Trochanteric
Fracture
Males
CTI ± SD Fx at 15 cm0.461 ± 0.060.517 ± 0.0620.451 ± 0.0720.474 ± 0.058
CTI ± SD NFx at 15 cm0.488 ± 0.0640.534 ± 0.0450.473 ± 0.0750.504 ± 0.069
p valuep < 0.001p = 0.083p < 0.001p = 0.001
CTI = cortical thickness index, SD = standard deviation, Fx = fractured, NFx = non-fractured. Data are presented as mean ± SD, significance was set at p < 0.05.
Disclaimer/Publisher’s Note: The statements, opinions and data contained in all publications are solely those of the individual author(s) and contributor(s) and not of MDPI and/or the editor(s). MDPI and/or the editor(s) disclaim responsibility for any injury to people or property resulting from any ideas, methods, instructions or products referred to in the content.

