
Physical Activity, Physical Fitness and Energy Intake Predict All-Cause Mortality and Age at Death in Extinct Cohorts of Middle-Aged Men Followed-Up for 61 Years


Abstract
1. Introduction
2. Material and Methods
3. Results
4. Discussion
Author Contributions
Funding
Institutional Review Board Statement
Informed Consent Statement
Data Availability Statement
Conflicts of Interest
Appendix A
Appendix A.1. Introduction
Appendix A.2. Material
Appendix A.3. Computation of Fitness Score
Appendix A.4. Comments
References
- Powell, K.E.; Paffenbarger, R.S., Jr. Workshop on epidemiologic and public health aspects of physical activity and exercise: A summary. Public. Health Rep. 1985, 100, 118–126. [Google Scholar]
- Warburton, D.E.R.; Nicol, C.W.; Bredin, S.S.D. Health benefits of physical activity: The evidence. Can. Med. Assoc. J. 2006, 174, 801–809. [Google Scholar]
- Menotti, A.; Puddu, P.E. How the Seven Countries Study contributed to the launch and development of cardiovascular epidemiology in Italy. A historical perspective. Nutr. Metab. Cardiovasc. Dis. 2020, 30, 368–383. [Google Scholar] [PubMed]
- Seccareccia, F.; Menotti, A. Physical activity, physical fitness and mortality in a sample of middle-aged men followed-up for 25 years. J. Sports Med. Phys. Fit. 1992, 28, 335–341. [Google Scholar]
- Menotti, A.; Puddu, P.E.; Geleijnse, J.M.; Kafatos, A.; Tolonen, H. Physical activity and physical fitness in prediction of all-cause mortality and age at death in European extinct cohorts of middle-aged men followed for 60 years. Eur. J. Prev. Cardiol. 2024, 31, 1441–1448. [Google Scholar] [PubMed]
- Puddu, P.E.; Kafatos, A.; Tolonen, H.; Geleijnse, J.M.; Menotti, A. Occupational physical activity and fitness in predicting cardiovascular mortality among European cohorts of middle-aged men: A 60-year follow-up in the Seven Countries Study. Hearts 2024, 5, 259–274. [Google Scholar] [CrossRef]
- Rose, G.; Blackburn, H. Cardiovascular Survey Methods; World Health Organization: Geneva, Switzerland, 1968; pp. 1–188. [Google Scholar]
- Hemsfield, S.B.; MacManus, C.; Smith, J.; Stevens, V.; Nixon, D.W. Anthropometric measurement of muscle mass: Revised equations for calculating bone-free arm muscle area. Am. J. Clin. Nutr. 1982, 36, 680–690. [Google Scholar] [CrossRef]
- Fidanza, F.; Versiglioni, N. Tabelle di Composizione Degli Alimenti; Food Composition Tables; Idelson: Napoli, Italy, 1981. [Google Scholar]
- Anderson, J.T.; Keys, A. Cholesterol in serum and lipoprotein fractions: Its measurement and stability. Clin. Chem. 1956, 2, 145–159. [Google Scholar]
- Robine, J.M. Age at death, the return of an old metrics whose impact is growing. Aging Clin. Exper. Res. 2018, 30, 1147–1149. [Google Scholar]
- Menotti, A.; Puddu, V. Ten-year mortality from coronary heart disease among 172,000 men classified by occupational physical activity. Scand. J. Work. Environ. Health 1979, 5, 100–108. [Google Scholar]
- Macera, C.A.; Ham, S.A.; Jones, D.A.; Kimsey, C.D.; Ainsworth, B.E.; Neff, L.J. Limitations on the use of a single screening question to measure sedentary behavior. Am. J. Public. Health 2001, 91, 2010–2012. [Google Scholar]
- Ainsworth, B.E.; Bassett, D.R., Jr.; Strath, S.J.; Swartz, A.M.; O’Brien, W.L.; Thompson, R.W.; Jones, D.A.; Macera, C.A.; Kimsey, C.D. Comparison of three methods for measuring the time spent in physical activity. Med. Sci. Sports Exerc. 2000, 32, S457–S464. [Google Scholar] [CrossRef] [PubMed]
- Davidson, T.; Vainshelboim, B.; Kokkinos, P.; Myers, J.; Ross, R. Cardiorespiratory fitness versus physical activity as predictors of all-cause mortality in men. Am. Heart J. 2018, 196, 156–162. [Google Scholar] [CrossRef] [PubMed]
- Myers, J.; Kaykha, A.; George, S.; Abella, J.; Zaheer, N.; Lear, S.; Yamazaki, T.; Froelicher, V. Fitness versus physical activity patterns in predicting mortality in men. Am. J. Med. 2004, 117, 912–918. [Google Scholar] [CrossRef] [PubMed]
- Myers, J.; McAuley, P.; Carl, J.; Lavie, C.J.; Despres, J.P.; Arena, R.; Kokkinos, P. Physical activity and cardiorespiratory fitness as major markers of cardiovascular risk: Their independent and interwoven importance to health status. Prog. Cardiovasc. Dis. 2015, 57, 306–314. [Google Scholar]
- Villeneuve, P.J.; Morrison, H.I.; Craig, C.L.; Schaubel, D.E. Physical activity, physical fitness and risk of dying. Epidemiology 1998, 9, 626–631. [Google Scholar]
- DeFina, L.F.; Haskell, W.L.; Willis, B.L.; Barlow, C.E.; Finley, C.E.; Levine, B.D.; Cooper, K.H. Physical activity versus cardiorespiratory fitness: Two (partly) distinct components of cardiovascular health? Prog. Cardiovasc. Dis. 2015, 57, 324–329. [Google Scholar]
- Sandvik, L.; Erikssen, J.; Thaulow, E.; Erikssen, G.; Mundal, R.; Rodahl, K. Physical fitness as a predictor of mortality among healthy, middle-aged Norwegian men. N. Engl. J. Med. 1993, 328, 533–537. [Google Scholar]
- Blair, S.N.; Kampert, J.B.; Kohl, H.W., 3rd; Barlow, C.E.; Macera, C.A.; Paffenbarger, R.S., Jr.; Gibbons, L.W. Influences of cardiorespiratory fitness and other precursors on cardiovascular disease and all-cause mortality in men and women. JAMA 1996, 276, 205–210. [Google Scholar]
- Kodama, S.; Saito, K.; Tanaka, S.; Maki, M.; Yachi, Y.; Asumu, M.; Sugawara, A.; Totsuka, K.; Shimano, H.; Ohashi, Y.; et al. Cardiorespiratory fitness as a quantitative predictor of all-cause mortality and cardiovascular events in healthy men and women: A meta-analysis. JAMA 2009, 301, 2024–2035. [Google Scholar]
- Cheng, Y.J.; Macera, C.A.; Addy, C.L.; Sy, F.S.; Wieland, D.; Blair, S.N. Effects of physical activity on exercise tests and respiratory function. Br. J. Sports Med. 2003, 37, 521–528. [Google Scholar] [PubMed]
- Weinmayr, G.; Schulz, H.; Klenk, J.; Denkinger, M.; Duran-Tauleria, E.; Koenig, W.; Dallmeier, D.; Rothenbacher, D.; ActiFE Study Group. Association of lung function with overall mortality is independent of inflammatory, cardiac, and functional biomarkers in older adults: The ActiFE-study. Sci. Rep. 2020, 10, 11862. [Google Scholar]
- Lopez-Jaramillo, P.; Lopez-Lopez, J.P.; Tole, M.C.; Cohen, D.D. Increasing muscular strength to improve cardiometabolic risk factors. Clin. Investig. Arterioscler. 2023, 35, 144–154. [Google Scholar]
- Cillekens, B.; Huysmans, M.A.; Holtermann, A.; van Mechelen, W.; Straker, L.; Krause, N.; van der Beek, A.J.; Coenen, P. Physical activity at work may not be health enhancing. A systematic review with meta-analysis on the association between occupational physical activity and cardiovascular disease mortality covering 23 studies with 655892 participants. Scand. J. Work Environ. Health 2022, 48, 86–98. [Google Scholar] [CrossRef] [PubMed]


| Variable | ||
|---|---|---|
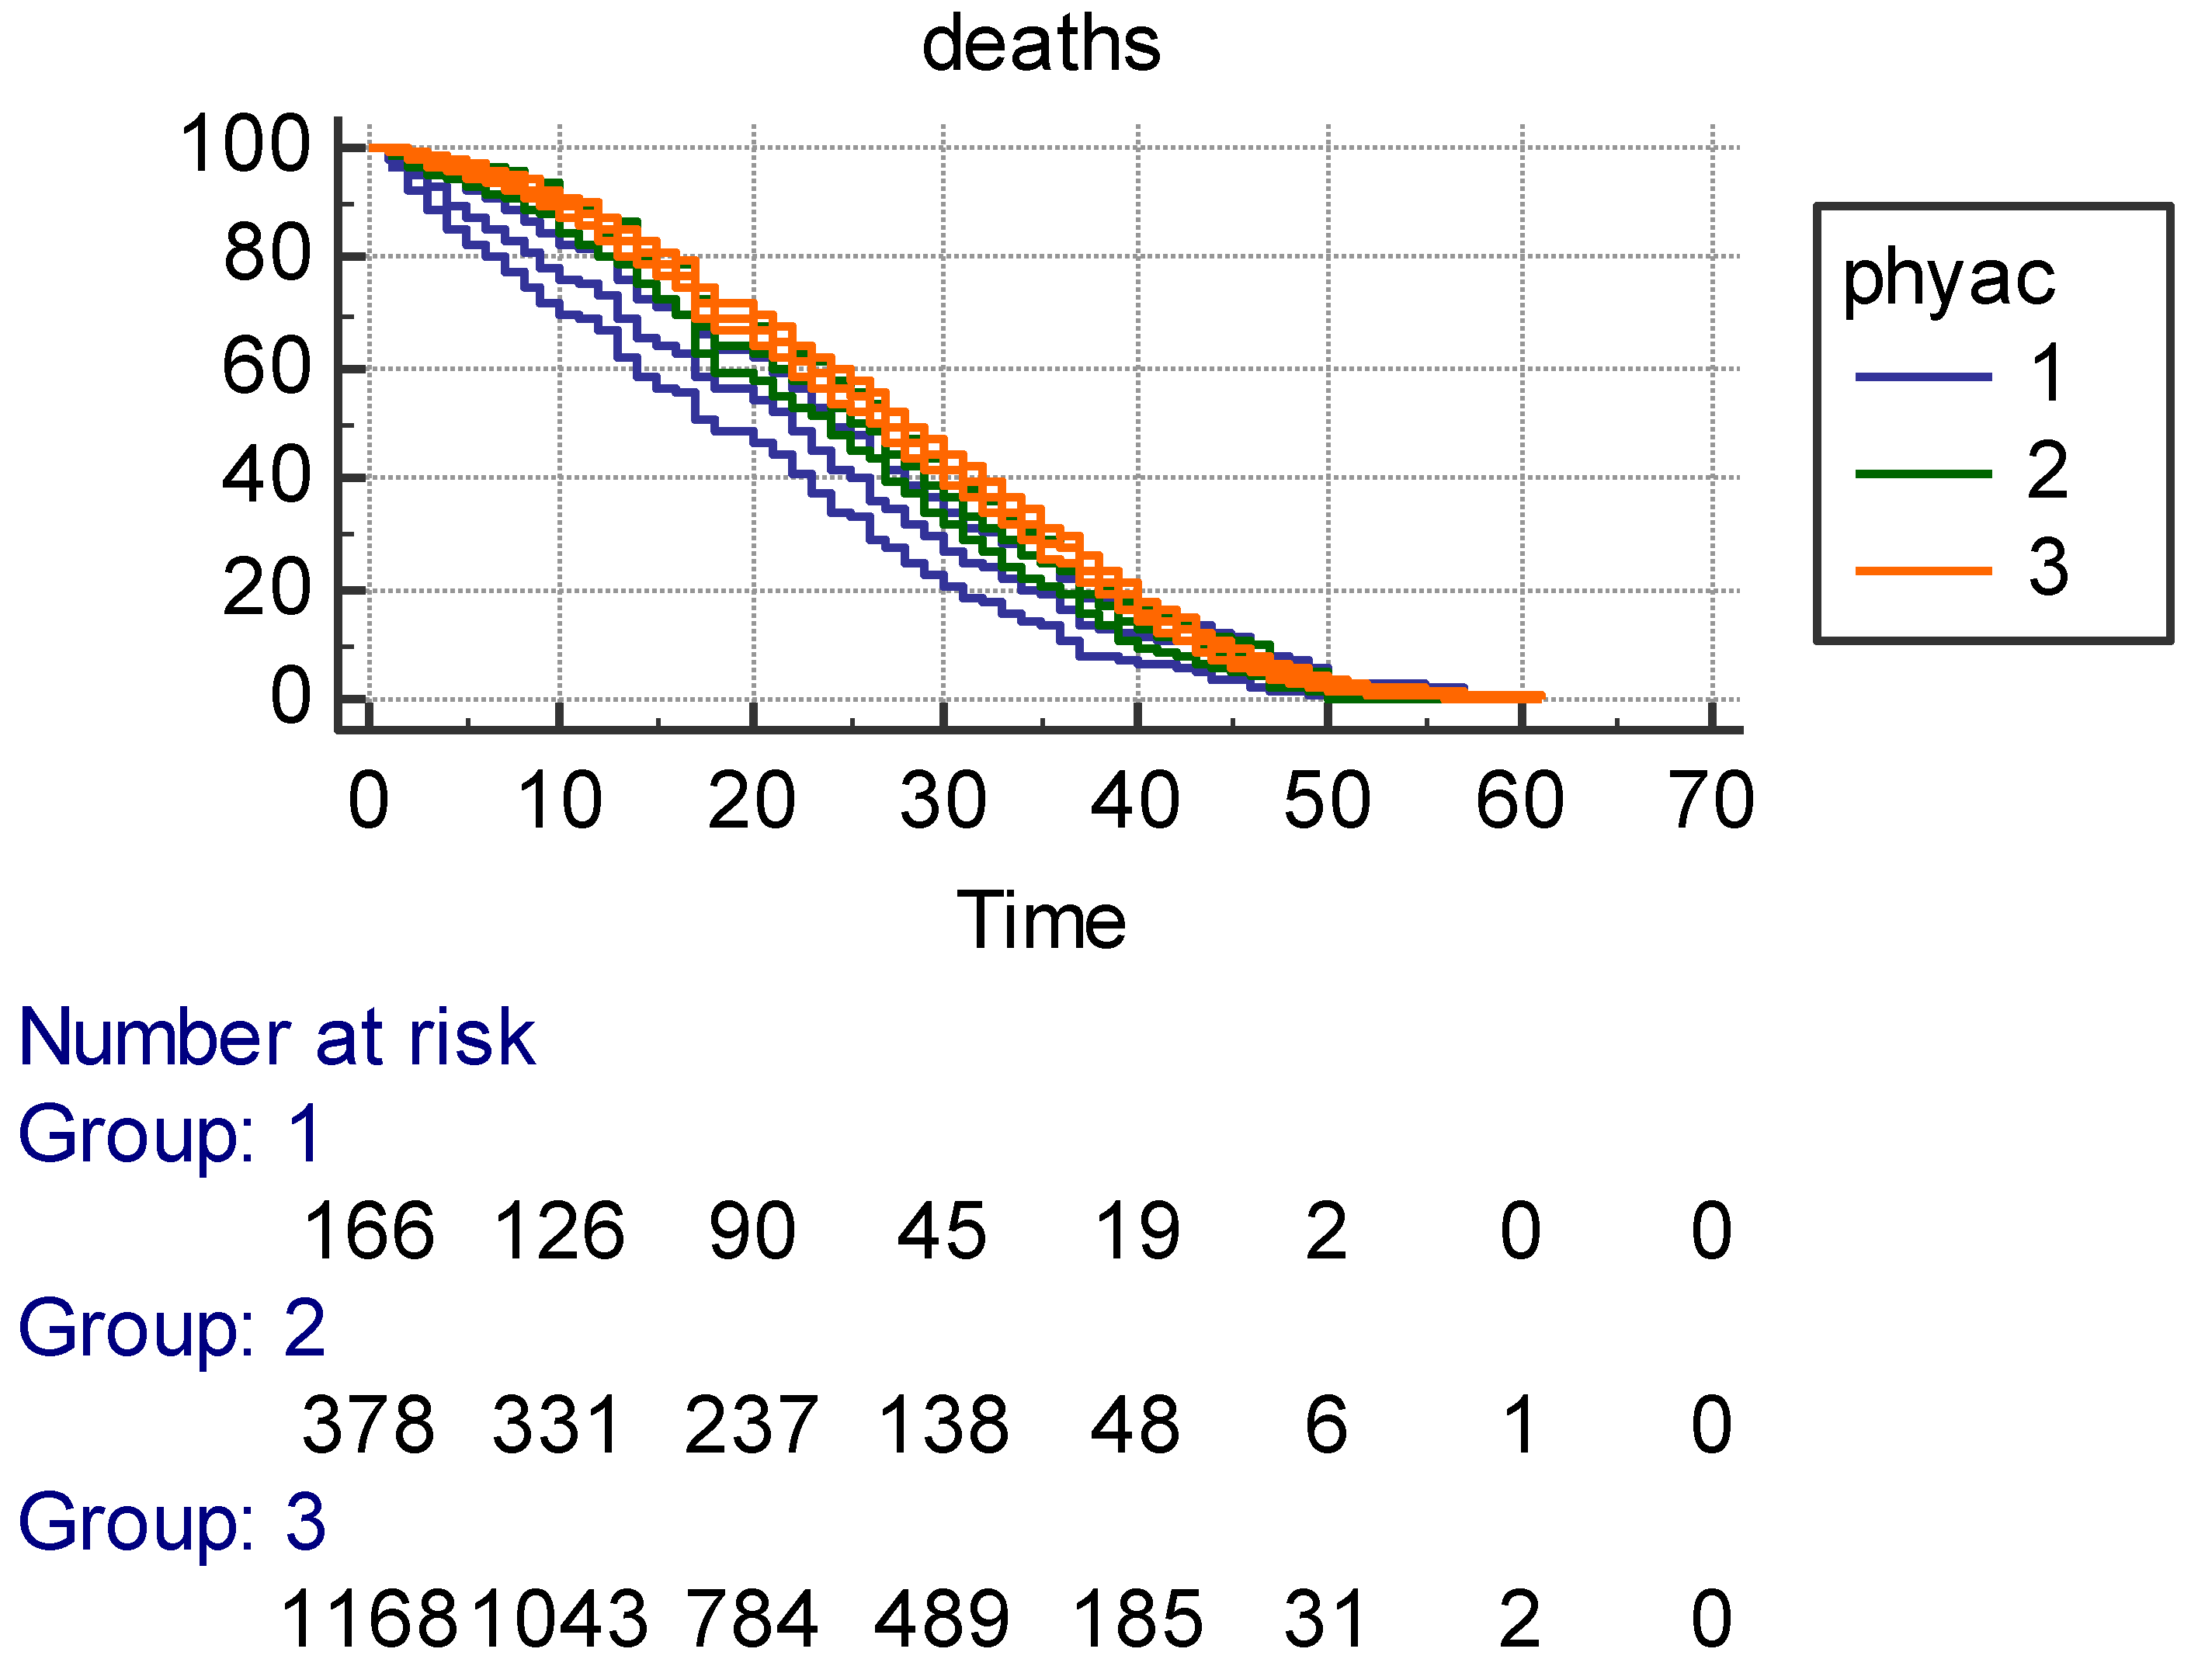
| Physical activity class | N | % (SE) |
| Low | 166 | 9.7 (0.7) |
| Intermediate | 378 | 22.1 (1.0) |
| High | 1168 | 68.2 (1.1) |
| Fitness variables | Mean | SD |
| Arm circumference, mm | 268.6 | 23.6 |
| Heart rate, beats/min | 71.3 | 12.9 |
| Vital capacity, L/m2 | 1.65 | 0.24 |
| Calories | ||
| Daily intake | 3112 | 647 |
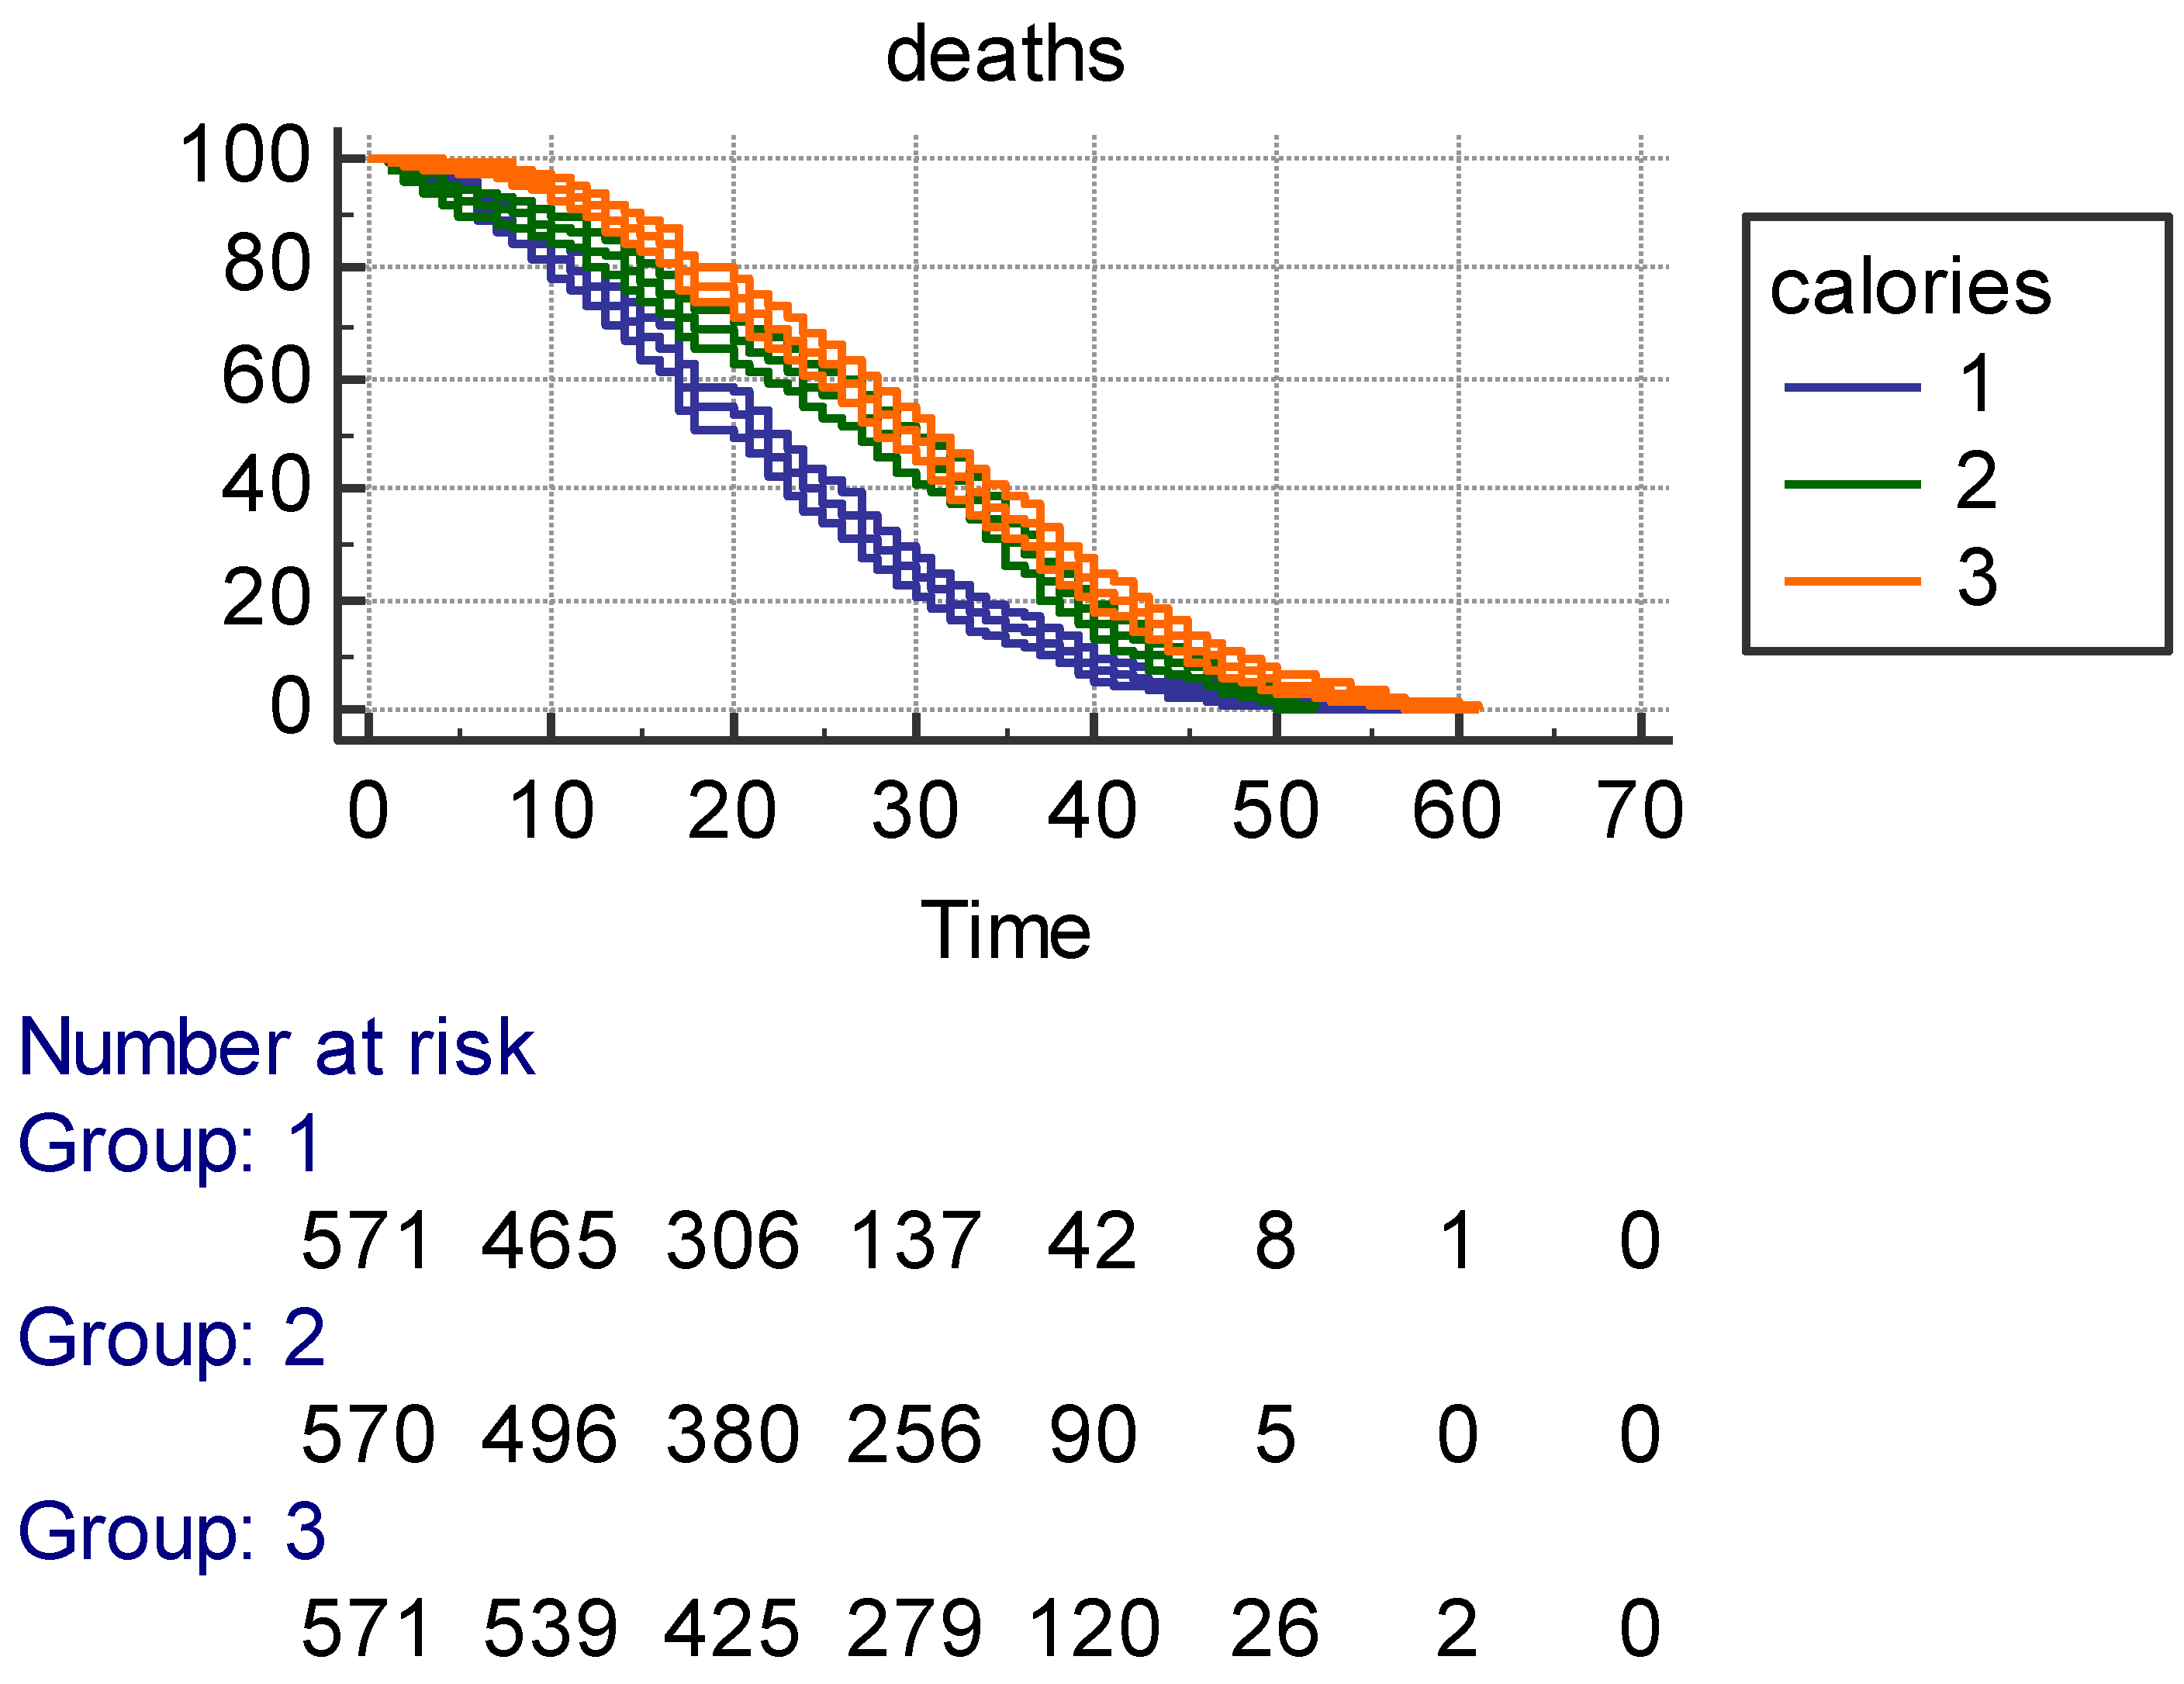
| Calories, tertile 1 | 2463 | 346 |
| Calories, tertile 2 | 3108 | 131 |
| Calories, tertile 3 | 3766 | 517 |
| Confounding variables | ||
| Age, years | 49.1 | 5.1 |
| Cigarette, N/day | 8.7 | 9.5 |
| Body mass index, kg/m2 | 25.2 | 3.7 |
| Systolic blood pressure, mmHg | 143.6 | 21.0 |
| Serum cholesterol, mmol/L | 5.21 | 1.06 |
| Variable | Mean (SD) | Mean (SD) |
|---|---|---|
| Class | Phyac low | Fitscore low |
| N | 166 | 571 |
| Energy, Kcal/day | 2816 (618) | 2919 (614) |
| Class | Phyac intermediate | Fitscore intermediate |
| N | 378 | 570 |
| Energy, Kcal/day | 2962 (602) | 3164 (650) |
| Class | Phyac high | Fitscore high |
| N | 1168 | 571 |
| Energy, Kcal/day | 3203 (643) | 3254 (629) |
| ANOVA across classes | p < 0.0001 | p < 0.0001 |
| Variable | Mean (SD) | Mean (SD) | Mean (SD) |
|---|---|---|---|
| Phyac low N = 166 | Fitscore low N = 571 | Calories low N = 571 | |
| Arm circumference | 259.4 (5.2) | 255.6 (23.3) | 264.8 (25.5) |
| Heart rate | 77.4 (14.8) | 81.3 (13.4) | 73.8 (14.0) |
| Vital capacity | 1.59 (0.27) | 1.45 (0.21) | 1.58 (0.25) |
| Phyac intermediate N = 378 | Fitscore intermediate N = 570 | Calories intermediate N = 570 | |
| Arm circumference | 268.1 (25.6) | 268.0 (19.9) | 268.6 (21.6) |
| Heart rate | 74.3 (13.5) | 69.2 (9.2) | 70.8 (12.1) |
| Vital capacity | 1.61 (0.25) | 1.65 (0.15) | 1.66 (0.23) |
| Phyac high N = 1168 | Fitscore high N = 571 | Calories high N = 570 | |
| Arm circumference | 270.0 (22.1) | 282.0 (19.7) | 272.2 (22.9) |
| Heart rate | 69.5 (11.9) | 63.4 (8.2) | 69.3 (12.1) |
| Vital capacity | 1.67 (0.21) | 1.84 (0.18) | 1.70 (0.22) |
| ANOVA | |||
| Arm circumference | <0.0001 | <0.0001 | <0.0001 |
| Heart rate | <0.0001 | <0.0001 | <0.0001 |
| Vital capacity | <0.0001 | <0.0001 | <0.0001 |
| Coefficient | p Value | Hazard Ratio | 95% CI | ||
|---|---|---|---|---|---|
| COX model (1) predicting all-cause mortality with Phyac only | |||||
| Phyac 1 | Reference | ---- | ---- | ---- | |
| Phyac 2 | −0.1948 | 0.0383 | 0.82 | 0.68 | 0.99 |
| Phyac 3 | −0.2740 | 0.0004 | 0.76 | 0.64 | 0.90 |
| COX model (2) predicting all-cause mortality with Phyac and Fitscore | |||||
| Phyac 1 | Reference | ----- | ----- | ----- | |
| Phyac 2 | −0.1872 | 0.0465 | 0.83 | 0.69 | 1.00 |
| Phyac 3 | −0.2226 | 0.0089 | 0.80 | 0.68 | 0.95 |
| Fitscore 1 | Reference | ----- | ----- | ----- | |
| Fitscore 2 | −0.2286 | 0.0002 | 0.80 | 0.71 | 0.90 |
| Fitscore 3 | −0.2616 | 0.0001 | 0.77 | 0.68 | 0.87 |
| COX model (3) predicting all-cause mortality with Phyac, Fitscore, and Calories | |||||
| Phyac 1 | Reference | ----- | ----- | ----- | |
| Phyac 2 | −0.1731 | 0.0658 | 0.84 | 0.70 | 1.01 |
| Phyac 3 | −0.1830 | 0.0342 | 0.83 | 0.70 | 0.99 |
| Fitscore 1 | Reference | ----- | ----- | ----- | |
| Fitscore 2 | −0.2010 | 0.0012 | 0.82 | 0.72 | 0.92 |
| Fitscore 3 | −0.2428 | 0.0002 | 0.78 | 0.70 | 0.89 |
| Calories 1 | Reference | ----- | ----- | ----- | |
| Calories 2 | −0.2394 | 0.0001 | 0.79 | 0.70 | 0.89 |
| Calories 3 | −0.1998 | 0.0023 | 0.82 | 0.72 | 0.93 |
| Coefficient | p Value | 95% CI | ||
|---|---|---|---|---|
| MLR Model (1) Predicting Age at Death with Phyac Only; R2 = 0.0964 | ||||
| Phyac 1 | Reference | ----- | ----- | |
| Phyac 2 | 2.4898 | 0.0154 | 0.48 | 4.50 |
| Phyac 3 | 3.2097 | 0.0005 | 1.41 | 5.00 |
| MLR model (2) predicting age at death with Phyac and Fitscore; R2 = 0.1093 | ||||
| Phyac 1 | Reference | ----- | ----- | |
| Phyac 2 | 2.3688 | 0.0202 | 0.37 | 4.37 |
| Phyac 3 | 2.5104 | 0.0064 | 0.71 | 4.31 |
| Fitscore 1 | Reference | ----- | ----- | |
| Fitscore 2 | 2.5132 | 0.0002 | 1.15 | 3.76 |
| Fitscore 3 | 3.5287 | 0.0001 | 2.15 | 4.91 |
| MLR model (3) predicting age at death with Phyac, Fitscore, and Calories; R2 = 0.1165 | ||||
| Phyac 1 | Reference | ----- | ----- | |
| Phyac 2 | 2.1578 | 0.0339 | 0.17 | 4.15 |
| Phyac 3 | 1.9303 | 0.0381 | 0.11 | 3.75 |
| Fitscore 1 | Reference | ----- | ----- | |
| Fitscore 2 | 2.1554 | 0.0012 | 0.85 | 3.46 |
| Fitscore 3 | 3.2317 | 0.0001 | 1.85 | 4.61 |
| Calories 1 | Reference | ----- | ----- | |
| Calories 2 | 2.2916 | 0.0005 | 0.99 | 3.59 |
| Calories 3 | 2.4836 | 0.0004 | 1.10 | 3.87 |
| Variable | Coefficient | p Value | Delta | Effect | 95% Cl | |
|---|---|---|---|---|---|---|
| Intercept | 95.0153 | <0.0001 | ---- | ---- | ---- | |
| Age, years | 0.1942 | 0.0009 | 5 | 0.97 | 0.40 | 1.54 |
| High socio-economic status, 1-0 | 2.0930 | 0.0284 | 1 | 2.09 | 0.22 | 3.96 |
| Father early death, 1-0 | −1.4110 | 0.0274 | 1 | −1.41 | −2.66 | −0.16 |
| Moher early death, 1-0 | −1.8418 | 0.0045 | 1 | −1.84 | −3.11 | −0.57 |
| Family CVD, 1-0 | −0.2628 | 0.6250 | 1 | −0.26 | −1.32 | 0.79 |
| Married, 1-0 | 1.7756 | 0.0478 | 1 | 1.78 | 0.02 | 3.53 |
| Smoker, 1-0 | reference | ---- | ---- | ---- | ---- | |
| Ex smoker, 1-0 | 1.3260 | 0.0955 | 1 | 1.33 | −0.23 | 2.88 |
| Never smoker, 1-0 | 2.9395 | <0.0001 | 1 | 2.94 | 1.70 | 4.18 |
| Body mass index, kg/m2 | −0.4072 | 0.0053 | 3.7 | −1.51 | −2.57 | −0.45 |
| Trunk/height, ratio | −0.0640 | 0.7250 | 1.5 | −0.10 | −0.63 | 0.44 |
| Shoulder pelvis shape, ratio | −7.4007 | 0.0409 | 0.1 | −0.74 | −1.45 | −0.03 |
| Laterality/linearity index, ratio | −0.2384 | 0.1501 | 1.8 | −0.43 | −1.01 | 0.15 |
| Subscapular skinfold, mm | 0.2544 | 0.0009 | 6 | 1.53 | 0.62 | 2.43 |
| Systolic blood pressure, mmHg | −0.1113 | <0.0001 | 20 | −2.23 | −2.78 | −1.67 |
| Serum cholesterol, mg/dl | −0.0232 | 0.0006 | 40 | −0.93 | −1.46 | −0.40 |
| Urine protein, 1-0 | −1.4725 | 0.14091 | 1 | −1.47 | −3.43 | 0.49 |
| Urine glucose, 1-0 | 0.0651 | 0.9906 | 1 | 0.07 | −10.73 | 10.86 |
| Corneal arcus, 1-0 | −1.9679 | 0.0110 | 1 | −1.97 | −2.79 | −0.36 |
| Xanthelasma 1-0 | −4.6000 | 0.0323 | 1 | −4.60 | −4.40 | −0.20 |
| Major CVD, 1-0 | −3.3550 | 0.0089 | 1 | −3.36 | −5.87 | −084 |
| Cancer, 1-0 | −20.0279 | <0.0001 | 1 | −20.03 | −29.46 | −10.60 |
| Diabetes, 1-0 | −2.2521 | 0.6760 | 1 | −2.25 | 12.81 | 8.31 |
| Chronic bronchitis, 1-0 | −2.8434 | 0.0088 | 1 | −2.84 | −4.97 | −0.72 |
| Silent ECG abnormalities, 1-0 (*) | −1.1593 | 0.3772 | 1 | −1.16 | −3.79 | 1.47 |
| Positive exercise ECG, 1-0 (*) | −1.7726 | 0.3161 | 1 | −1.77 | −5.24 | 1.69 |
| Low physical activity, 1-0 | reference | ---- | ---- | ---- | ---- | |
| Moderate physical activity, 1-0 | 1.5849 | 0.1180 | 1 | 1.58 | −0.40 | 3.57 |
| High physical activity | 2.2821 | 0.0202 | 1 | 2.28 | 0.36 | 4.21 |
| Low Fitscore, 1-0 | reference | ---- | ---- | ---- | ---- | |
| Intermediate Fitscore, 1-0 | 2.3545 | 0.0019 | 1 | 2.35 | 0.87 | 3.84 |
| High Fitscore, 1-0 | 3.3821 | 0.0004 | 1 | 3.38 | 1.53 | 5.23 |
| Low Calories, 1-0 | reference | ---- | ---- | ---- | ---- | |
| Intermediate Calories, 1-0 | 1.8547 | 0.0047 | 1 | 2.14 | 0.57 | 3.14 |
| High Calories, 1-0 | 2.1389 | 0.0023 | 1 | 2.14 | 0.77 | 3.51 |
| Variables excluded from the model and reasons for exclusion | ||||||
| Arm circumference | Component of Fitscore | |||||
| Heart rate | Component of Fitscore | |||||
| Vital capacity | Component of Fitscore | |||||
| Tricipital skinfold | Used to clean arm circumference from subcutaneous fat | |||||
| Forced expiratory volume | Collinearity problems with vital capacity | |||||
| Dietary score (3 classes) | Collinearity problems with Calories | |||||
Disclaimer/Publisher’s Note: The statements, opinions and data contained in all publications are solely those of the individual author(s) and contributor(s) and not of MDPI and/or the editor(s). MDPI and/or the editor(s) disclaim responsibility for any injury to people or property resulting from any ideas, methods, instructions or products referred to in the content. |
© 2025 by the authors. Licensee MDPI, Basel, Switzerland. This article is an open access article distributed under the terms and conditions of the Creative Commons Attribution (CC BY) license (https://creativecommons.org/licenses/by/4.0/).
Share and Cite
Menotti, A.; Puddu, P.E. Physical Activity, Physical Fitness and Energy Intake Predict All-Cause Mortality and Age at Death in Extinct Cohorts of Middle-Aged Men Followed-Up for 61 Years. J. Clin. Med. 2025, 14, 2178. https://doi.org/10.3390/jcm14072178
Menotti A, Puddu PE. Physical Activity, Physical Fitness and Energy Intake Predict All-Cause Mortality and Age at Death in Extinct Cohorts of Middle-Aged Men Followed-Up for 61 Years. Journal of Clinical Medicine. 2025; 14(7):2178. https://doi.org/10.3390/jcm14072178
Chicago/Turabian StyleMenotti, Alessandro, and Paolo Emilio Puddu. 2025. "Physical Activity, Physical Fitness and Energy Intake Predict All-Cause Mortality and Age at Death in Extinct Cohorts of Middle-Aged Men Followed-Up for 61 Years" Journal of Clinical Medicine 14, no. 7: 2178. https://doi.org/10.3390/jcm14072178
APA StyleMenotti, A., & Puddu, P. E. (2025). Physical Activity, Physical Fitness and Energy Intake Predict All-Cause Mortality and Age at Death in Extinct Cohorts of Middle-Aged Men Followed-Up for 61 Years. Journal of Clinical Medicine, 14(7), 2178. https://doi.org/10.3390/jcm14072178