
Evaluating Fundoscopy as a Screening Tool for Optic Nerve Atrophy in Multiple Sclerosis: An Optical Coherence Tomography (OCT) Comparative Study

 ,
,  ,
,  , ,
, , 
Abstract
1. Introduction
2. Materials and Methods
Statistical Analysis
3. Results
4. Discussion
5. Conclusions
Author Contributions
Funding
Institutional Review Board Statement
Informed Consent Statement
Data Availability Statement
Conflicts of Interest
Appendix A
References
- Yamout, B.; Al-Jumah, M.; Sahraian, M.A.; Almalik, Y.; Khaburi, J.A.; Shalaby, N.; Aljarallah, S.; Bohlega, S.; Dahdaleh, M.; Almahdawi, A.; et al. Consensus recommendations for diagnosis and treatment of Multiple Sclerosis: 2023 revision of the MENACTRIMS guidelines. Mult. Scler. Relat. Disord. 2024, 83, 105435. [Google Scholar] [CrossRef] [PubMed]
- Bennett, J.L. Optic Neuritis. CONTINUUM Lifelong Learn. Neurol. 2019, 25, 1236–1264. [Google Scholar] [CrossRef]
- Puthenparampil, M.; Federle, L.; Poggiali, D.; Miante, S.; Signori, A.; Pilotto, E.; Rinaldi, F.; Perini, P.; Sormani, M.P.; Midena, E.; et al. Trans-synaptic degeneration in the optic pathway. A study in clinically isolated syndrome and early relapsing-remitting multiple sclerosis with or without optic neuritis. PLoS ONE 2017, 12, e0183957. [Google Scholar] [CrossRef] [PubMed]
- Balcı, S.; Yıldız, M.B.; Özçelik Köse, A.; Süer, D.; Turan Vural, E.; Emir, C.; Yenerel, N.M. Optic Nerve Head Changes in Patients with Optic Neuritis Secondary to Multiple Sclerosis: A Comparison of The Affected and Fellow Healthy Eyes. Medeni. Med. J. 2020, 35, 330–337. [Google Scholar] [CrossRef] [PubMed]
- Kale, N. Optic neuritis as an early sign of multiple sclerosis. Eye Brain 2016, 8, 195–202. [Google Scholar] [CrossRef]
- Vidal-Jordana, A.; Rovira, A.; Calderon, W.; Arrambide, G.; Castilló, J.; Moncho, D.; Rahnama, K.; Collorone, S.; Toosy, A.T.; Ciccarelli, O.; et al. Adding the Optic Nerve in Multiple Sclerosis Diagnostic Criteria: A Longitudinal, Prospective, Multicenter Study. Neurology 2024, 102, e200805. [Google Scholar] [CrossRef]
- Bsteh, G.; Hegen, H.; Altmann, P.; Auer, M.; Berek, K.; Di Pauli, F.; Kornek, B.; Krajnc, N.; Leutmezer, F.; Macher, S.; et al. Diagnostic Performance of Adding the Optic Nerve Region Assessed by Optical Coherence Tomography to the Diagnostic Criteria for Multiple Sclerosis. Neurology 2023, 101, e784–e793. [Google Scholar] [CrossRef]
- Donica, V.C.; Alexa, A.I.; Pavel, I.A.; Danielescu, C.; Ciapă, M.A.; Donica, A.L.; Bogdănici, C.M. The Evolvement of OCT and OCT-A in Identifying Multiple Sclerosis Biomarkers. Biomedicines 2023, 11, 3031. [Google Scholar] [CrossRef]
- Thompson, A.J.; Banwell, B.L.; Barkhof, F.; Carroll, W.M.; Coetzee, T.; Comi, G.; Correale, J.; Fazekas, F.; Filippi, M.; Freedman, M.S.; et al. Diagnosis of multiple sclerosis: 2017 revisions of the McDonald criteria. Lancet Neurol. 2018, 17, 162–173. [Google Scholar] [CrossRef]
- Britze, J.; Frederiksen, J.L. Optical coherence tomography in multiple sclerosis. Eye 2018, 32, 884–888. [Google Scholar] [CrossRef]
- Garcia-Martin, E.; Pueyo, V.; Ara, J.R.; Almarcegui, C.; Martin, J.; Pablo, L.; Dolz, I.; Sancho, E.; Fernandez, F.J. Effect of optic neuritis on progressive axonal damage in multiple sclerosis patients. Mult. Scler. J. 2011, 17, 830–837. [Google Scholar] [CrossRef]
- Cujbă, L.; Banc, A.; Drugan, T.; Coadă, C.A.; Cristea, A.-P.; Stan, C.; Nicula, C. Homonymous Hemiatrophy of Macular Ganglion Cell Layer as a Marker of Retrograde Neurodegeneration in Multiple Sclerosis—A Narrative Review. Diagnostics 2024, 14, 1255. [Google Scholar] [CrossRef] [PubMed]
- Kupersmith, M.J.; Kardon, R.; Durbin, M.; Horne, M.; Shulman, J. Scanning Laser Polarimetry Reveals Status of RNFL Integrity in Eyes with Optic Nerve Head Swelling by OCT. Investig. Ophthalmol. Vis. Sci. 2012, 53, 1962. [Google Scholar] [CrossRef]
- Kupersmith, M.J.; Anderson, S.; Kardon, R. Predictive value of 1 month retinal nerve fiber layer thinning for deficits at 6 months after acute optic neuritis. Mult. Scler. J. 2013, 19, 1743–1748. [Google Scholar] [CrossRef] [PubMed]
- Kupersmith, M.J.; Garvin, M.K.; Wang, J.-K.; Durbin, M.; Kardon, R. Retinal ganglion cell layer thinning within one month of presentation for optic neuritis. Mult. Scler. J. 2015, 22, 641–648. [Google Scholar] [CrossRef]
- Panwar, N.; Huang, P.; Lee, J.; Keane, P.A.; Chuan, T.S.; Richhariya, A.; Teoh, S.; Lim, T.H.; Agrawal, R. Fundus Photography in the 21st Century—A Review of Recent Technological Advances and Their Implications for Worldwide Healthcare. Telemed. e-Health 2016, 22, 198–208. [Google Scholar] [CrossRef] [PubMed]
- Morales Domínguez, J.; Teherán Forero, Ó.L.; Ochoa-Díaz, M.M.; Ramos Clason, E.C. Validation of the color graduation scale in the optical nerve photograph, an alternative for qualitative classification. Arch. Soc. Esp. Oftalmol. Engl. Ed. 2022, 97, 381–385. [Google Scholar] [CrossRef]
- Midena, E.; Marchione, G.; Di Giorgio, S.; Rotondi, G.; Longhin, E.; Frizziero, L.; Pilotto, E.; Parrozzani, R.; Midena, G. Ultra-wide-field fundus photography compared to ophthalmoscopy in diagnosing and classifying major retinal diseases. Sci. Rep. 2022, 12, 19287. [Google Scholar] [CrossRef]
- Bambo, M.P.; Garcia-Martin, E.; Perez-Olivan, S.; Larrosa, J.M.; Polo, V.; Gonzalez-De la Rosa, M. Detecting Optic Atrophy in Multiple Sclerosis Patients Using New Colorimetric Analysis Software: From Idea to Application. Semin. Ophthalmol. 2014, 31, 459–462. [Google Scholar] [CrossRef]
- Ahn, S.J.; Kim, Y.H. Clinical Applications and Future Directions of Smartphone Fundus Imaging. Diagnostics 2024, 14, 1395. [Google Scholar] [CrossRef]
- Iqbal, U. Smartphone fundus photography: A narrative review. Int. J. Retin. Vitr. 2021, 7, 44. [Google Scholar] [CrossRef] [PubMed]
- Patel, T.P.; Kim, T.N.; Yu, G.; Dedania, V.S.; Lieu, P.; Qian, C.X.; Besirli, C.G.; Demirci, H.; Margolis, T.; Fletcher, D.A.; et al. Smartphone-Based, Rapid, Wide-Field Fundus Photography for Diagnosis of Pediatric Retinal Diseases. Transl. Vis. Sci. Technol. 2019, 8, 29. [Google Scholar] [CrossRef] [PubMed]
- Wintergerst, M.W.M.; Brinkmann, C.K.; Holz, F.G.; Finger, R.P. Undilated versus dilated monoscopic smartphone-based fundus photography for optic nerve head evaluation. Sci. Rep. 2018, 8, 10228. [Google Scholar] [CrossRef]
- Gelfand, J.M.; Goodin, D.S.; Boscardin, W.J.; Nolan, R.; Cuneo, A.; Green, A.J. Retinal Axonal Loss Begins Early in the Course of Multiple Sclerosis and Is Similar between Progressive Phenotypes. PLoS ONE 2012, 7, e36847. [Google Scholar] [CrossRef]
- Muntean, G.A.; Marginean, A.; Groza, A.; Damian, I.; Roman, S.A.; Hapca, M.C.; Muntean, M.V.; Nicoară, S.D. The Predictive Capabilities of Artificial Intelligence-Based OCT Analysis for Age-Related Macular Degeneration Progression—A Systematic Review. Diagnostics 2023, 13, 2464. [Google Scholar] [CrossRef] [PubMed]
- Danielescu, C.; Dabija, M.G.; Nedelcu, A.H.; Lupu, V.V.; Lupu, A.; Ioniuc, I.; Gîlcă-Blanariu, G.-E.; Donica, V.-C.; Anton, M.-L.; Musat, O. Automated Retinal Vessel Analysis Based on Fundus Photographs as a Predictor for Non-Ophthalmic Diseases—Evolution and Perspectives. J. Pers. Med. 2023, 14, 45. [Google Scholar] [CrossRef]
- Arian, R.; Aghababaei, A.; Soltanipour, A.; Khodabandeh, Z.; Rakhshani, S.; Iyer, S.B.; Ashtari, F.; Rabbani, H.; Kafieh, R. SLO-Net: Enhancing Multiple Sclerosis Diagnosis Beyond Optical Coherence Tomography Using Infrared Reflectance Scanning Laser Ophthalmoscopy Images. Transl. Vis. Sci. Technol. 2024, 13, 13. [Google Scholar] [CrossRef]
- Aghababaei, A.; Arian, R.; Soltanipour, A.; Ashtari, F.; Rabbani, H.; Kafieh, R. Discrimination of multiple sclerosis using scanning laser ophthalmoscopy images with autoencoder-based feature extraction. Mult. Scler. Relat. Disord. 2024, 88, 105743. [Google Scholar] [CrossRef]
- Thompson, A.C.; Jammal, A.A.; Medeiros, F.A. A Deep Learning Algorithm to Quantify Neuroretinal Rim Loss from Optic Disc Photographs. Am. J. Ophthalmol. 2019, 201, 9–18. [Google Scholar] [CrossRef]
- Yang, H.K.; Kim, Y.J.; Sung, J.Y.; Kim, D.H.; Kim, K.G.; Hwang, J.-M. Efficacy for Differentiating Nonglaucomatous Versus Glaucomatous Optic Neuropathy Using Deep Learning Systems. Am. J. Ophthalmol. 2020, 216, 140–146. [Google Scholar] [CrossRef]
- Mohammadi, S.; Gouravani, M.; Salehi, M.A.; Arevalo, J.F.; Galetta, S.L.; Harandi, H.; Frohman, E.M.; Frohman, T.C.; Saidha, S.; Sattarnezhad, N.; et al. Optical coherence tomography angiography measurements in multiple sclerosis: A systematic review and meta-analysis. J. Neuroinflamm. 2023, 20, 85. [Google Scholar] [CrossRef] [PubMed]
- Bostan, M.; Li, C.; Sim, Y.C.; Bujor, I.; Wong, D.; Tan, B.; Ismail, M.B.; Garhöfer, G.; Tiu, C.; Pirvulescu, R.; et al. Combining retinal structural and vascular measurements improves discriminative power for multiple sclerosis patients. Ann. N. Y. Acad. Sci. 2023, 1529, 72–83. [Google Scholar] [CrossRef] [PubMed]
- Pearson, T.; Chen, Y.; Dhillon, B.; Chandran, S.; van Hemert, J.; MacGillivray, T. Multi-modal retinal scanning to measure retinal thickness and peripheral blood vessels in multiple sclerosis. Sci. Rep. 2022, 12, 20472. [Google Scholar] [CrossRef]
- Xia, F.; Lin, J.L.; Zhang, D.L.; Shi, S.; Buscho, S.E.; Motamedi, M. Quantification of Leukocyte Trafficking in a Mouse Model of Multiple Sclerosis through In Vivo Imaging. EC Ophthalmol. 2022, 13, 2–10. [Google Scholar]
- Buscho, S.E.; Xia, F.; Shi, S.; Lin, J.L.; Szczesny, B.; Zhang, W.; Motamedi, M.; Liu, H. Non-Invasive Evaluation of Retinal Vascular Alterations in a Mouse Model of Optic Neuritis Using Laser Speckle Flowgraphy and Optical Coherence Tomography Angiography. Cells 2023, 12, 2685. [Google Scholar] [CrossRef] [PubMed]
- Davion, J.-B.; Lopes, R.; Drumez, É.; Labreuche, J.; Hadhoum, N.; Lannoy, J.; Vermersch, P.; Pruvo, J.-P.; Leclerc, X.; Zéphir, H.; et al. Asymptomatic optic nerve lesions: An underestimated cause of silent retinal atrophy in MS. Neurology 2020, 94, e2468–e2478. [Google Scholar] [CrossRef]
- Averseng-Peaureaux, D.; Mizzi, M.; Colineaux, H.; Mahieu, L.; Pera, M.C.; Brassat, D.; Chaix, Y.; Berard, E.; Deiva, K.; Cheuret, E. Paediatric optic neuritis: Factors leading to unfavourable outcome and relapses. Br. J. Ophthalmol. 2017, 102, 808–813. [Google Scholar] [CrossRef]


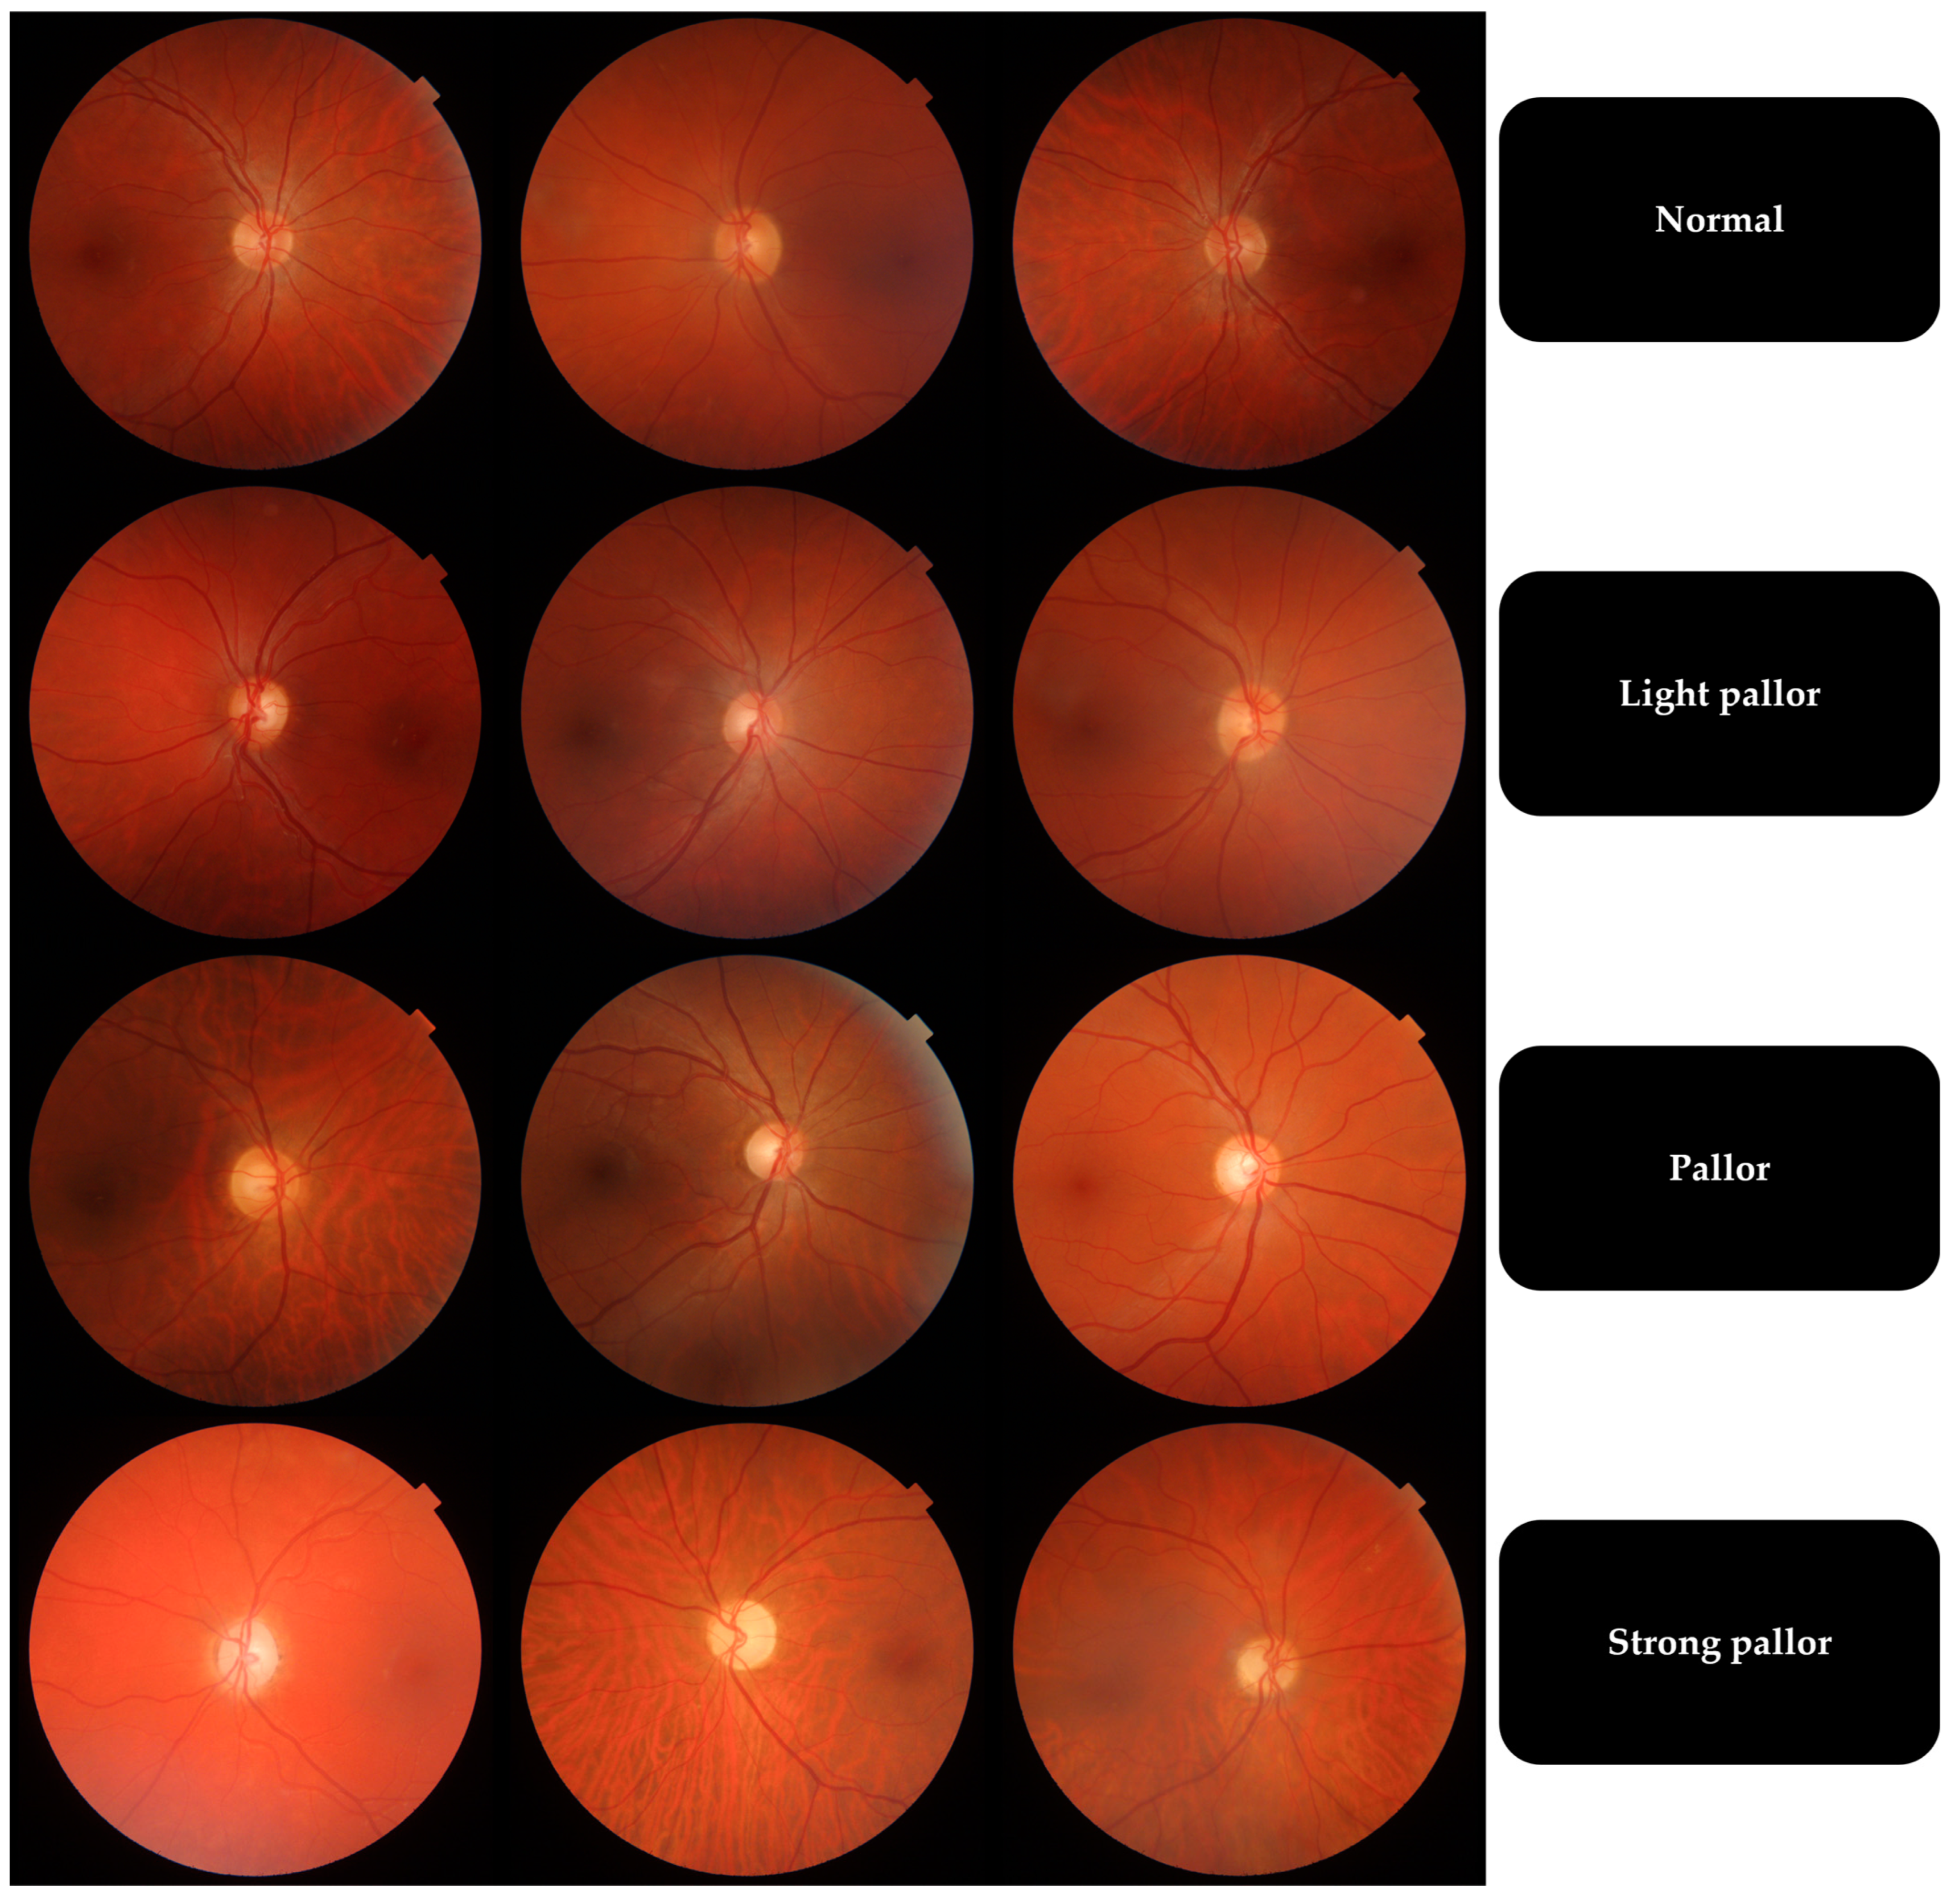
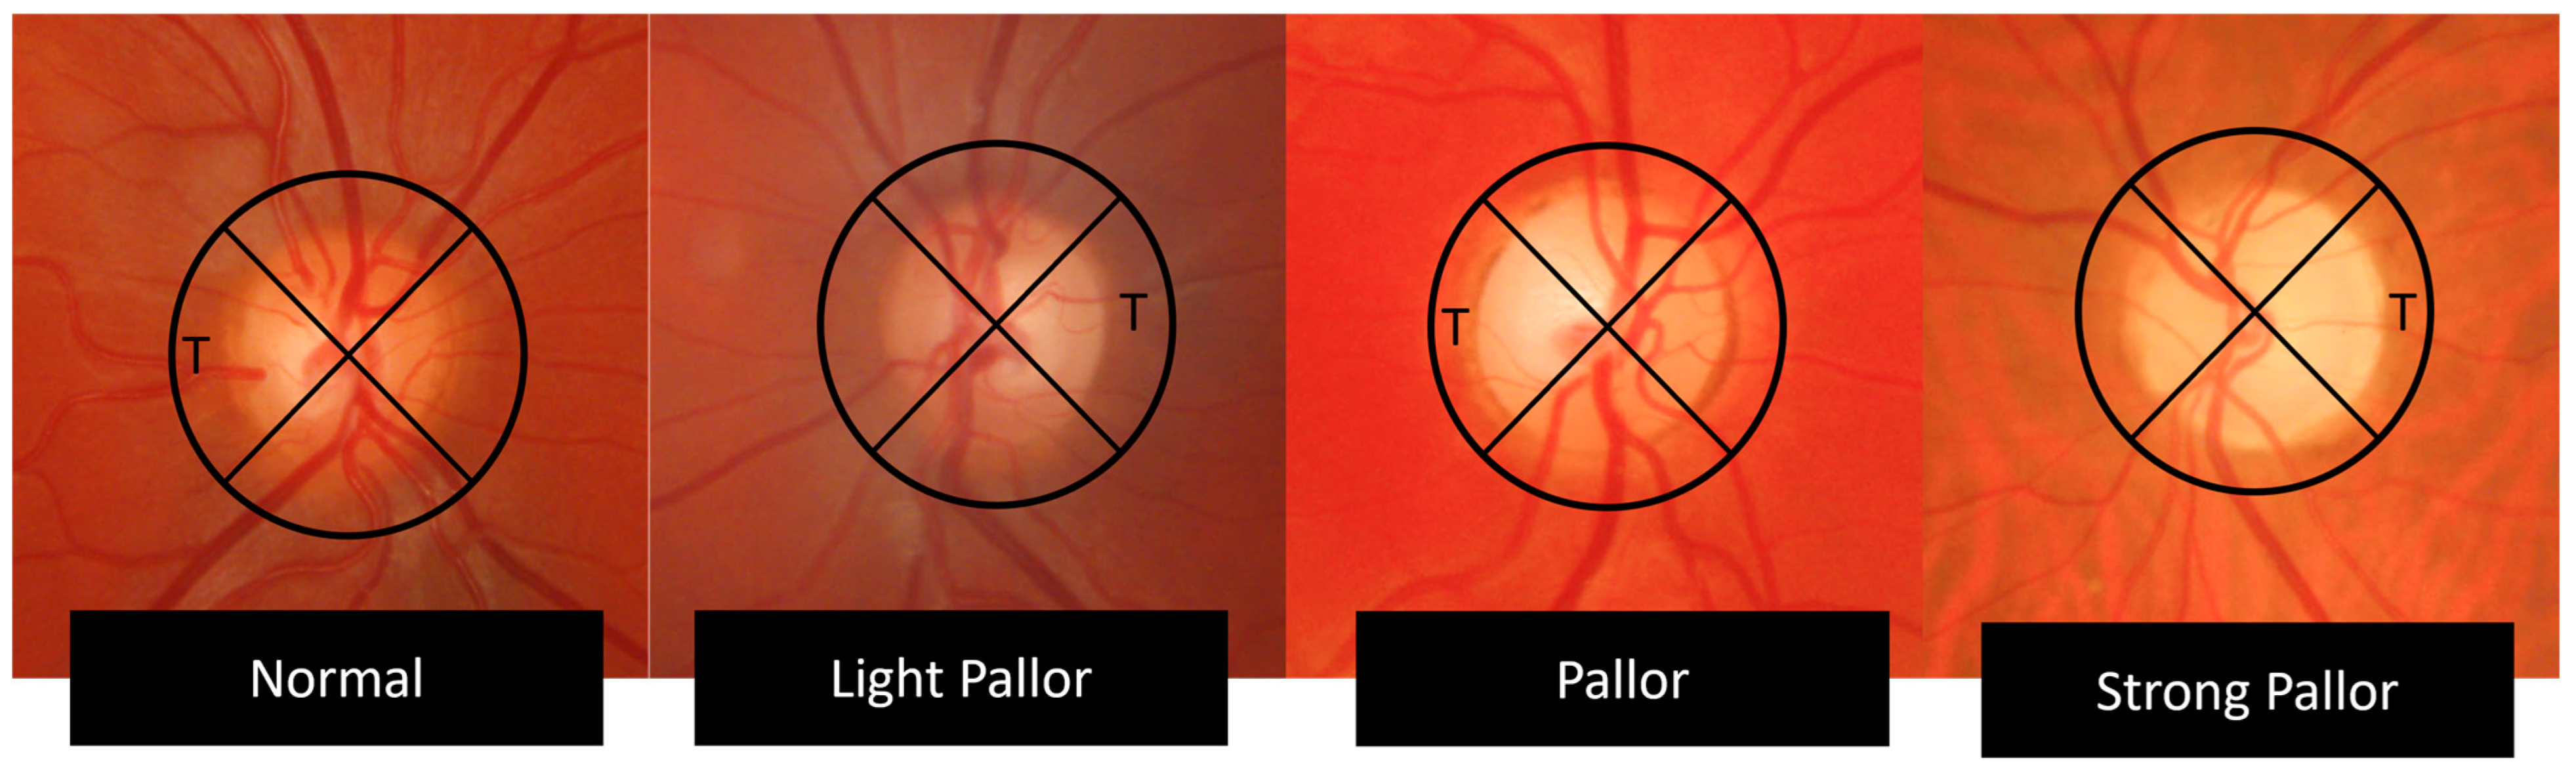
| Temporal Quadrant Color | Pallor Grade |
|---|---|
| Intense orange | Normal |
| Light orange | Light pallor |
| Yellow | Pallor |
| White, waxy aspect | Strong pallor |
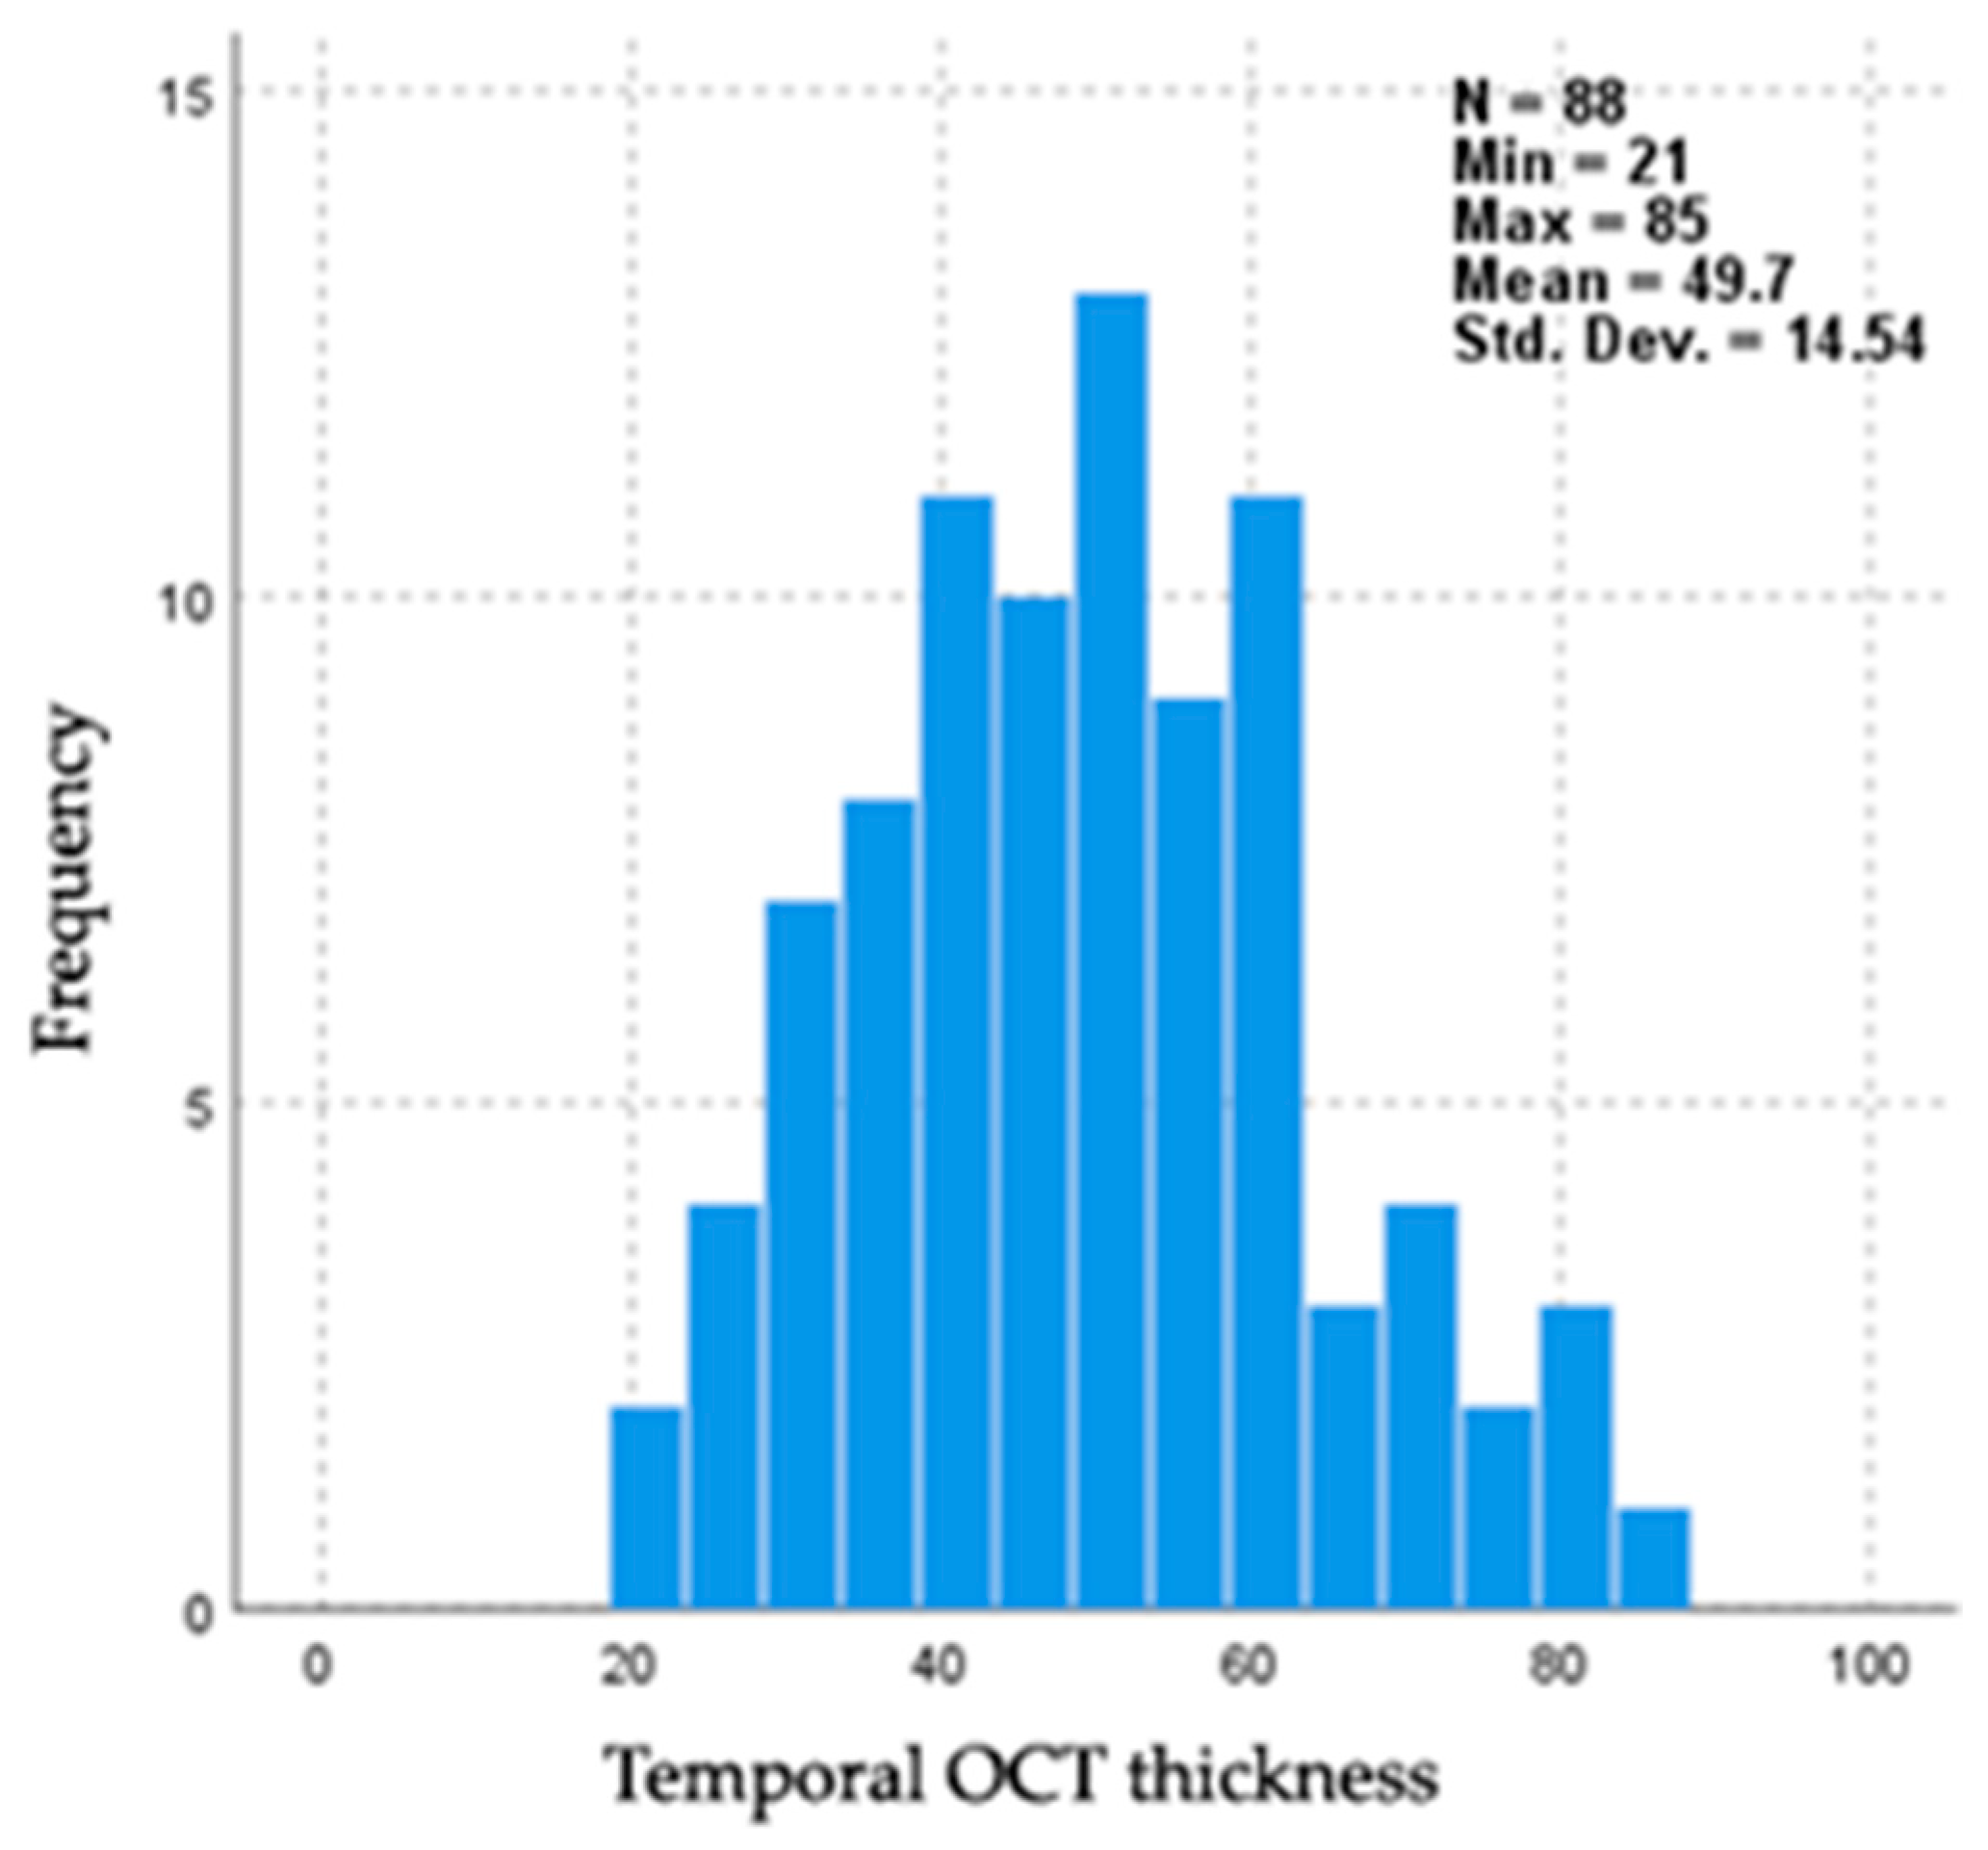
| Grade | n | Mean (µm) | Std. Deviation (µm) | Minimum (µm) | Maximum (µm) |
|---|---|---|---|---|---|
| Normal | 29 | 53.17 | 12.499 | 30 | 85 |
| Light pallor | 26 | 56.27 | 13.678 | 38 | 81 |
| Pallor | 24 | 42.75 | 11.349 | 22 | 60 |
| Strong pallor | 9 | 37.67 | 17.486 | 21 | 77 |
| Group Comparison | OCT Thickness Difference | Std. Error | p | Adjusted p |
|---|---|---|---|---|
| Strong pallor–Pallor | 9.715 | 9.981 | 0.330 | 1.000 |
| Strong pallor–Normal | 28.933 | 9.744 | 0.003 | 0.018 |
| Strong pallor–Light pallor | 32.47 | 9.876 | 0.001 | 0.006 |
| Pallor–Normal | 19.218 | 7.047 | 0.006 | 0.038 |
| Pallor–Light pallor | 22.755 | 7.229 | 0.002 | 0.010 |
| Normal–Light pallor | −3.537 | 6.897 | 0.608 | 1.000 |
Disclaimer/Publisher’s Note: The statements, opinions and data contained in all publications are solely those of the individual author(s) and contributor(s) and not of MDPI and/or the editor(s). MDPI and/or the editor(s) disclaim responsibility for any injury to people or property resulting from any ideas, methods, instructions or products referred to in the content. |
© 2025 by the authors. Licensee MDPI, Basel, Switzerland. This article is an open access article distributed under the terms and conditions of the Creative Commons Attribution (CC BY) license (https://creativecommons.org/licenses/by/4.0/).
Share and Cite
Donica, V.C.; Danielescu, C.; Alexa, A.I.; Pavel, I.A.; Donica, A.L.; Grosu, C.; Sandu, C.A.; Bogdănici, C.M. Evaluating Fundoscopy as a Screening Tool for Optic Nerve Atrophy in Multiple Sclerosis: An Optical Coherence Tomography (OCT) Comparative Study. J. Clin. Med. 2025, 14, 2166. https://doi.org/10.3390/jcm14072166
Donica VC, Danielescu C, Alexa AI, Pavel IA, Donica AL, Grosu C, Sandu CA, Bogdănici CM. Evaluating Fundoscopy as a Screening Tool for Optic Nerve Atrophy in Multiple Sclerosis: An Optical Coherence Tomography (OCT) Comparative Study. Journal of Clinical Medicine. 2025; 14(7):2166. https://doi.org/10.3390/jcm14072166
Chicago/Turabian StyleDonica, Vlad Constantin, Ciprian Danielescu, Anisia Iuliana Alexa, Irina Andreea Pavel, Alexandra Lori Donica, Cristina Grosu, Călina Anda Sandu, and Camelia Margareta Bogdănici. 2025. "Evaluating Fundoscopy as a Screening Tool for Optic Nerve Atrophy in Multiple Sclerosis: An Optical Coherence Tomography (OCT) Comparative Study" Journal of Clinical Medicine 14, no. 7: 2166. https://doi.org/10.3390/jcm14072166
APA StyleDonica, V. C., Danielescu, C., Alexa, A. I., Pavel, I. A., Donica, A. L., Grosu, C., Sandu, C. A., & Bogdănici, C. M. (2025). Evaluating Fundoscopy as a Screening Tool for Optic Nerve Atrophy in Multiple Sclerosis: An Optical Coherence Tomography (OCT) Comparative Study. Journal of Clinical Medicine, 14(7), 2166. https://doi.org/10.3390/jcm14072166