
Accuracy of the “Timed Up and Go” Test for Predicting Low Muscle Mass in a Preoperative Prehabilitation Program for Colorectal Cancer

 , , , , , , ,
Abstract
1. Introduction
2. Materials and Methods
2.1. Patient Selection
2.1.1. Inclusion Criteria
- Aged 18 years or older.
- Provided written informed consent to participate.
- Undergoing elective surgery with colon or rectum resection for CRC.
- Pathological stage I-III.
- Attended a prehabilitation consultation at least four weeks before surgery.
- Underwent the “Timed Up and Go” (TUG) test.
- Underwent a computed tomography (CT) scan for presarcopenia assessment.
2.1.2. Exclusion Criteria
- Emergency surgery.
- Pathological stage IV CRC.
- Missing essential clinical data (e.g., weight, height).
- Contraindication for CT scan.
- Patients with severe mobility impairments preventing the performance of the TUG test, defined as those unable to stand up from a chair without assistance or walk a minimum distance of 3 m.
- Cognitive or language barriers preventing the comprehension of TUG test instructions.
2.2. Prehabilitation Consultation
- Anthropometric measurements: Body weight (kg) and height (m) were recorded to calculate Body Mass Index (BMI, kg/m2), categorized as follows for older adults:
- ○
- Underweight: <18.5 kg/m2;
- ○
- Normal weight: 18.5–24.9 kg/m2;
- ○
- Overweight: 25.0–29.9 kg/m2;
- ○
- Obese: ≥30.0 kg/m2.
- Prehabilitation counselling: Patients received education on trimodal prehabilitation, which included nutrition, physical exercise, and psychological strategies for anxiety control.
- Functional and body composition assessments:
- ○
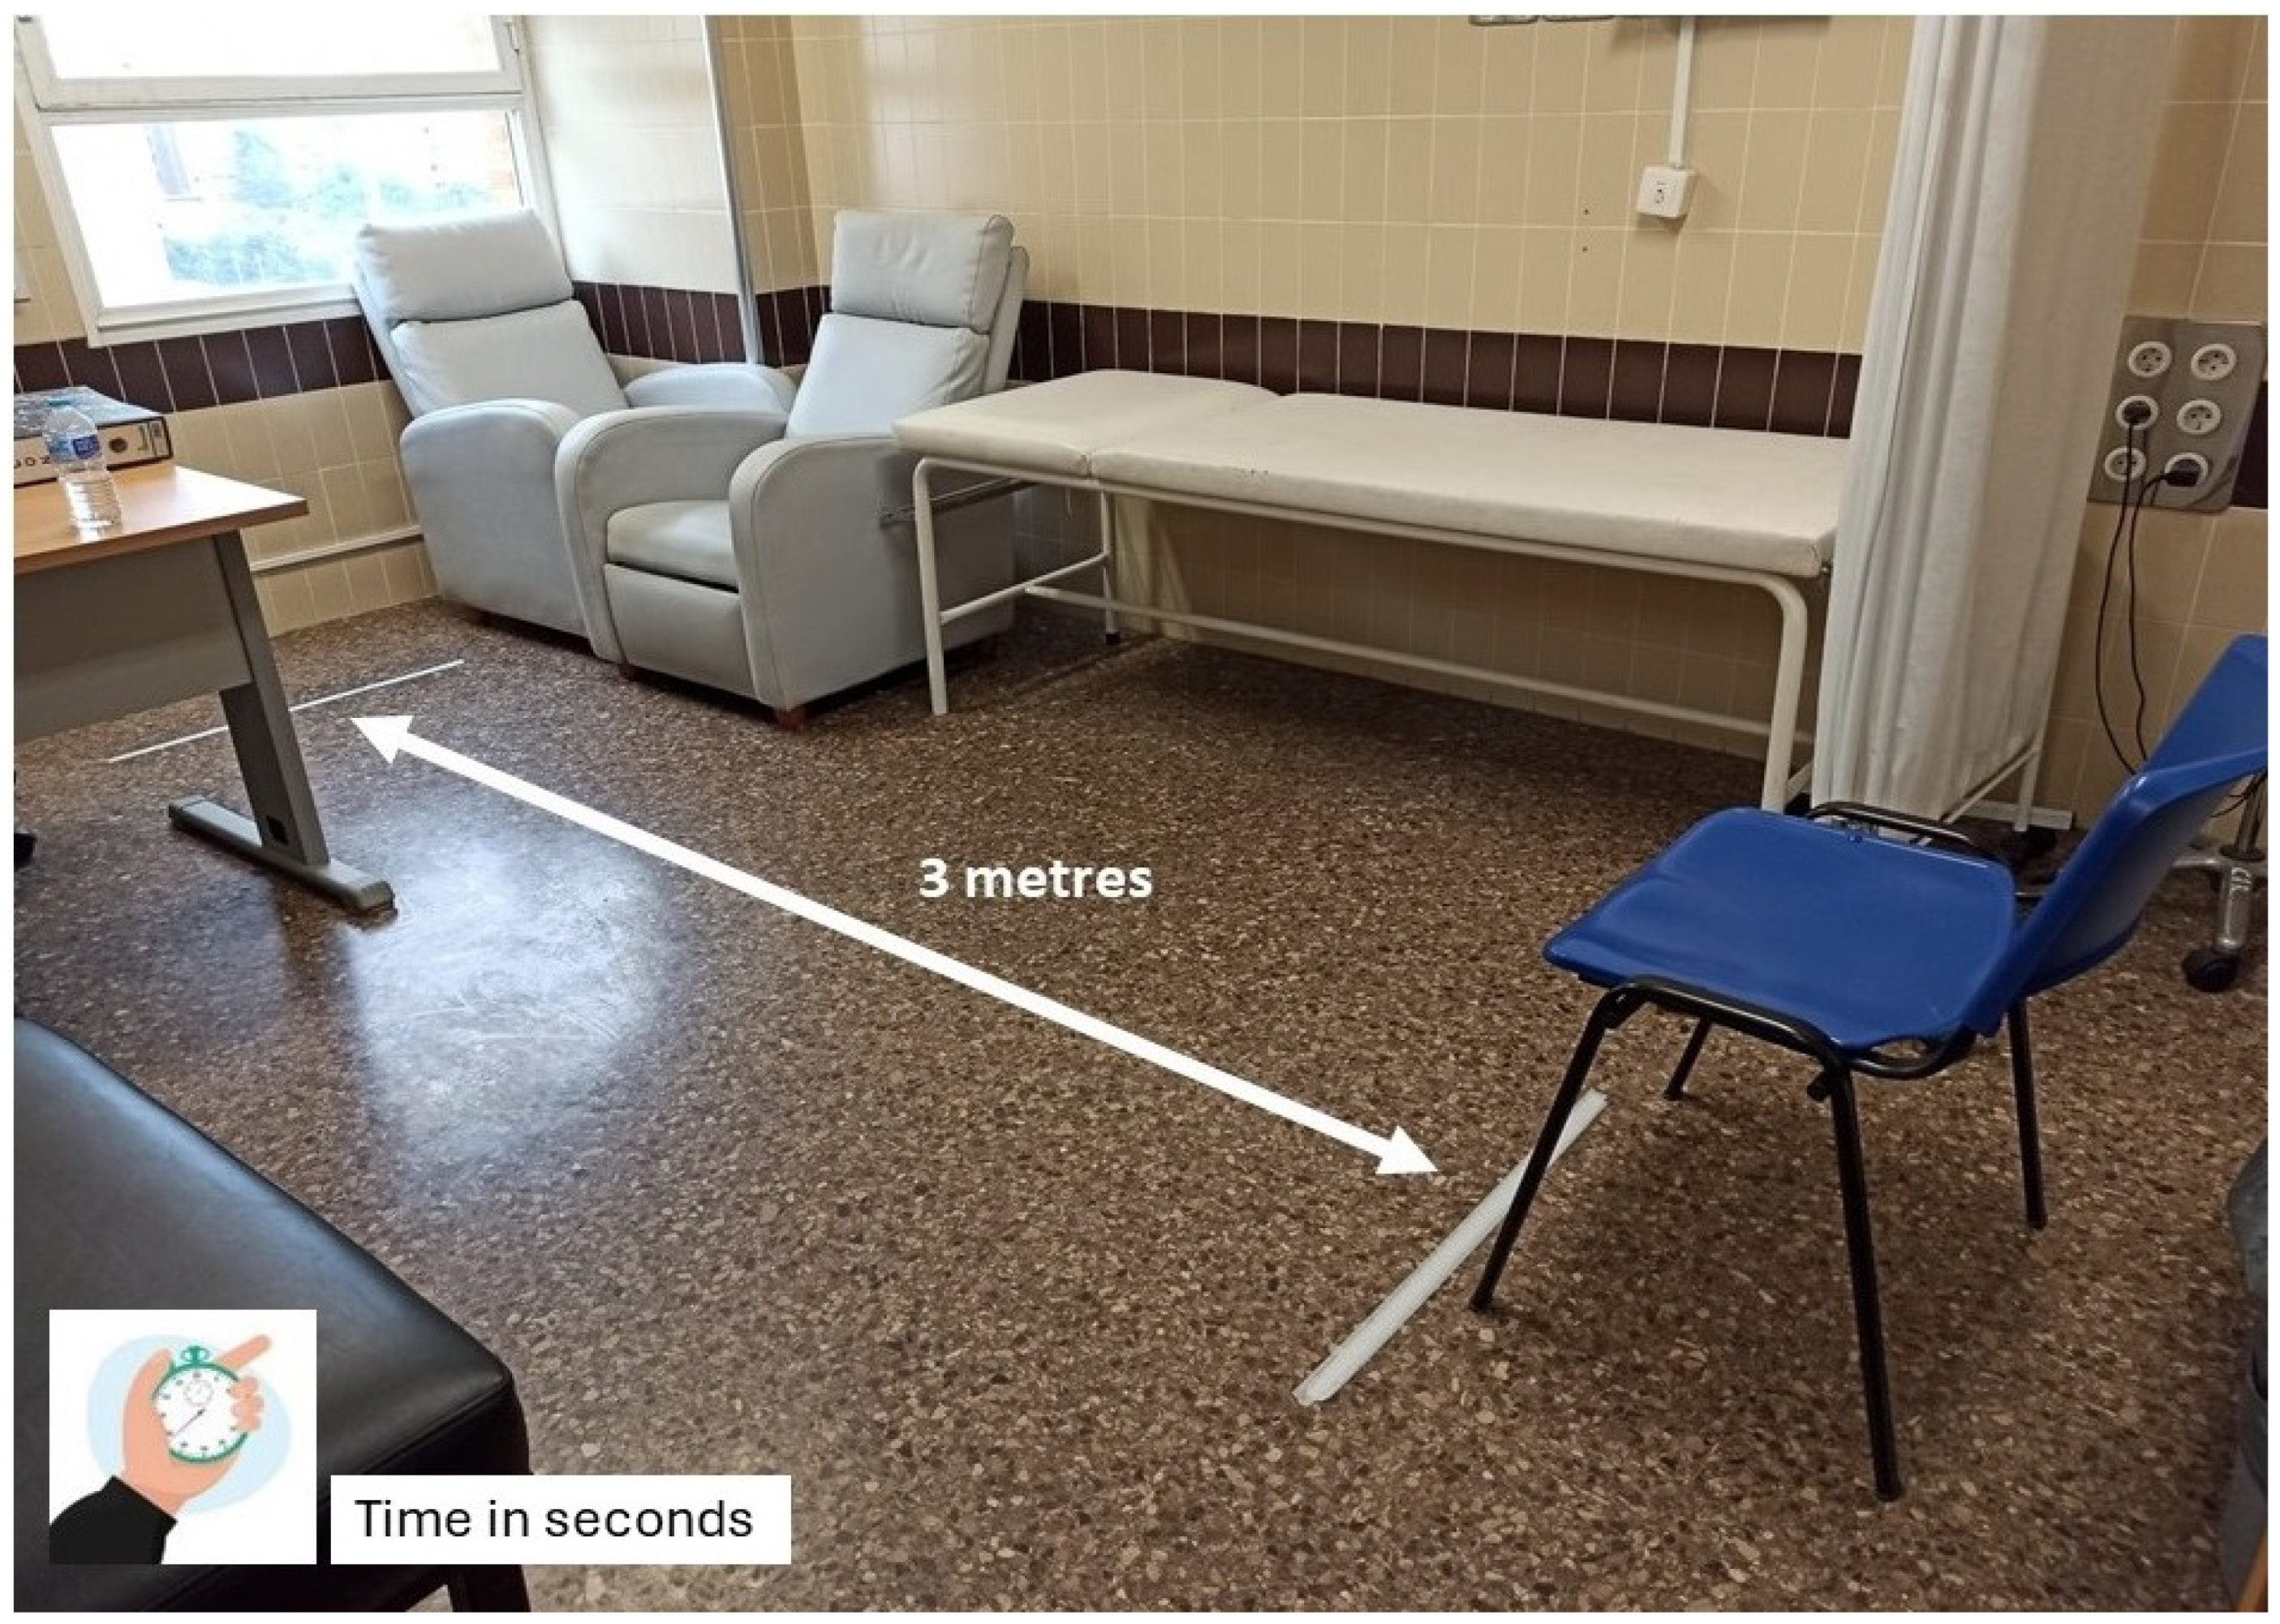
- TUG test
- The patient sitting in a chair with armrests, positioned against a wall to ensure consistency.
- Standing up without external assistance, following a verbal instruction.
- Walking a distance of 3 m on a flat, unobstructed surface at a comfortable, self-selected pace.
- Returning to the starting position and sitting back down.
- ○
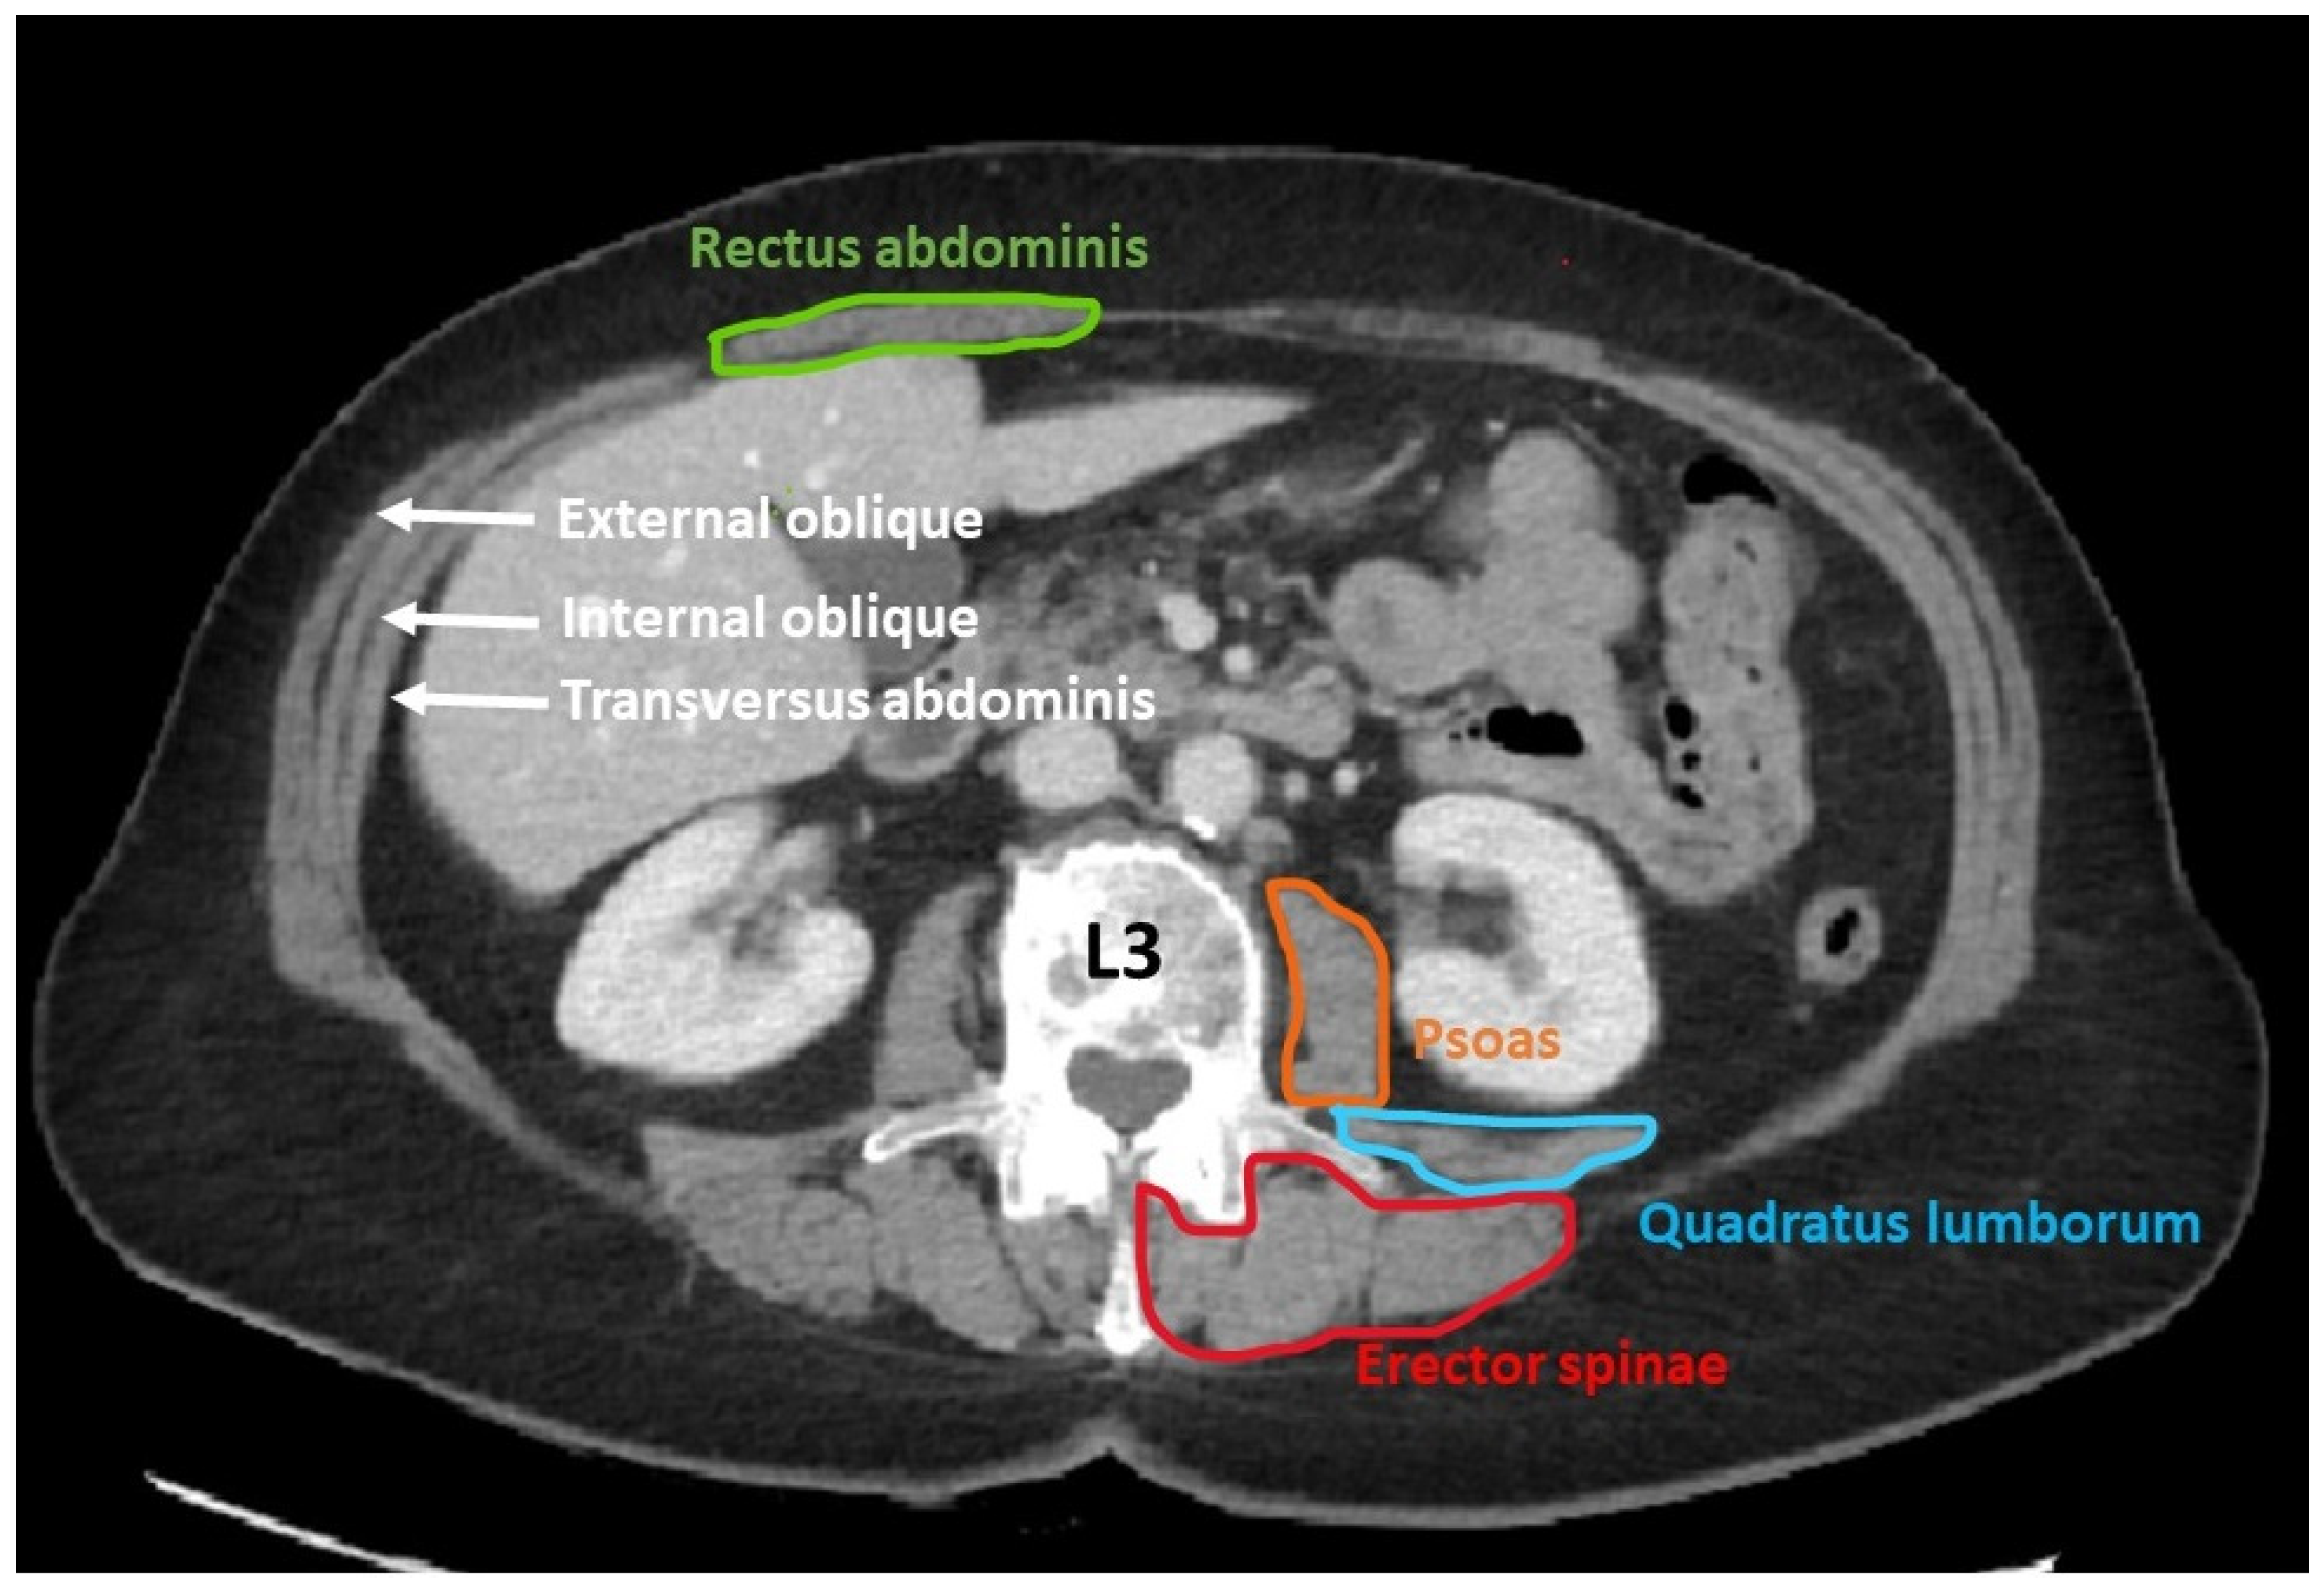
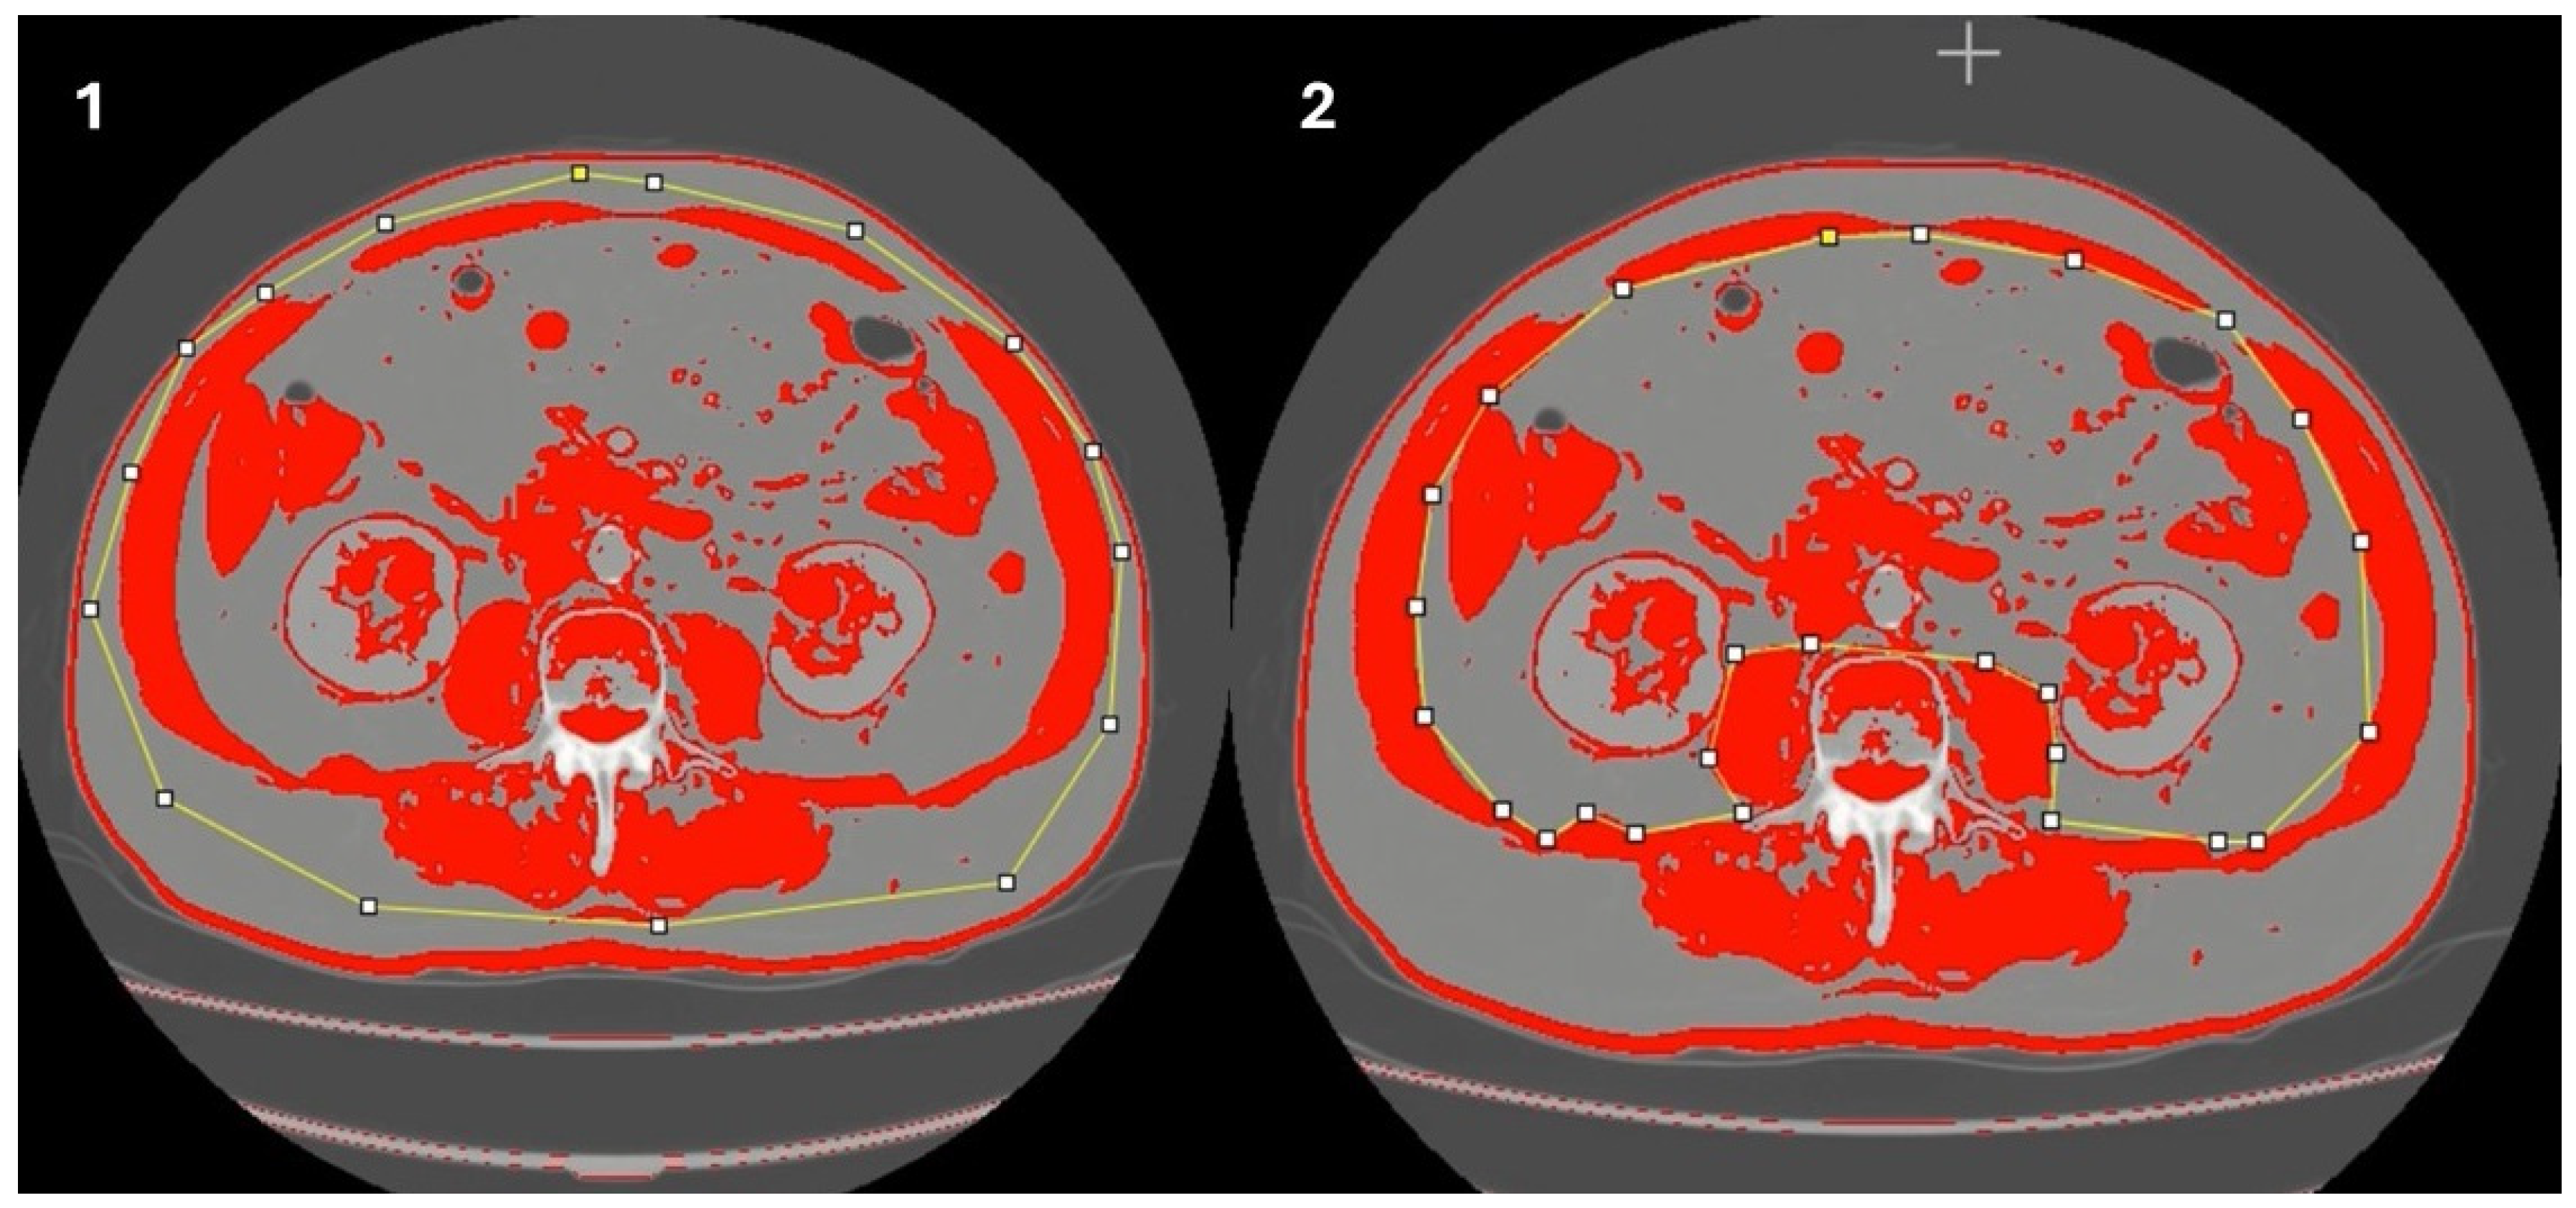
- Determination of muscle mass using computed tomography (CT scan)
2.3. Statistical Analysis
2.4. Ethical Considerations
3. Results
Patient Characteristics
4. Discussion
5. Conclusions
Author Contributions
Funding
Institutional Review Board Statement
Informed Consent Statement
Data Availability Statement
Conflicts of Interest
References
- Bray, F.; Ferlay, J.; Soerjomataram, I.; Siegel, R.L.; Torre, L.A.; Jemal, A. Global cancer statistics 2018: GLOBOCAN estimates of incidence and mortality worldwide for 36 cancers in 185 countries. CA Cancer J. Clin. 2018, 68, 394–424. [Google Scholar] [CrossRef] [PubMed]
- Huang, D.-D.; Wang, S.-L.; Zhuang, C.-L.; Zheng, B.-S.; Lu, J.-X.; Chen, F.-F.; Zhou, C.; Shen, X.; Yu, Z. Sarcopenia, as defined by low muscle mass, strength and physical performance, predicts complications after surgery for colorectal cancer. Color. Dis. 2015, 17, O256–O264. [Google Scholar] [CrossRef] [PubMed]
- Flynn, D.E.; Mao, D.; Yerkovich, S.T.; Franz, R.; Iswariah, H.; Hughes, A.; Shaw, I.M.; Tam, D.P.L.; Chandrasegaram, M.D. The impact of comorbidities on post-operative complications following colorectal cancer surgery. PLoS ONE 2020, 15, e0243995. [Google Scholar] [CrossRef] [PubMed]
- Martin, L.; Senesse, P.; Gioulbasanis, I.; Antoun, S.; Bozzetti, F.; Deans, C.; Strasser, F.; Thoresen, L.; Jagoe, R.T.; Chasen, M.; et al. Diagnostic Criteria for the Classification of Cancer-Associated Weight Loss. J. Clin. Oncol. 2015, 33, 90–99. [Google Scholar] [CrossRef]
- Fernández López, M.T.; Saenz Fernández, C.A.; de Sás Prada, M.T.; Alonso Urrutia, S.; Bardasco Alonso, M.L.; Alves Pérez, M.T.; Rivero Luis, M.T.; Alvarez Vázquez, P.; Mato Mato, J.A. Malnutrition in patients with cancer; four years experience. Nutr. Hosp. 2013, 28, 372–381. [Google Scholar]
- Gomes, F.M.; Santos, K.T.d.O.; da Silva, S.M.E.; Pinho, C.P.S.; Silva, A. Fragilidad en ancianos oncológicos en tratamiento con quimioterapia. Rev. Chil. Nutr. 2019, 46, 384–391. [Google Scholar] [CrossRef]
- Lamperti, M.; Romero, C.S.; Guarracino, F.; Cammarota, G.; Vetrugno, L.; Tufegdzic, B.; Lozsan, F.; Macias Frias, J.J.; Duma, A.; Bock, M.; et al. Preoperative assessment of adults undergoing elective noncardiac surgery: Updated guidelines from the European Society of Anaesthesiology and Intensive Care. Eur. J. Anaesthesiol. 2025, 42, 1–35. [Google Scholar] [CrossRef] [PubMed]
- Levolger, S.; van Vugt, J.L.A.; de Bruin, R.W.F.; IJzermans, J.N.M. Systematic review of sarcopenia in patients operated on for gastrointestinal and hepatopancreatobiliary malignancies. Br. J. Surg. 2015, 102, 1448–1458. [Google Scholar] [CrossRef]
- Vergara-Fernandez, O.; Trejo-Avila, M.; Salgado-Nesme, N. Sarcopenia in patients with colorectal cancer: A comprehensive review. World J. Clin. Cases 2020, 8, 1188–1202. [Google Scholar] [CrossRef]
- Cruz-Jentoft, A.J.; Bahat, G.; Bauer, J.; Boirie, Y.; Bruyère, O.; Cederholm, T.; Cooper, C.; Landi, F.; Rolland, Y.; Sayer, A.A.; et al. Sarcopenia: Revised European consensus on definition and diagnosis. Age Ageing 2019, 48, 16–31. [Google Scholar] [CrossRef]
- Martinez, B.P.; Gomes, I.B.; Oliveira CS de Ramos, I.R.; Rocha, M.D.M.; Forgiarini Júnior, L.A.; Camelier, F.W.R.; Camelier, A.A. Accuracy of the Timed Up and Go test for predicting sarcopenia in elderly hospitalized patients. Clinics 2015, 70, 369–372. [Google Scholar] [CrossRef] [PubMed]
- Simonsen, C.; de Heer, P.; Bjerre, E.D.; Suetta, C.; Hojman, P.; Pedersen, B.K.; Svendsen, L.B.; Christensen, J.F. Sarcopenia and postoperative complication risk in gastrointestinal surgical oncology: A meta-analysis. Ann. Surg. 2018, 268, 58–69. [Google Scholar] [CrossRef] [PubMed]
- Lieffers, J.R.; Bathe, O.F.; Fassbender, K.; Winget, M.; Baracos, V.E. Sarcopenia is associated with postoperative infection and delayed recovery from colorectal cancer resection surgery. Br. J. Cancer 2012, 107, 931–936. [Google Scholar] [CrossRef]
- Weerink, L.B.M.; van der Hoorn, A.; van Leeuwen, B.L.; de Bock, G.H. Low skeletal muscle mass and postoperative morbidity in surgical oncology: A systematic review and meta-analysis. J. Cachexia Sarcopenia Muscle 2020, 11, 636–649. [Google Scholar] [CrossRef]
- Prado, C.M.M.; Birdsell, L.A.; Baracos, V.E. The emerging role of computerized tomography in assessing cancer cachexia. Curr. Opin. Support. Palliat. Care 2009, 3, 269–275. [Google Scholar] [CrossRef]
- Lee, C.S.; Won, D.D.; Oh, S.N.; Lee, Y.S.; Lee, I.K.; Kim, I.-H.; Choi, M.H.; Oh, S.T. Prognostic role of pre-sarcopenia and body composition with long-term outcomes in obstructive colorectal cancer: A retrospective cohort study. World J. Surg. Oncol. 2020, 18, 230. [Google Scholar] [CrossRef]
- Podsiadlo, D.; Richardson, S. The timed “up & go”: A test of basic functional mobility for frail elderly persons. J. Am. Geriatr. Soc. 1991, 39, 142–148. [Google Scholar]
- Gomez-Perez, S.L.; Haus, J.M.; Sheean, P.; Patel, B.; Mar, W.; Chaudhry, V.; McKeever, L.; Braunschweig, C. Measuring abdominal circumference and skeletal muscle from a single cross-sectional computed tomography image: A step-by-step guide for clinicians using National Institutes of Health ImageJ: A step-by-step guide for clinicians using national institutes of health ImageJ. JPEN J. Parenter. Enter. Nutr. 2016, 40, 308–318. [Google Scholar]
- Falsarella, G.R.; Coimbra, I.B.; Barcelos, C.C.; Iartelli, I.; Montedori, K.T.; Santos, M.N.J.; Neri, A.L.; Coimbra, A.M. Influence of muscle mass and bone mass on the mobility of elderly women: An observational study. BMC Geriatr. 2014, 14, 13. [Google Scholar] [CrossRef]
- Nicolini-Panisson, R.D.; Donadio, M.V.F. Timed “Up & Go” test in children and adolescents. Rev. Paul. Pediatr. 2013, 31, 377–383. [Google Scholar]
- Alexandre, T.S.; Meira, D.M.; Rico, N.C.; Mizuta, S.K. Accuracy of Timed Up and Go Test for screening risk of falls among community-dwelling elderly. Rev. Bras. Fisioter. 2012, 16, 381–388. [Google Scholar] [CrossRef] [PubMed]
- Giné-Garriga, M.; Guerra, M.; Marí-Dell’Olmo, M.; Martin, C.; Unnithan, V.B. Sensitivity of a modified version of the “timed get up and go” test to predict fall risk in the elderly: A pilot study. Arch. Gerontol. Geriatr. 2009, 49, e60–e66. [Google Scholar] [CrossRef] [PubMed]
- Shumway-Cook, A.; Brauer, S.; Woollacott, M. Predicting the probability for falls in community-dwelling older adults using the Timed Up & Go Test. Phys. Ther. 2000, 80, 896–903. [Google Scholar]
- Brown, J.C.; Caan, B.J.; Cespedes Feliciano, E.M.; Xiao, J.; Weltzien, E.; Prado, C.M.; Kroenke, C.H.; Castillo, A.; Kwan, M.L.; Meyerhardt, J.A. Weight stability masks changes in body composition in colorectal cancer: A retrospective cohort study. Am. J. Clin. Nutr. 2021, 113, 1482–1489. [Google Scholar] [CrossRef]
- Abidin, Z.U.; Naqvi, R.A.; Haider, A.; Kim, H.S.; Jeong, D.; Lee, S.W. Recent deep learning-based brain tumor segmentation models using multi-modality magnetic resonance imaging: A prospective survey. Front. Bioeng. Biotechnol. 2024, 12, 1392807. [Google Scholar] [CrossRef] [PubMed] [PubMed Central]
- Rahmati, M.; Lee, S.; Yon, D.K.; Lee, S.W.; Udeh, R.; McEvoy, M.; Oh, H.; Butler, L.; Keyes, H.; Barnett, Y.; et al. Physical activity and prevention of mental health complications: An umbrella review. Neurosci. Biobehav. Rev. 2024, 160, 105641. [Google Scholar] [CrossRef] [PubMed]


| Variable | Value |
|---|---|
| Age (years) | 71.76 (51) |
| WC (cm) | 105.85 ± 14.50 |
| SMM (cm2) | 129.88 ± 33.28 |
| SMI (cm2/m2) | 47.99 ± 10.37 |
| Weight (kg) | 74.13 ± 14.69 |
| Height (m) | 1.64 ± 0.90 |
| BMI (kg/m2) | 27.46 ± 4.71 |
| TUG test (s) | 12.52 ± 7.95 |
| Variable | Timed Get Up and Go ≥ 10.19 s | Timed Get Up and Go < 10.19 s | p-Valour |
|---|---|---|---|
| Age (years) | 77.51 ± 8,00 | 67.47 ± 9.96 | <0.001 |
| SMM (cm2) | 119.78 ± 30.59 | 137.41 ± 33.33 | <0.001 |
| SMI (cm2/m2) | 44.77 ± 9.37 | 50.39 ± 10.46 | <0.001 |
| Height (kg) | 74.1 ± 14.70 | 74.15 ± 14.74 | 0.98 |
| Weight (m) | 1.62 ± 0.09 | 1.64 ± 0.09 | 0.10 |
| BMI (kg/m2) | 27.81 ± 4.62 | 27.19 ± 4.77 | 0.36 |
Disclaimer/Publisher’s Note: The statements, opinions and data contained in all publications are solely those of the individual author(s) and contributor(s) and not of MDPI and/or the editor(s). MDPI and/or the editor(s) disclaim responsibility for any injury to people or property resulting from any ideas, methods, instructions or products referred to in the content. |
© 2025 by the authors. Licensee MDPI, Basel, Switzerland. This article is an open access article distributed under the terms and conditions of the Creative Commons Attribution (CC BY) license (https://creativecommons.org/licenses/by/4.0/).
Share and Cite
Pérez-Santiago, L.; Garzón-Hernández, L.P.; Martín-Arévalo, J.; Pla-Martí, V.; Moro-Valdezate, D.; Casado-Rodrigo, D.; Riera-Cardona, M.; Tarazona, N.; Muresan, B.T.; Wu Xiong, N.Y.; et al. Accuracy of the “Timed Up and Go” Test for Predicting Low Muscle Mass in a Preoperative Prehabilitation Program for Colorectal Cancer. J. Clin. Med. 2025, 14, 2088. https://doi.org/10.3390/jcm14062088
Pérez-Santiago L, Garzón-Hernández LP, Martín-Arévalo J, Pla-Martí V, Moro-Valdezate D, Casado-Rodrigo D, Riera-Cardona M, Tarazona N, Muresan BT, Wu Xiong NY, et al. Accuracy of the “Timed Up and Go” Test for Predicting Low Muscle Mass in a Preoperative Prehabilitation Program for Colorectal Cancer. Journal of Clinical Medicine. 2025; 14(6):2088. https://doi.org/10.3390/jcm14062088
Chicago/Turabian StylePérez-Santiago, Leticia, Luisa Paola Garzón-Hernández, José Martín-Arévalo, Vicente Pla-Martí, David Moro-Valdezate, David Casado-Rodrigo, Marina Riera-Cardona, Noelia Tarazona, Bianca Tabita Muresan, Ning Yun Wu Xiong, and et al. 2025. "Accuracy of the “Timed Up and Go” Test for Predicting Low Muscle Mass in a Preoperative Prehabilitation Program for Colorectal Cancer" Journal of Clinical Medicine 14, no. 6: 2088. https://doi.org/10.3390/jcm14062088
APA StylePérez-Santiago, L., Garzón-Hernández, L. P., Martín-Arévalo, J., Pla-Martí, V., Moro-Valdezate, D., Casado-Rodrigo, D., Riera-Cardona, M., Tarazona, N., Muresan, B. T., Wu Xiong, N. Y., Espí-Macías, A., & García-Botello, S. (2025). Accuracy of the “Timed Up and Go” Test for Predicting Low Muscle Mass in a Preoperative Prehabilitation Program for Colorectal Cancer. Journal of Clinical Medicine, 14(6), 2088. https://doi.org/10.3390/jcm14062088