Article

Effect of Oral Microbiota Composition on Metabolic Dysfunction-Associated Steatotic Liver Disease in the General Population

1
Department of Gastroenterology, Hematology, and Clinical Immunology, Hirosaki University Graduate School of Medicine, Hirosaki 036-8562, Japan
2
Division of Endoscopy, Hirosaki University Graduate School of Medicine, Hirosaki 036-8562, Japan
3
Department of Preemptive Medicine, Hirosaki University Graduate School of Medicine, Hirosaki 036-8562, Japan
*
Author to whom correspondence should be addressed.
J. Clin. Med. 2025, 14(6), 2013; https://doi.org/10.3390/jcm14062013
Submission received: 5 February 2025 / Revised: 24 February 2025 / Accepted: 14 March 2025 / Published: 16 March 2025
(This article belongs to the Section Gastroenterology & Hepatopancreatobiliary Medicine)

Abstract

:
Background/Objective: This study investigated the relationship between the composition of oral microbiota and metabolic dysfunction-associated steatotic liver disease (MASLD) in the general population. Methods: In total, 712 participants in a health check-up project were divided into four oral microbiota patterns by principal component analysis and cluster analysis; they were included in Neisseria, Streptococcus, Fusobacterium, and Veillonella groups. The Neisseria group had the largest number of patients and was used as a reference group to compare the incidence of MASLD and cardiometabolic criteria with the other groups. Results: In a multivariate analysis, the Veillonella group was a risk factor for MASLD independent of cardiometabolic criteria compared with the Neisseria group. The correlation between oral bacterial species and MASLD-related items showed that Neisseria was negatively correlated with controlled attenuation parameters, body mass index, waist circumference, hemoglobin A1c, alanine aminotransferase, and fatty liver index. Veillonella showed a positive correlation with controlled attenuation parameters, waist circumference, body mass index, blood pressure, triglycerides, alanine aminotransferase, aspartate aminotransferase, gamma-glutamyl transpeptidase, and fatty liver index, and a negative correlation with high-density lipoprotein cholesterol. In contrast, the Streptococcus and Fusobacterium groups were not clearly associated with MASLD. Conclusions: Maintaining oral hygiene and preventing periodontitis may contribute to preventing MASLD and extending a healthy lifespan.

1. Introduction

Fatty liver is asymptomatic; however, it can cause cardiovascular disease and hepatitis, and it is a risk factor for cirrhosis and liver cancer. Furthermore, recent studies have shown that fatty liver is not only associated with obesity but also with diabetes, dyslipidemia, hypertension, and atherosclerosis. Fatty liver is considered a hepatic phenotype of lifestyle-related diseases [1,2,3]. Fatty liver disease without drinking habits was previously called non-alcoholic fatty liver disease (NAFLD), but the name was changed to metabolic dysfunction-associated steatotic liver disease (MASLD) in 2023 [4]. With the name change from NAFLD to MASLD, the diagnostic criteria now specify that a patient must meet ≥1 of 5 cardiometabolic criteria (obesity, hypertension, diabetes, high-density lipoprotein [HDL] cholesterol, and high triglycerides), which is more closely related to lifestyle-related diseases. The link to lifestyle-related diseases has been deepened. Metabolic dysfunction-associated steatotic liver disease, a lifestyle-related disease, is on the increase worldwide, with a prevalence of 30% [5]. In contrast, periodontitis affects 20–50% of the world’s population and has been linked to diabetes and cardiovascular disease [6,7,8]. The oral environment is also involved in neurodegenerative diseases such as Parkinson’s disease [9]. Additionally, patients with MASLD have a higher risk of periodontitis [10]. Periodontitis is not only involved in the onset and progression of various lifestyle-related diseases but also a lifestyle-related disease that is associated with lifestyle habits, such as poor oral hygiene and smoking. Both MASLD and periodontal disease are lifestyle-related diseases that have been attracting attention in recent years, and prevention of both conditions is important in extending healthy life expectancy.
Numerous prior studies have demonstrated a significant association between the oral microbiota and MASLD [11]. Immunogenic factors, such as lipopolysaccharides and oral pathogenic bacteria from a periodontitis tissue, enter the liver hematogenously and contribute to the onset and progression of MASLD [12,13]. Additionally, host cells in the periodontal ligament triggered by the immune response to biofilm bacterium increase reactive oxygen species and inflammatory cytokines, such as tumor necrosis factor-alpha (TNF-α), IL-6, and interleukin (IL)-1β, which are related in MASLD development [14]. A mechanism has also been proposed in which MASLD develops as a result of dysbiosis caused by the migration of oral bacteria into the gut due to decreased gastric acid secretion. [11].
Although many previous studies have investigated the relationship between oral microbiota and fatty liver disease, there are still few epidemiological studies that have gone into a relationship with the cardiometabolic criteria following the change in the disease name from NAFLD to MASLD. Additionally, it is important to investigate the influence of oral microflora patterns on MASLD, in general, the population to develop preventive methods for MASLD, one of the lifestyle-related diseases.
Therefore, our study aimed to clarify the association between oral microflora patterns and MASLD in general residents.

2. Materials and Methods

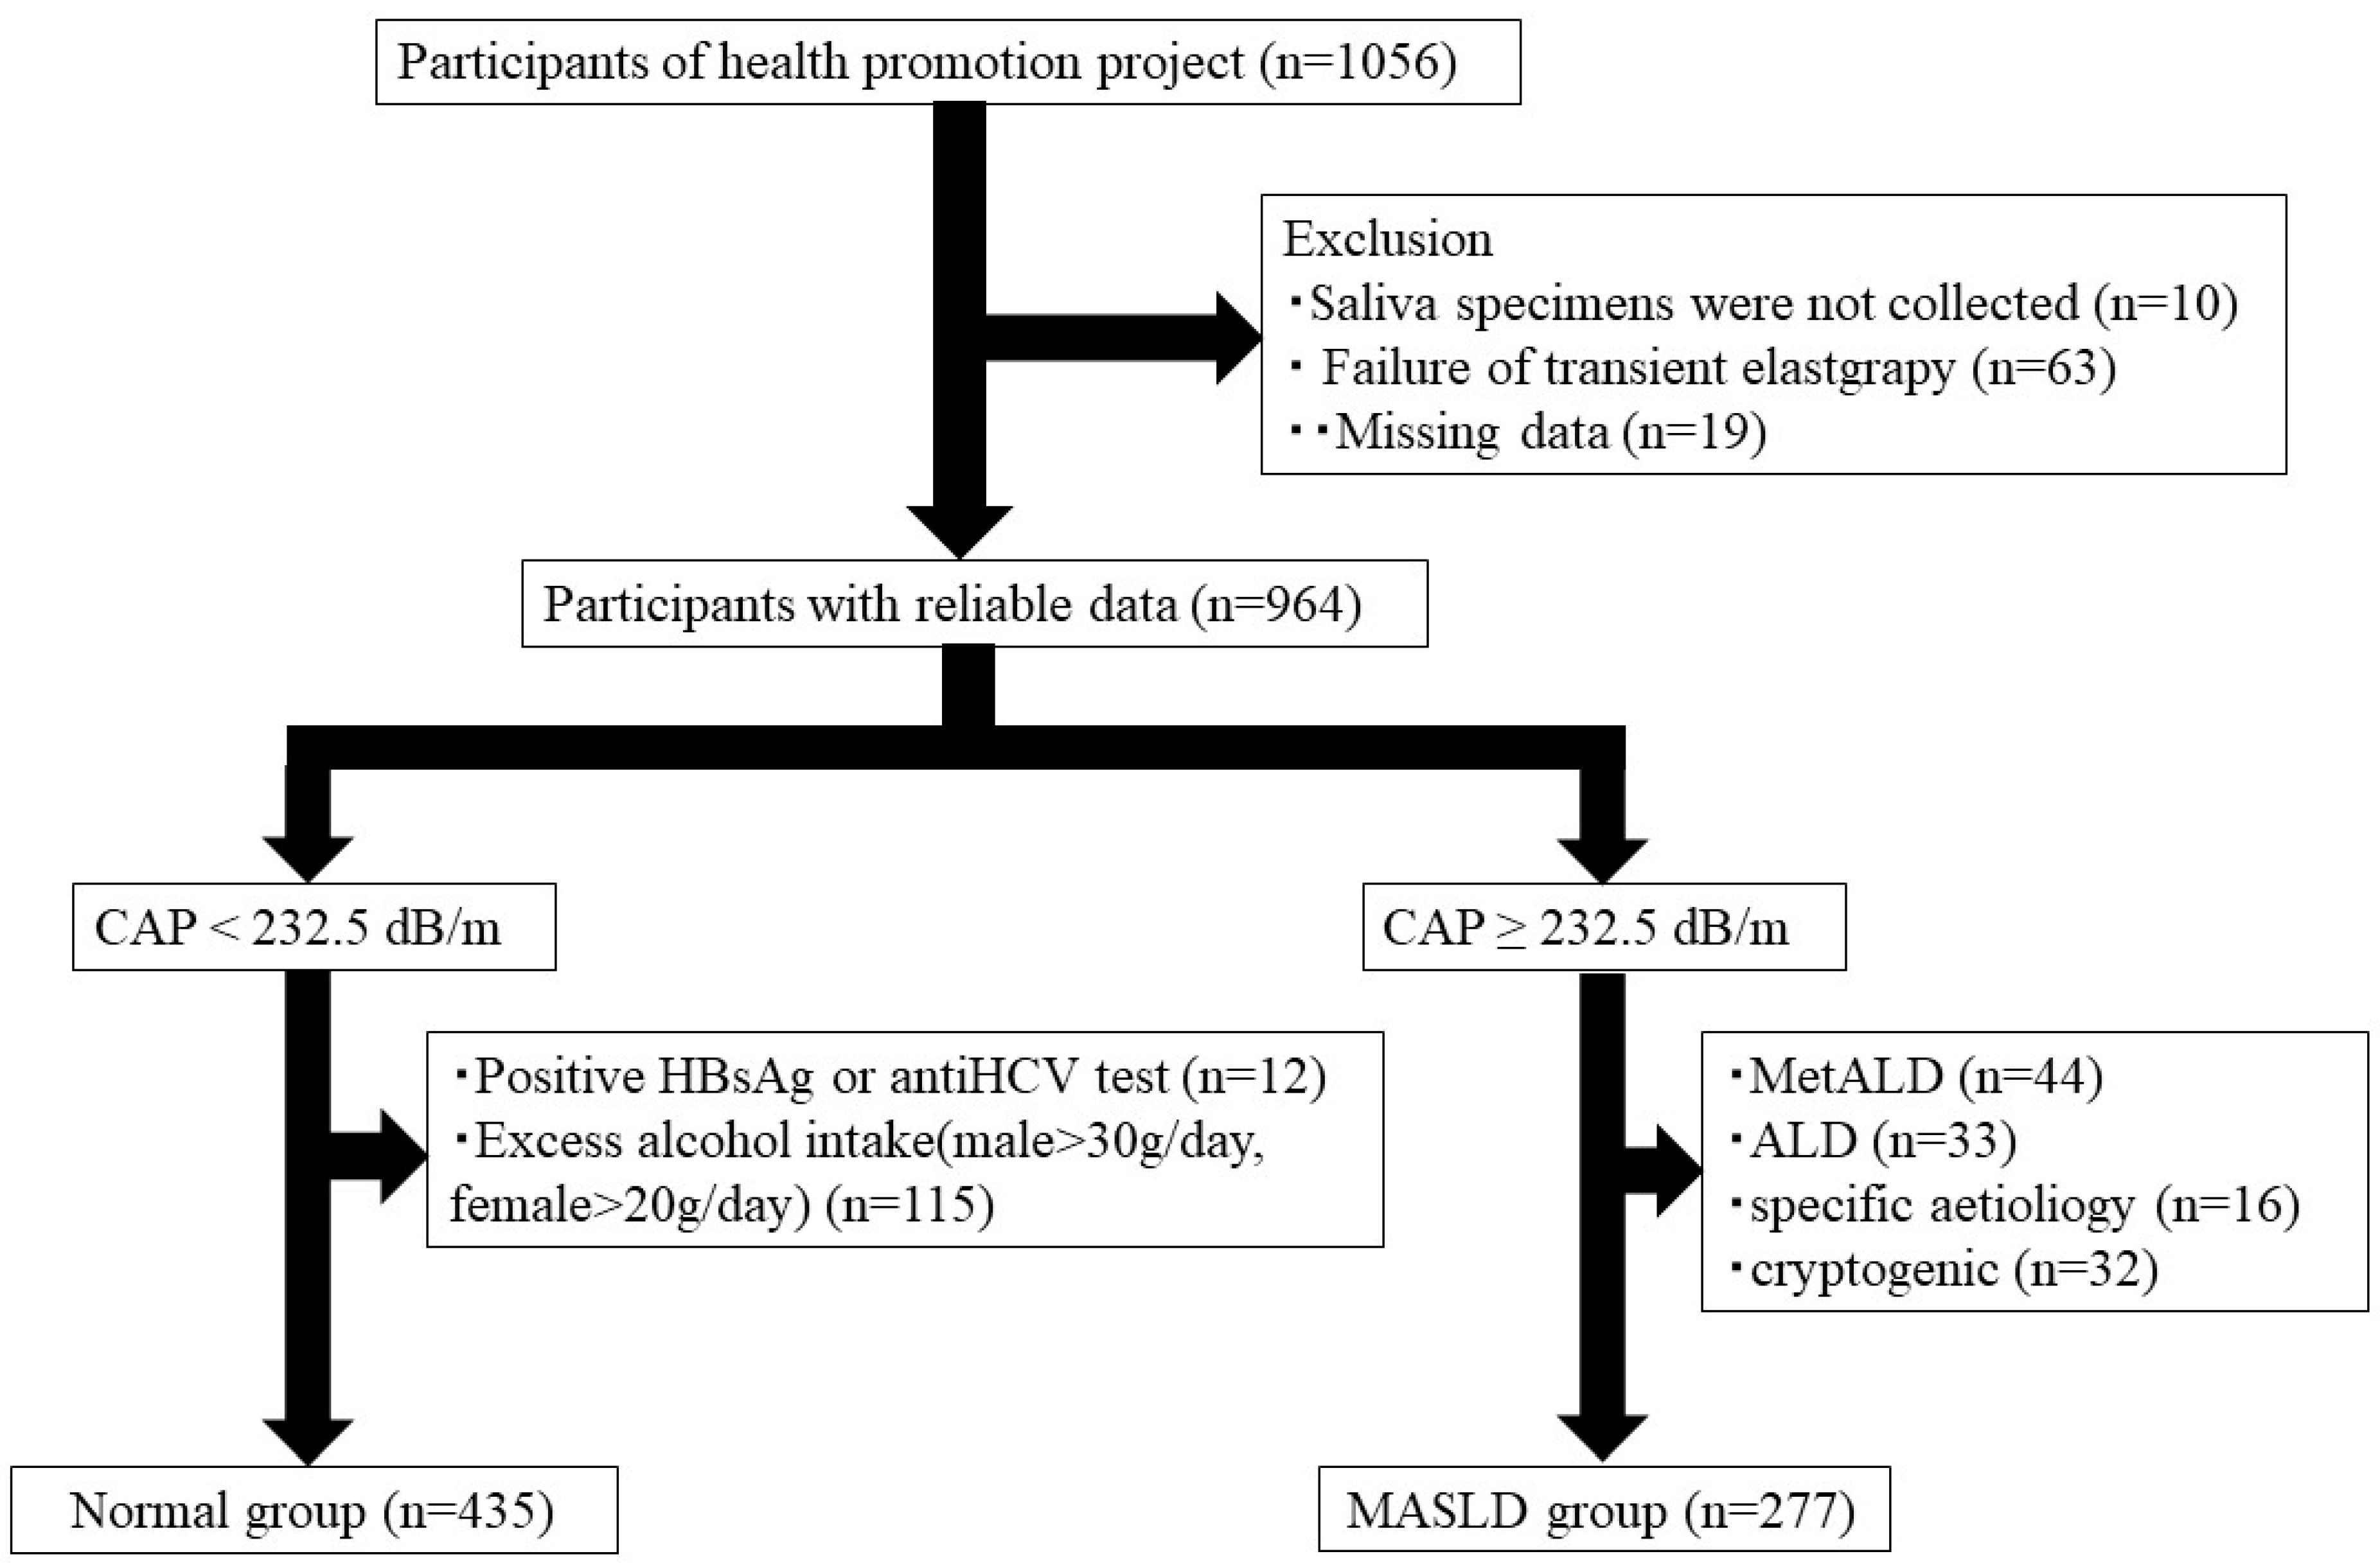
2.1. Study Participants

Our study was conducted as one of the “Iwaki Health Promotion Project”, the community-based health promotion project targeting the general Japanese residents. The Iwaki Health Promotion Project is an ongoing community-based health promotion research program aimed at preventing lifestyle-related diseases and extending life expectancy among Japanese adults. The project targets inhabitants of the Iwaki district, Hirosaki City, and Aomori Prefecture, and was performed as a regular health check-up every year in June [15]. This project has been conducted annually since 2005, with around 1000 participants. All subjects participated voluntarily according to the public announcement, and various data, including physique, lifestyle data, medical history, microflora, and blood chemistry analysis data were collected from each participant. All participants were sufficiently informed of the purpose and procedures of our study and provided written consent. A total of 1056 adults (aged 19–88 years) who voluntarily responded to a public call participated in this study. The participants were excluded if they were unable to accurately assess fatty liver due to transient elastography failure or had missing values on any of the measures, and saliva specimens were not collected or missing data. Additionally, based on previous reports, steatotic liver disease (SLD) was identified with a cut-off value of 232.5 dB/m for the controlled attenuation parameter (CAP) value using FibroScan (Echosens, Paris, France) [16]. Approximately 435 participants were included in a normal group after excluding individuals with positive hepatitis B surface (HBs) antigen, positive anti-hepatitis C virus (HCV) antibody, or habitual drinkers (>30 g/day for men and 20 g/day for women) from the non-SLD group. In the SLD group, 277 participants who met the diagnostic criteria were included in the MASLD group [4]. We analyzed 712 patients (435 in the normal group and 277 in the MASLD group) (Figure 1).

2.2. Transient Elastography

The CAP and liver stiffness measurements were conducted by a FibroScan 530 (Echosens, Paris, France) using M and XL probes. All the tests were conducted by five professionally trained hepatologists. Measurements were excluded if the number of measurements was <10 or if the interquartile range ratio was ≥0.30; this is because they were unreliable. In a previous study, CAP values > 232.5 dB/m were defined as fatty liver [16].

2.3. Clinical Parameters

The following parameters were measured at the date of this project visit: age, sex, waist circumference, height, body mass index (BMI, calculated by dividing the weight [in kilograms] by the squared height [in meters]), anti-HCV test or HBsAg results, and levels of alanine aminotransferase, aspartate aminotransferase, gamma-glutamyl trans-peptidase, glucose, hemoglobin A1c (HbA1c), triglycerides, high-density HDL cholesterol, and low-density lipoprotein (LDL) cholesterol.
The fatty liver index was calculated as the following formula:
(e [0.953 × ln [triglycerides] + 0.139 × BMI + 0.718 × ln [GGT] + 0.053 × waist circumference − 15.745)/(1 + e [0.953 × ln [triglycerides] + 0.139 × BMI + 0.718 × ln [GGT] + 0.053 × waist circumference − 15.745]) × 100.

2.4. MASLD Diagnosis

Metabolic dysfunction-associated steatotic liver disease was diagnosed as fatty liver without drinking habits or other liver diseases, plus ≥1 of the following items: obesity, hyperglycemia, high blood pressure, high triglycerides, and reduced HDL cholesterol. Specific criteria included a waist circumference of ≥94 cm for males, and ≥80 cm for females or BMI of ≥23 kg/m2; fasting blood glucose of ≥100 mg/dL, postprandial blood glucose of ≥140 mg/dL, HbA1c of ≥5.7%, or treatment for type 2 diabetes mellitus; blood pressure ≥130/85 mmHg or antihypertensive treatment; triglycerides ≥150 mg/dL or treatment for dyslipidemia; and HDL cholesterol ≤40 mg/dL for males and ≤50 mg/dL for females [4].

2.5. Measurements of Oral Microbiota

The oral microbiota data were obtained using the following procedure: The participants were provided with a saliva sample kit beforehand, and saliva samples were collected on the day of the project at home. DNA was extracted from the bead-beaten saliva suspensions by an automated nucleic acid extraction system (Precision System Science, Chiba, Japan). The MagDEA DNA 200 (GC) reagent kit (Precision System Science, Chiba, Japan) was utilized for nucleic acid extraction. DNA extraction from saliva samples was completed within 4 months. Universal primer sets were utilized to amplify the V3-V4 regions of the 16S rRNA gene. The condition setting and solution preparation for PCR amplification were conducted as described previously [17]. PCR fragments purified utilizing PCR Cleanup Filter Plates (Merck Millipore, Burlington, MA, USA) were quantified by the real-time quantitative PCR. Purified PCR fragments were analyzed by paired-end sequencing of 2 × 300 cycles on a MiSeq™ system (Illumina, San Diego, CA, USA) to read DNA sequences. Paired-end reads were processed as follows: adapter sequences and low-quality bases (Q < 20) at the 3′ end of the reads were trimmed using Cutadapt (version: 1.13). The reads containing ambiguous bases N or shorter than 150 bp were excluded. The paired-end reads which met the criteria were merged into a single read called a “merged read”. Merged reads shorter than 370 bp or longer than 470 bp were excluded using the fastq_mergepairs subcommand in VSEARCH (version 2.4.3) [18]. Merged reads containing one or more identified sequencing errors were excluded. After eliminating the chimeric reads identified using the uchime_denovo subcommand of VSEARCH, the remaining merged reads were clustered with the minimum sequence similarity of 97% to obtain operational taxonomic units (OTUs). OUT taxonomic assignments were performed using the RDP classifier (commit hash: 701e229dde7cbe53d4261301e23459d91615999d) based on representative reads [19]. Predictions with a confidence score below 0.8 were treated as unclassified. The relative abundance of each bacterial genus in oral microbiota was calculated by dividing the read count of each bacterial genus by the total read count. In this study, 505 bacterial species were extracted.

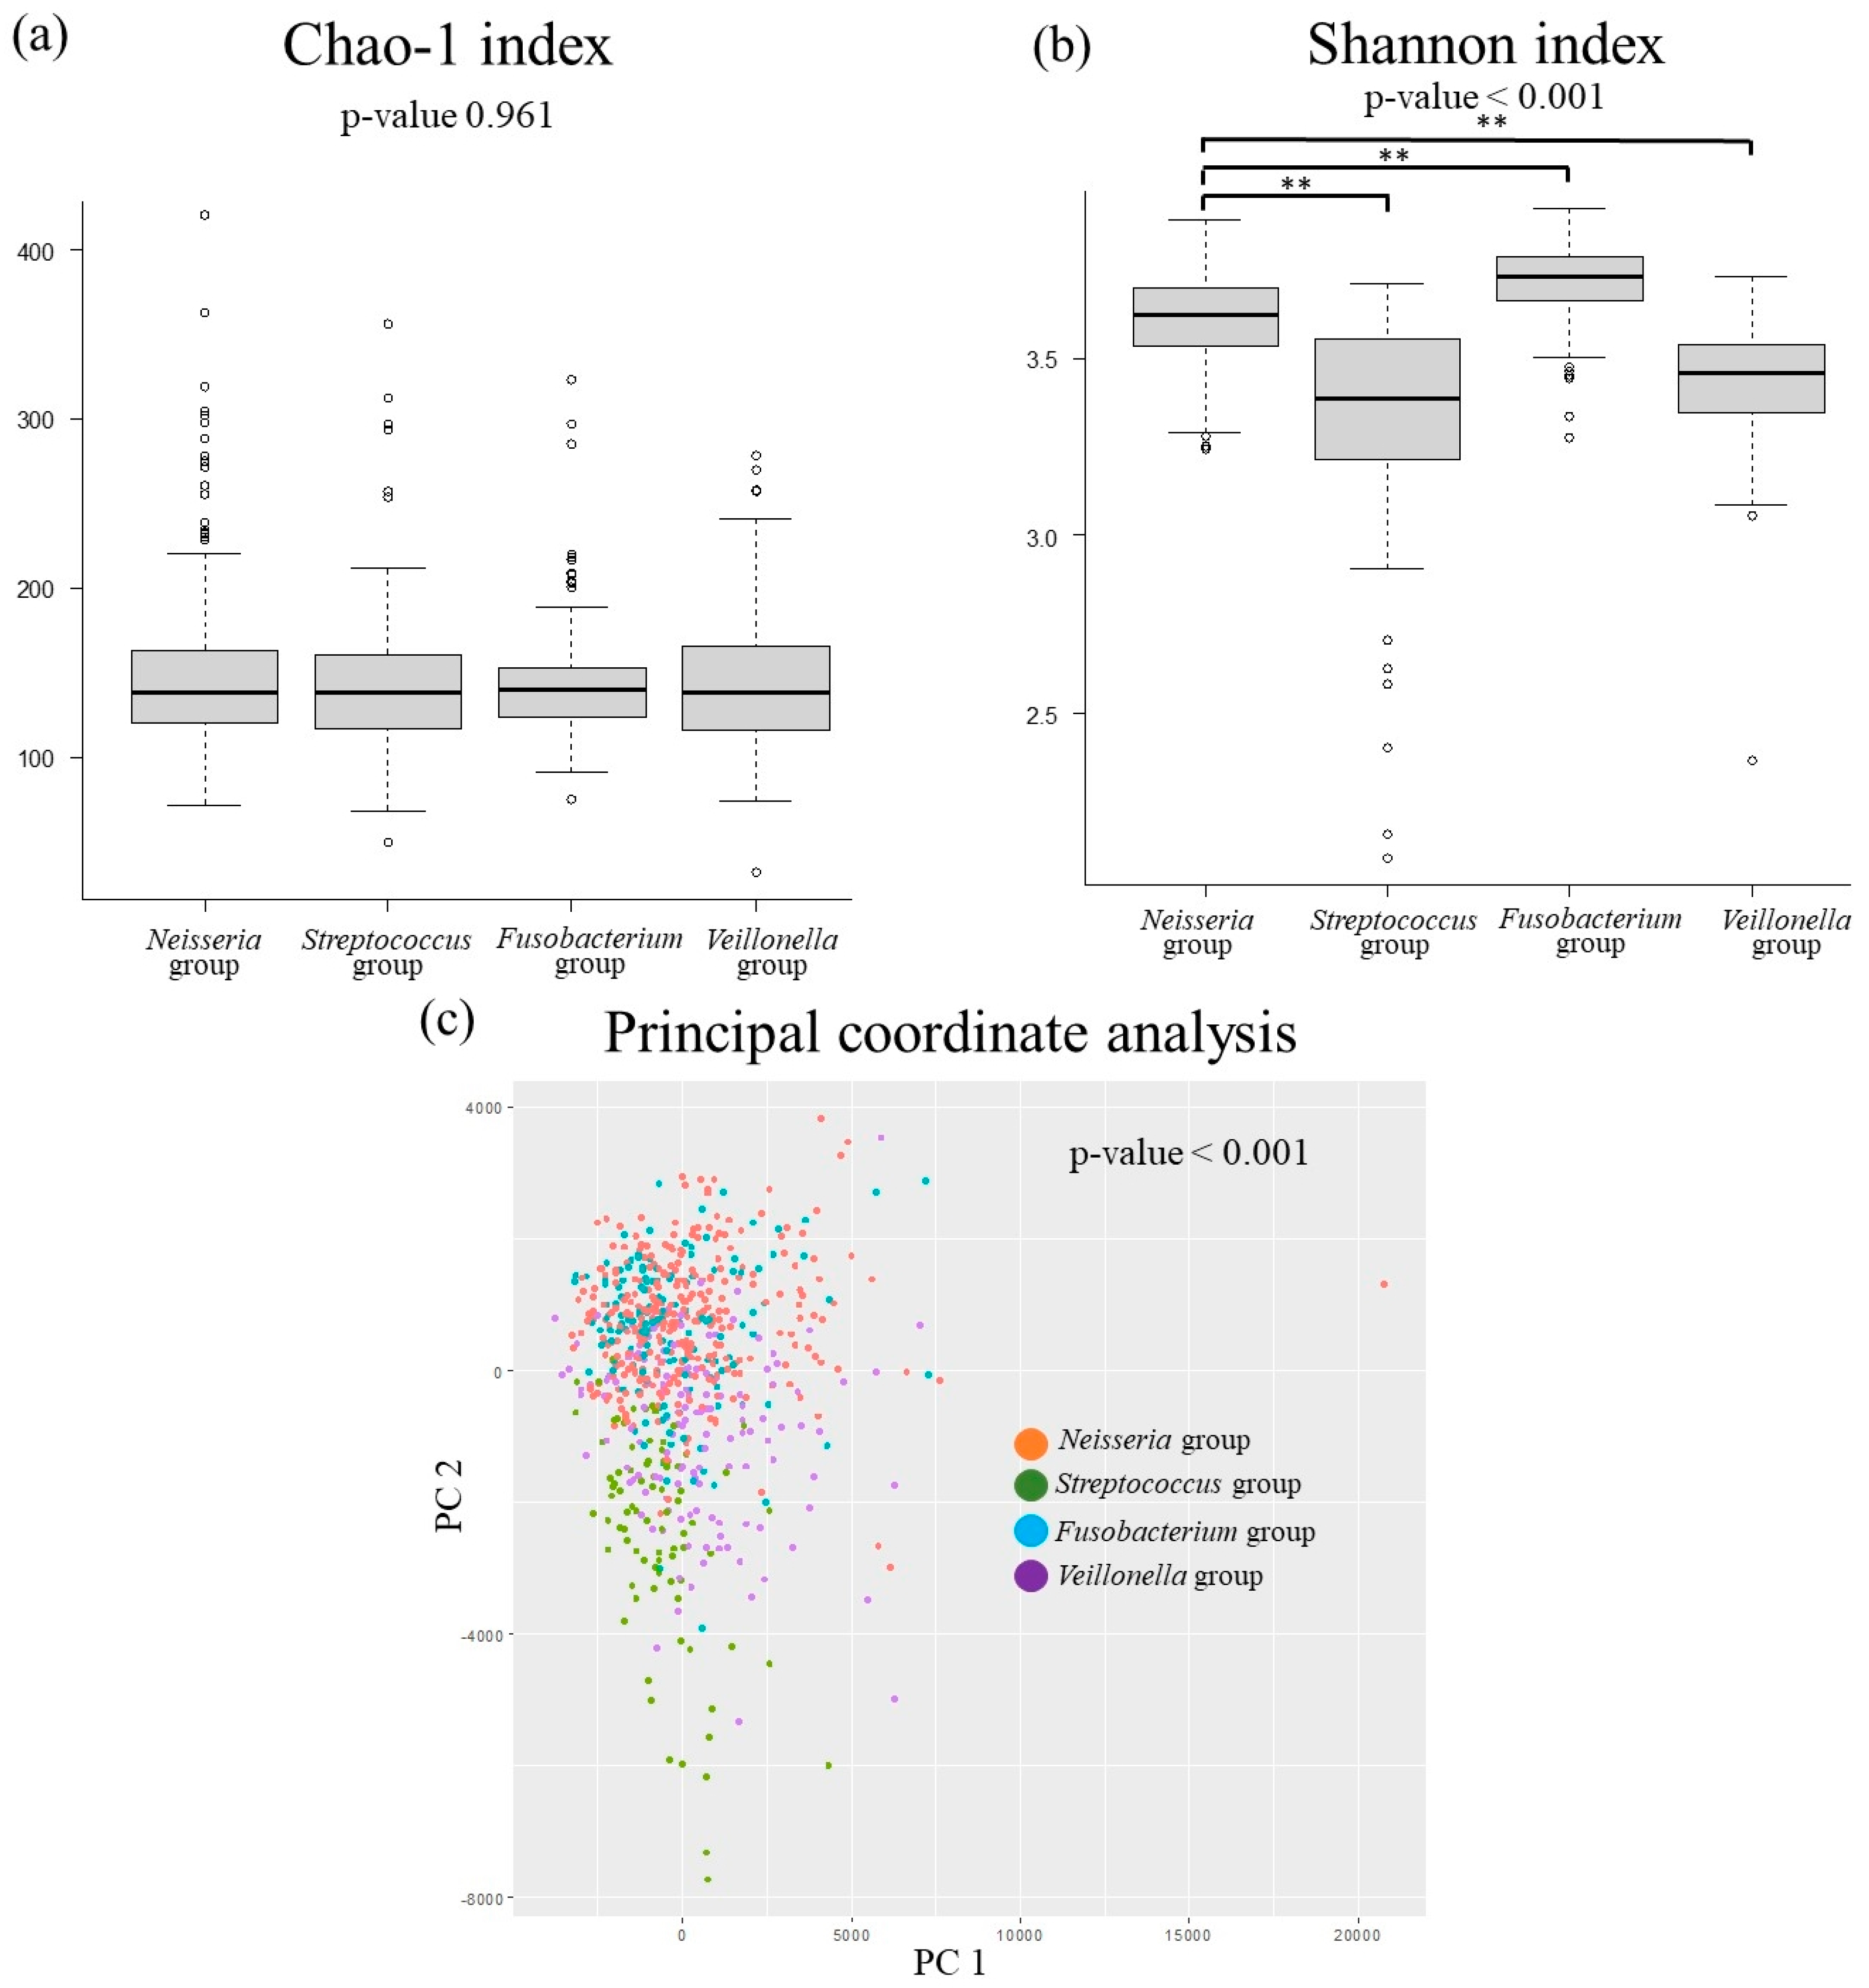
2.6. Oral Microbiota Pattern Analysis

To assess the oral microbiota patterns, we performed principal component analysis (PCA) with varimax rotation on 47 oral bacteria species with a relative abundance of ≥1%. After that, the participants were classified into four oral microbiota patterns via PCA using non-hierarchal cluster analysis (k-means method). The effects of oral microbiota patterns on MASLD and related items were investigated.

2.7. Statistical Analysis

Continuous variables were described using medians and interquartile ranges. To compare the four groups, the Kruskal–Wallis test was employed, followed by Steel–Dwass multiple comparisons. Categorical variables were compared using the chi-square test with Bonferroni. The association between oral microbiota patterns and MASLD incidence was analyzed using univariate and multivariate analyses. Pearson’s correlation coefficient was used to examine the correlation between MASDL-related factors and oral microbiota species. Multiple regression models were used for the predictive analysis of MASLD-related factors and oral microbiota species. The models were adjusted for age, sex, smoking habits, and exercise habits. Prior to simple correlation and multiple regression analyses, all continuous parameters underwent log-transformed (natural logarithm) to achieve a closer approximation to a normal distribution.
All statistical analyses were conducted using the Statistical Package for the Social Sciences version 28.0 (SPSS Inc., Chicago, IL, USA) and R software (R Foundation for Statistical Computing, version R−4.1.1). A p-value of less than 0.05 was considered statistically significant.

2.8. Ethics Statement

Our study was conducted in accordance with the ethical standards of the Declaration of Helsinki and approved by the Ethics Committee of Hirosaki University School of Medicine (approval number and date: 2018–012, approved on 11 May 2018, and 2022–100, approved on 30 September). Informed consent was obtained from all the participants. All participants were informed of the purpose and procedures of the study, and they provided written consent.

3. Results

3.1. Participant Characteristics

Four components were extracted by PCA with varimax rotation (Table 1). Cluster analysis using the four factors obtained by PCA resulted in four groups. Each group was named based on the microbiota species that showed significantly higher relative abundance compared to the other groups, after comparing the oral microbiome patterns of each group.
The relative abundance of oral microbiota species among the four oral microbiota patterns is indicated in Table 2. The first group was named the Neisseria group, characterized by a relatively high abundance of Neisseria species. The second group, marked by a high relative abundance of Streptococcus species, was named the Streptococcus group. The third group was named the Fusobacterium group, due to its high relative abundance of Fusobacterium species. The fourth group was named the Veillonella group, based on its high relative abundance of Veillonella species. The Neisseria group had the largest number of participants and was used as the reference for comparison with the other three groups.
The Fusobacterium group had more males, higher BMI, waist circumference, fasting blood sugar, systolic blood pressure, triglycerides, alanine aminotransferase, gamma-glutamyl transpeptidase, CAP, and fatty liver index were higher than those in the Neisseria group. The prevalence of MASLD was 34.4% in the Neisseria group, 36.0% in the Streptococcus group, 45.5% in the Fusobacterium group, and 49.7% in the Veillonella group. Three or more of the five cardiometabolic criteria were possessed by 22.8% of the Neisseria group, 19.8% of the Streptococcus group, 35.6% of the Fusobacterium group, and 25.9% of the Veillonella group (Table 3).
Figure 2 shows the differences in diversity of the oral and gut microbiota. The Shannon index, an index of alpha diversity, was lower in the Streptococcus and Veillonella groups and higher in the Fusobacterium group than in the Neisseria group. The principal coordinate analysis, a measure of β-diversity, showed significant differences among the four oral bacterial patterns.

3.2. Risk Factors for Liver Fibrosis in Patients with MASLD

For the univariate analysis of risk factors with MASLD as the outcome, male, old age, smoking habit, obesity/central obesity, hyperglycemia or diabetes, high blood pressure, high triglycerides, and reduced HDL-cholesterol were significant risk factors for MASLD. Additionally, the Neisseria, Fusobacterium, and Veillonella groups were high-risk factors for MASLD. In the multivariate analysis, obesity/central obesity, hyperglycemia or diabetes, high triglycerides, reduced HDL-cholesterol, and the Veillonera group were risk factors for MASLD (Table 4).

3.3. The Relationship Between MASLD-Related Items and Oral Microbiota

Table 5 presents a summary of the single correlation analyses between MASLD-related items and the oral microbiota. Neisseria negatively correlated with CAP level, BMI, waist circumference, blood glucose, HbA1c, alanine aminotransferase, gamma-glutamyl transpeptidase, and fatty liver index, positively correlated with HDL cholesterol. In contrast, Veillonella showed a positive correlation with CAP level, BMI, waist circumference, blood pressure, blood glucose, HbA1c, aspartate aminotransferase, and alanine aminotransferase, gamma-glutamyl transpeptidase, and a negative correlation with HDL cholesterol.
Subsequently, we performed a multiple regression analysis, where the dependent variables were MASLD-related items, and the independent variables were sex, age, smoking, and exercise habits in addition to the oral microbiota (Table 6). Neisseria showed negative correlations with CAP, BMI, waist circumference, HbA1c, alanine aminotransferase, and fatty liver index. Streptococcus showed negative correlations with CAP level, waist circumference, triglycerides, alanine aminotransferase, gamma-glutamyl transpeptidase, and fatty liver index. Fusobacterium showed a positive correlation with alanine aminotransferase and gamma-glutamyl transpeptidase. In contrast, Veillonella showed the same correlation as a single correlation except for blood glucose and HbA1c. On the other hand, both standardized coefficient and coefficient of determination were low.

4. Discussion

This study was conducted to epidemiologically investigate the influence of oral microbiota patterns on MASLD in the general population. The results showed that the Veillonella group had a higher incidence of MASLD than the Neisseria group. Furthermore, in a multivariate analysis with cardiometabolic criteria as independent variables, the Veillonella group was also identified as an independent risk factor for MASLD. Additionally, this study found that oral Veillonella species were associated with increased liver fat content and worsening cardiometabolic criteria, while Neisseria species were associated with improvements in these parameters. Disorders of oral microflora such as periodontal disease are associated with various systemic diseases via periodontal disease-causing bacteria and inflammatory cytokines such as TNFα [6,20,21]. For example, aspiration pneumonia caused by periodontal disease-causing bacteria is a major cause of death in elderly people [22,23,24]. In patients with periodontal disease, insulin resistance and atherosclerosis are induced, leading to diabetes and cerebrovascular disease [7,8]. It has also been reported that periodontal disease is involved in osteoporosis and neurodegenerative diseases such as Parkinson’s disease [9,25]. The association between oral bacteria and liver disease has long been pointed out [26,27]. Periodontal disease is considered a risk factor for non-alcoholic fatty liver disease, and research is being conducted to determine whether it can lead to the prevention and treatment of MASLD/MASH, for which a treatment method has not yet been established [10,11,13].
In this study, the oral microbiota patterns were divided into four groups by PCA and cluster analysis, and the group with the largest number of people was the Neisseria-rich group. Neisseria and Veillonella are the major commensal bacteria in the oral cavity, but while Neisseria contributes to a healthy periodontal condition, Veillonella is known to contribute to poor health, including involvement in obesity, aging, and periodontal disease [28]. In previous studies conducted on Japanese individuals, the oral microbiota was divided into three groups: Prevotella/Veillonella, Streptococcus, and Porphyromonas/Neisseria/Haemophilus/Aggregatibacter groups. The Prevotella/Veillonella group reported worse periodontal disease [29]. This grouping is generally consistent with our study; therefore, the oral microbiota patterns of our study participants appear to be that of the general Japanese pattern.
The diversity of the four oral microbiota patterns in this study was different. In the gut microbiota, higher diversity has been reported to be healthier, while lower diversity has been associated with poor health [30]. However, with respect to oral microbiota, diversity is considered to be rich in an unhygienic oral environment [31]. In this study, the Veillonella group, which was a risk factor for MASLD, had a low diversity of oral bacteria, which was different from previous studies. However, the results of the relationship between oral bacterial diversity and fatty liver disease differ according to diversity indices (Chao-1 index, Shannon index, etc.), and a certain consensus has not been reached [32,33].
In this study, the Neisseia-rich group was found to be a lower risk factor for MASLD than the other groups. The genus Neisseia is one of the most abundant taxa of Gram-negative bacteria in the oral cavity [34]. A high abundance of Neisseria in the oral cavity is associated with oral health [35,36]. In previous studies investigating the relationship between MAFLD and the oral microbiota, it was reported that patients with MAFLD had decreased oral Neisseria [32,33]. In this study, oral Neisseria was negatively correlated with fasting blood glucose and HbA1c. However, the prevalence of oral Neisseria is elevated in diabetic individuals, and the underlying mechanism is hypothesized to involve impaired nitric oxide bioavailability, resulting in exacerbated insulin resistance [37,38]. Although the previous study compared diabetes with healthy individuals, the participants in this study compared fatty liver disease with healthy individuals. This difference in survey participants may be a reason for the different results from the previous study. Numerous studies reported that Neisseria contributes to oral health, and is decreased in fatty liver disease, suggesting that it may act in the direction of improving blood glucose for MASLD. However, the mechanism by which oral Neisseria exerts a healthy effect on the body has not yet been elucidated and is an issue for further investigation.
Veillonella is a species of Gram-negative anaerobic bacteria that primarily inhabits the oral cavity. The presence of Veillonella in the oral cavity is associated with increased production of inflammatory cytokines and periodontal infection [28,39,40]. Veillonella species are the major oral bacteria, but they are also present in the gut and are known to be increased in NAFLD and cirrhosis [41,42]. In addition to CAP level and fatty liver index, this study found that oral Veillonella was positively correlated with BMI, waist circumference, blood pressure, triglycerides, and hepatic LDL cholesterol, and negatively correlated with HDL cholesterol. Previous studies have reported that Veillonella migrating from the oral cavity to the intestine aggravates obesity and hypertension [43,44,45]. This study suggests that increased oral Veillonella may be involved in the development and progression of MASLD via obesity, lipid metabolism, and elevated blood pressure. The Veillonella group was also found to be a risk factor for MASLD in a multivariate analysis with cardiometabolic criteria as independent variables in this study. Oral Veillonella correlates with increased production of inflammatory cytokines [39,40]. Periodontitis has been shown to contribute to the development and progression of NAFLD through the mediation of inflammatory cytokines, including interleukin (IL)-1β, IL-6, and TNFα [13]. Our findings suggest that the proliferation of oral Veillonella may infect the pathogenesis of MASLD via an inflammatory cytokine-mediated pathway, independent of obesity, or metabolic disorders.
The Fusobacterium and Streptococcus groups were not significantly associated with MASLD in our study. In particular, the Fusobacterium group was not found to be a significant risk factor for MASLD in multivariate analysis despite having a higher BMI, blood pressure, and triglycerides than the other groups. Gut Fusobacterium is also increased in patients with NAFLD/NASH [46,47]. The fact that Fusobacterium necrophorum, one of the causative agents of periodontal disease, is often detected in liver abscesses suggests a strong relationship between the oral cavity and the liver [48]. On the other hand, in this study, Neissria and Veillonella showed a significant correlation with CAP values, but Fusobacterium showed no correlation with CAP values. Furthermore, the Fusobacterium group had a higher prevalence of cardiometabolic criteria than the other groups, but the prevalence of MASLD was not significantly higher. Although the detailed mechanism is unclear, it is possible that Fusobacterium has a relatively low direct effect on liver fat mass compared to Neisseria and Veillonella, and thus was not found to be a significant risk factor for MASLD in the multivariate analysis.
Gut Streptococcus has been reported to be increased in patients with NAFLD [49]. Oral Streptococcus is also increased in patients with fatty liver disease, and oral Streptococcus correlates with obesity and insulin resistance [33,50]. The previous study included patients with NAFLD/NASH having advanced fibrosis, while this study included the general population health check-up recipients. Furthermore, in this study, the CAP value of 232.5 dB/m on the Fibroscan was used as the cut-off value for fatty liver, which is a loose value that includes mild fatty liver, as fat is histologically accumulated in liver cells by >5% [16]. Our findings indicate that Streptococcus and Fusobacterium may play a less significant role in the pathogenesis and progression of MASLD among individuals with mild fatty liver.
Several limitations should be acknowledged in this study. Firstly, the study population was geographically restricted to a single region within Japan, which may limit the generalizability of our findings to other ethnic populations. Second, the number of remaining teeth and oral hygiene status, such as the presence of periodontal disease, have not been adequately assessed. By assessing oral hygiene, it may be possible to advocate for methods of prevention and treatment of MASLD through an oral approach. Thirdly, the diagnosis of fatty liver was conducted using FibroScan instead of liver biopsy. Invasive liver biopsy is not appropriate as part of health checkups in the general population and was not feasible in this study. Fourth, some oral bacterial species were significantly correlated with MASLD-related items, but the standardized coefficient and coefficient of determination were low. The effect of oral bacteria on MASLD is influenced by a variety of confounding factors, suggesting that the association is weak. Fifth, this study could not clearly distinguish whether the differences in oral microbiota were causal or consequential. Future bioinformatic analysis may lead to further clarification of the pathophysiology. The above limitation should be considered in interpreting the results of this study.

5. Conclusions

Our study revealed that variations in oral microbial composition were associated with the onset and progression of MASLD in the general population. The oral bacterial pattern identified as a risk factor for MASLD in this study was rich in Veillonella, which causes periodontitis. Additionally, oral Veillonella acted in the direction of worsening cardiometabolic criteria and liver fat content. Maintaining oral hygiene and preventing periodontitis may contribute to preventing MASLD and extending a healthy lifespan.

Author Contributions

Conceptualization, S.S.; methodology, S.S. and C.I.; validation, S.S.; investigation, S.S., C.I., K.F., K.Y., D.C., K.S., T.M. and S.N.; data curation, S.S., C.I., K.S., D.C. and T.M.; writing—original draft preparation, S.S.; review and editing, S.S, C.I., K.S., D.C., T.M., S.N. and H.S.; supervision, T.M., S.F. and S.N.; funding acquisition, T.M. and S.N. All authors have read and agreed to the published version of the manuscript.

Funding

This study was supported by JSPS KAKENHI (grant number 22K17386), JST, and COI Grant Numbers JPMJCE1302, JPMJCA2201, and JPMJPF2210.

Institutional Review Board Statement

This study was performed in accordance with the ethical standards of the Declaration of Helsinki and approved by the Medical Ethics Committee of Hirosaki University (approval number and date: 2018–012, approved on 11 May 2018).

Informed Consent Statement

Informed consent was obtained from all participants involved in the study.

Data Availability Statement

The original contributions of this study are included in this article. Further inquiries can be directed to the corresponding authors.

Acknowledgments

This study was based on the Iwaki Health Promotion Project of the Hirosaki University Graduate School of Medicine in collaboration with the Aomori Health Evaluation and Promotion Center and Hirosaki City Office of the Department of Health Promotion.

Conflicts of Interest

The authors declare no conflicts of interest.

Abbreviations

The following abbreviations are used in this manuscript:
MASLDmetabolic dysfunction-associated steatotic liver disease
ILinterleukin
TNFtumor necrosis factor-alpha
NAFLDnon-alcoholic fatty liver disease
NASHnon-alcoholic steatohepatitis
CAPcontrolled attenuation parameter
SLDsteatotic liver disease
LDLlow-density lipoprotein
HDLhigh-density lipoprotein

References

  1. Castillo-Núñez, Y.; Almeda-Valdes, P.; González-Gálvez, G.; Arechavaleta-Granell, M.D.R. Metabolic dysfunction-associated steatotic liver disease and atherosclerosis. Curr. Diab Rep. 2024, 24, 158–166. [Google Scholar] [CrossRef] [PubMed]
  2. Leite, N.C.; Villela-Nogueira, C.A.; Cardoso, C.R.; Salles, G.F. Non-alcoholic fatty liver disease and diabetes: From physiopathological interplay to diagnosis and treatment. World J. Gastroenterol. 2014, 20, 8377–8392. [Google Scholar] [CrossRef]
  3. Younossi, Z.M.; Gramlich, T.; Matteoni, C.A.; Boparai, N.; McCullough, A.J. Nonalcoholic fatty liver disease in patients with type 2 diabetes. Clin. Gastroenterol. Hepatol. 2004, 2, 262–265. [Google Scholar] [CrossRef] [PubMed]
  4. Rinella, M.E.; Lazarus, J.V.; Ratziu, V.; Francque, S.M.; Sanyal, A.J.; Kanwal, F.; Romero, D.; Abdelmalek, M.F.; Anstee, Q.M.; Arab, J.P.; et al. A multisociety Delphi consensus statement on new fatty liver disease nomenclature. Hepatology 2023, 78, 1966–1986. [Google Scholar] [CrossRef]
  5. Riazi, K.; Azhari, H.; Charette, J.H.; Underwood, F.E.; King, J.A.; Afshar, E.E.; Swain, M.G.; Congly, S.E.; Kaplan, G.G.; Shaheen, A.A. The prevalence and incidence of NAFLD worldwide: A systematic review and meta-analysis. Lancet Gastroenterol. Hepatol. 2022, 7, 851–861. [Google Scholar] [CrossRef]
  6. Nazir, M.A. Prevalence of periodontal disease, its association with systemic diseases and prevention. Int. J. Health Sci. 2017, 11, 72–80. [Google Scholar]
  7. Genco, R.J.; Borgnakke, W.S. Diabetes as a potential risk for periodontitis: Association studies. Periodontology 2000 2020, 83, 40–45. [Google Scholar] [CrossRef]
  8. Nocini, R.; Favaloro, E.J.; Sanchis-Gomar, F.; Lippi, G. Periodontitis, coronary heart disease and myocardial infarction: Treat one, benefit all. Blood Coagul. Fibrinolysis 2020, 31, 339–345. [Google Scholar] [CrossRef]
  9. Pardo, A.; Barilli, A.; Signoriello, A.; Gualtieri, M.; Brancato, G.; Colapinto, G.; Lombardo, G.; Albanese, M. Oral health conditions and hygiene procedures in patients with Parkinson’s disease: A systematic review. Explor. Med. 2024, 5, 852–869. [Google Scholar] [CrossRef]
  10. Shine, B.K.; Son, M.; Moon, S.Y.; Han, S.H. Metabolic Dysfunction-Associated Steatotic Liver Disease and the Risk of Chronic Periodontitis: A Nationwide Cohort Study. Nutrients 2024, 17, 125. [Google Scholar] [CrossRef]
  11. Chen, T.P.; Yu, H.C.; Lin, W.Y.; Chang, Y.C. The role of microbiome in the pathogenesis of oral-gut-liver axis between periodontitis and nonalcoholic fatty liver disease. J. Dent. Sci. 2023, 18, 972–975. [Google Scholar] [CrossRef] [PubMed]
  12. Konkel, J.E.; O’Boyle, C.; Krishnan, S. Distal Consequences of Oral Inflammation. Front. Immunol. 2019, 10, 1403. [Google Scholar] [CrossRef]
  13. Kuraji, R.; Sekino, S.; Kapila, Y.; Numabe, Y. Periodontal disease-related nonalcoholic fatty liver disease and nonalcoholic steatohepatitis: An emerging concept of oral-liver axis. Periodontol. 2000 2021, 87, 204–240. [Google Scholar] [CrossRef]
  14. Cekici, A.; Kantarci, A.; Hasturk, H.; Van Dyke, T.E. Inflammatory and immune pathways in the pathogenesis of periodontal disease. Periodontol. 2000 2014, 64, 57–80. [Google Scholar] [CrossRef]
  15. Nakaji, S.; Ihara, K.; Sawada, K.; Parodi, S.; Umeda, T.; Takahashi, I.; Murashita, K.; Kurauchi, S.; Tokuda, I. Social innovation for life expectancy extension utilizing a platform-centered system used in the Iwaki health promotion project: A protocol paper. SAGE Open Med. 2021, 9, 20503121211002606. [Google Scholar] [CrossRef] [PubMed]
  16. Masaki, K.; Takaki, S.; Hyogo, H.; Kobayashi, T.; Fukuhara, T.; Naeshiro, N.; Honda, Y.; Nakahara, T.; Ohno, A.; Miyaki, D.; et al. Utility of controlled attenuation parameter measurement for assessing liver steatosis in Japanese patients with chronic liver diseases. Hepatol. Res. 2013, 43, 1182–1189. [Google Scholar] [CrossRef]
  17. Takahashi, S.; Tomita, J.; Nishioka, K.; Hisada, T.; Nishijima, M. Development of a prokaryotic universal primer for simultaneous analysis of Bacteria and Archaea using next-generation sequencing. PLoS ONE 2014, 9, e105592. [Google Scholar] [CrossRef]
  18. Rognes, T.; Flouri, T.; Nichols, B.; Quince, C.; Mahé, F. VSEARCH: A versatile open source tool for metagenomics. PeerJ 2016, 4, e2584. [Google Scholar] [CrossRef] [PubMed]
  19. Wang, Q.; Garrity, G.M.; Tiedje, J.M.; Cole, J.R. Naive Bayesian classifier for rapid assignment of rRNA sequences into the new bacterial taxonomy. Appl. Environ. Microbiol. 2007, 73, 5261–5267. [Google Scholar]
  20. Schenkein, H.A.; Loos, B.G. Inflammatory mechanisms linking periodontal diseases to cardiovascular diseases. J. Clin. Periodontol. 2013, 40 (Suppl. S14), S51–S69. [Google Scholar] [CrossRef]
  21. Madureira, D.F.; Lucas De Abreu Lima, I.; Costa, G.C.; Lages, E.M.B.; Martins, C.C.; Aparecida Da Silva, T. Tumor Necrosis Factor-alpha in Gingival Crevicular Fluid as a Diagnostic Marker for Periodontal Diseases: A Systematic Review. J. Evid. Based Dent. Pract. 2018, 18, 315–331. [Google Scholar] [CrossRef] [PubMed]
  22. Bansal, M.; Khatri, M.; Taneja, V. Potential role of periodontal infection in respiratory diseases—A review. J. Med. Life 2013, 6, 244–248. [Google Scholar]
  23. Mojon, P.; Bourbeau, J. Respiratory infection: How important is oral health? Curr. Opin. Pulm. Med. 2003, 9, 166–170. [Google Scholar] [CrossRef] [PubMed]
  24. Mojon, P. Oral health and respiratory infection. J. Can. Dent. Assoc. 2002, 68, 340–345. [Google Scholar] [PubMed]
  25. Yu, B.; Wang, C.Y. Osteoporosis and periodontal diseases—An update on their association and mechanistic links. Periodontology 2000 2022, 89, 99–113. [Google Scholar] [CrossRef]
  26. Elghannam, M.T.; Hassanien, M.H.; Ameen, Y.A.; Turky, E.A.; Elattar, G.M.; ElRay, A.A.; Eltalkawy, M.D. Oral microbiota and liver diseases. Clin. Nutr. ESPEN 2023, 54, 68–72. [Google Scholar] [CrossRef]
  27. Lei, Y.; Li, S.; He, M.; Ao, Z.; Wang, J.; Wu, Q.; Wang, Q. Oral Pathogenic Bacteria and the Oral-Gut-Liver Axis: A New Understanding of Chronic Liver Diseases. Diagnostics 2023, 13, 3324. [Google Scholar] [CrossRef]
  28. Yamashita, Y.; Takeshita, T. The oral microbiome and human health. J. Oral Sci. 2017, 59, 201–206. [Google Scholar] [CrossRef]
  29. Takeshita, T.; Nakano, Y.; Kumagai, T.; Yasui, M.; Kamio, N.; Shibata, Y.; Shiota, S.; Yamashita, Y. The ecological proportion of indigenous bacterial populations in saliva is correlated with oral health status. Isme J. 2009, 3, 65–78. [Google Scholar] [CrossRef]
  30. Kelly, T.N.; Bazzano, L.A.; Ajami, N.J.; He, H.; Zhao, J.; Petrosino, J.F.; Correa, A.; He, J. Gut Microbiome Associates With Lifetime Cardiovascular Disease Risk Profile Among Bogalusa Heart Study Participants. Circ. Res. 2016, 119, 956–964. [Google Scholar] [CrossRef]
  31. Takeshita, T.; Kageyama, S.; Furuta, M.; Tsuboi, H.; Takeuchi, K.; Shibata, Y.; Shimazaki, Y.; Akifusa, S.; Ninomiya, T.; Kiyohara, Y.; et al. Bacterial diversity in saliva and oral health-related conditions: The Hisayama Study. Sci. Rep. 2016, 6, 22164. [Google Scholar] [CrossRef]
  32. Wang, M.; Yan, L.-Y.; Qiao, C.-Y.; Zheng, C.-C.; Niu, C.-G.; Huang, Z.-W.; Pan, Y.-H. Ecological shifts of salivary microbiota associated with metabolic-associated fatty liver disease. Front. Cell. Infect. Microbiol. 2023, 13, 1131255. [Google Scholar] [CrossRef]
  33. Zhao, F.; Dong, T.; Yuan, K.Y.; Wang, N.J.; Xia, F.Z.; Liu, D.; Wang, Z.M.; Ma, R.; Lu, Y.L.; Huang, Z.W. Shifts in the Bacterial Community of Supragingival Plaque Associated With Metabolic-Associated Fatty Liver Disease. Front. Cell Infect. Microbiol. 2020, 10, 581888. [Google Scholar] [CrossRef]
  34. Dong, L.; Yin, J.; Zhao, J.; Ma, S.R.; Wang, H.R.; Wang, M.; Chen, W.; Wei, W.Q. Microbial Similarity and Preference for Specific Sites in Healthy Oral Cavity and Esophagus. Front. Microbiol. 2018, 9, 1603. [Google Scholar] [CrossRef] [PubMed]
  35. Pérez-Chaparro, P.J.; McCulloch, J.A.; Mamizuka, E.M.; Moraes, A.; Faveri, M.; Figueiredo, L.C.; Duarte, P.M.; Feres, M. Do different probing depths exhibit striking differences in microbial profiles? J. Clin. Periodontol. 2018, 45, 26–37. [Google Scholar] [CrossRef] [PubMed]
  36. Zaura, E.; Keijser, B.J.; Huse, S.M.; Crielaard, W. Defining the healthy “core microbiome” of oral microbial communities. BMC Microbiol. 2009, 9, 259. [Google Scholar] [CrossRef] [PubMed]
  37. Bahadoran, Z.; Mirmiran, P.; Carlström, M.; Ghasemi, A. Inorganic nitrate: A potential prebiotic for oral microbiota dysbiosis associated with type 2 diabetes. Nitric Oxide 2021, 116, 38–46. [Google Scholar] [CrossRef]
  38. Chen, B.; Wang, Z.; Wang, J.; Su, X.; Yang, J.; Zhang, Q.; Zhang, L. The oral microbiome profile and biomarker in Chinese type 2 diabetes mellitus patients. Endocrine 2020, 68, 564–572. [Google Scholar] [CrossRef]
  39. Li, B.Z.; Zhou, H.Y.; Guo, B.; Chen, W.J.; Tao, J.H.; Cao, N.W.; Chu, X.J.; Meng, X. Dysbiosis of oral microbiota is associated with systemic lupus erythematosus. Arch. Oral. Biol. 2020, 113, 104708. [Google Scholar] [CrossRef]
  40. Bui, F.Q.; Almeida-da-Silva, C.L.C.; Huynh, B.; Trinh, A.; Liu, J.; Woodward, J.; Asadi, H.; Ojcius, D.M. Association between periodontal pathogens and systemic disease. Biomed. J. 2019, 42, 27–35. [Google Scholar] [CrossRef]
  41. Zhai, Q.; Wu, H.; Zheng, S.; Zhong, T.; Du, C.; Yuan, J.; Peng, J.; Cai, C.; Li, J. Association between gut microbiota and NAFLD/NASH: A bidirectional two-sample Mendelian randomization study. Front. Cell Infect. Microbiol. 2023, 13, 1294826. [Google Scholar] [CrossRef]
  42. Qin, N.; Yang, F.; Li, A.; Prifti, E.; Chen, Y.; Shao, L.; Guo, J.; Le Chatelier, E.; Yao, J.; Wu, L.; et al. Alterations of the human gut microbiome in liver cirrhosis. Nature 2014, 513, 59–64. [Google Scholar] [CrossRef]
  43. Palmas, V.; Pisanu, S.; Madau, V.; Casula, E.; Deledda, A.; Cusano, R.; Uva, P.; Vascellari, S.; Loviselli, A.; Manzin, A.; et al. Gut microbiota markers associated with obesity and overweight in Italian adults. Sci. Rep. 2021, 11, 5532. [Google Scholar] [CrossRef]
  44. Aranaz, P.; Ramos-Lopez, O.; Cuevas-Sierra, A.; Martinez, J.A.; Milagro, F.I.; Riezu-Boj, J.I. A predictive regression model of the obesity-related inflammatory status based on gut microbiota composition. Int. J. Obes. 2021, 45, 2261–2268. [Google Scholar] [CrossRef]
  45. Chen, B.Y.; Lin, W.Z.; Li, Y.L.; Bi, C.; Du, L.J.; Liu, Y.; Zhou, L.J.; Liu, T.; Xu, S.; Shi, C.J.; et al. Roles of oral microbiota and oral-gut microbial transmission in hypertension. J. Adv. Res. 2023, 43, 147–161. [Google Scholar] [CrossRef]
  46. Wang, L.; Xu, J.; You, N.; Shao, L.; Zhuang, Z.; Zhuo, L.; Liu, J.; Shi, J. Characteristics of intestinal flora in nonobese nonalcoholic fatty liver disease patients and the impact of ursodeoxycholic acid treatment on these features. Lipids 2024, 59, 193–207. [Google Scholar] [CrossRef]
  47. Huang, F.; Lyu, B.; Xie, F.; Li, F.; Xing, Y.; Han, Z.; Lai, J.; Ma, J.; Zou, Y.; Zeng, H.; et al. From gut to liver: Unveiling the differences of intestinal microbiota in NAFL and NASH patients. Front. Microbiol. 2024, 15, 1366744. [Google Scholar] [CrossRef]
  48. Lei, W.Y.; Chang, W.H.; Shih, S.C.; Liu, C.J.; Shih, C.H. Pyogenic liver abscess with Prevotella species and Fusobacterium necrophorum as causative pathogens in an immunocompetent patient. J. Formos. Med. Assoc. 2009, 108, 253–257. [Google Scholar] [CrossRef]
  49. Jiang, W.; Wu, N.; Wang, X.; Chi, Y.; Zhang, Y.; Qiu, X.; Hu, Y.; Li, J.; Liu, Y. Dysbiosis gut microbiota associated with inflammation and impaired mucosal immune function in intestine of humans with non-alcoholic fatty liver disease. Sci. Rep. 2015, 5, 8096. [Google Scholar] [CrossRef]
  50. Tonomura, S.; Naka, S.; Tabata, K.; Hara, T.; Mori, K.; Tanaka, S.; Sumida, Y.; Kanemasa, K.; Nomura, R.; Matsumoto-Nakano, M. Relationship between Streptococcus mutans expressing Cnm in the oral cavity and non-alcoholic steatohepatitis: A pilot study. BMJ Open Gastroenterol. 2019, 6, e000329. [Google Scholar] [CrossRef]
Figure 1. Flowchart of this study. CAP, controlled attenuation parameter; MASLD, metabolic dysfunction associated steatotic liver disease; ALD, alcohol-associated liver disease; HCV, hepatitis C virus.
Jcm 14 02013 g001
Figure 2. Comparative analyses of the diversity in oral microbiota. (a) Chao-1 index, (b) Shannon index, (c) principal coordinate analysis. ** p < 0.01.
Jcm 14 02013 g002
Table 1. Factor loading matrix for oral microbiota patterns identified by the principal component analysis.
ClassificationSpeciesFactor 1Factor 2Factor 3Factor 4
PhylumActinobacteria0.010.129−0.0920.029
Bacteroidetes0.005−0.111−0.002−0.028
Candidatus Saccharibacteria−0.044−0.001−0.106−0.004
Firmicutes0.0790.0170.083−0.015
Fusobacteria0.0350.0390.030.164
Proteobacteria−0.064−0.0210.037−0.017
ClassActinobacteria0.010.129−0.0920.029
Bacilli0.0350.0280.066−0.04
Bacteroidia0.008−0.111−0.004−0.033
Clostridia0.0290.023−0.0290.116
Fusobacteriia0.0350.0390.030.164
Gammaproteobacteria0.028−0.0090.1240.036
Negativicutes0.104−0.0340.0620.016
OrderActinomycetales−0.0050.143−0.0890.035
Bacteroidales0.008−0.111−0.004−0.033
Betaproteobacteria−0.102−0.021−0.027−0.047
Clostridiales0.030.023−0.0290.117
Coriobacteriales0.043−0.013−0.031−0.011
Fusobacteriales0.0350.0390.030.164
Lactobacillales0.0360.0250.065−0.043
Neisseriales−0.102−0.021−0.028−0.047
Pasteurellales0.029−0.010.1240.036
Selenomonadales0.104−0.0340.0620.016
FamilyActinomycetaceae0.0130.066−0.0980.051
Carnobacteriaceae−0.0180.0320.026−0.007
Coriobacteriaceae0.043−0.013−0.031−0.011
Fusobacteriaceae0.0260.0270.0530.143
Lachnospiraceae0.040.023−0.0360.094
Micrococcaceae−0.0120.111−0.0330.006
Neisseriaceae−0.102−0.021−0.028−0.047
Pasteurellaceae0.029−0.010.1240.036
Porphyromonadaceae−0.044−0.0080.0160.026
Prevotellaceae0.021−0.104−0.009−0.039
Streptococcaceae0.0410.0220.066−0.043
Veillonellaceae0.104−0.0340.0620.016
GenusActinomyces0.0120.066−0.0980.051
Atopobium0.042−0.015−0.032−0.013
Fusobacterium0.0260.0270.0530.143
Granulicatella−0.0180.0320.026−0.007
Haemophilus0.029−0.010.1240.037
Neisseria−0.102−0.021−0.028−0.047
Porphyromonas−0.045−0.010.0160.023
Prevotella0.027−0.098−0.009−0.046
Rothia−0.0120.111−0.0330.006
Saccharibacteria_genera_incertae_sedis−0.044−0.001−0.106−0.004
Streptococcus0.0410.0220.066−0.043
Veillonella0.105−0.0350.0690.013
Table 2. Relative abundance of oral microbiota genera species among four oral microbiota patterns.
GeneraFirst Group
n = 334
Second Group
n = 86
Third Group
n = 149
Fourth Group
n = 143
Actinomyces6.4 (4.5–8.9)7.1 (3.3–11.2)6.9 (4.6–10.3)6.1 (4.5–7.3)
Atopobium1.5 (0.7–2.8)1.4 (0.5–2.5)1.5 (0.6–2.7)2.5 (0.9–4.0)
Fusobacterium2.0 (1.2–2.7)0.9 (0.4–1.8)4.1 (2.8–5.6)1.3 (0.5–2.2)
Granulicatella1.2 (0.8–1.8)1.9 (1.2–2.5)1.2 (0.7–1.7)1.2 (0.7–1.9)
Haemophilus4.2 (2.1–6.1)4.3 (1.2–7.6)4.4 (2.3–7.6)4.3 (1.9–8.0)
Neisseria10.6 (4.2–17.9)2.3 (0.4–5.4)6.9 (2.6–11.1)1.6 (0.5–4.8)
Porphyromonas1.8 (0.6–4.4)0.3 (0.1–1.1)2.8 (1.3–5.1)0.5 (0.2–1.5)
Prevotella16.8 (10.6–21.9)7.0 (3.3–11.1)14.5 (8.7–20.6)18.6 (11.8–23.8)
Rothia3.1 (1.8–5.3)13.7 (9.2–20.3)2.8 (1.5–5.2)4.8 (2.9–6.3)
Saccharibacteria_genera_incertae_sedis9.0 (4.8–14.5)2.3 (0.5–4.5)6.6 (3.4–11.2)2.6 (0.9–5.6)
Streptococcus17.3 (13.8–21.1)32.7 (25.5–38.9)15.5 (11.9–19.6)26.2 (22.0–32.1)
Veillonella7.4 (5.3–9.6)8.3 (5.7–20.3)8.3 (6.4–10.6)12.7 (9.8–15.7)
Data are presented as median (range).
Table 3. Participants’ characteristics among the oral microbiota patterns.
Neisseria Group
n = 334
Streptococcus Group
n = 86
Fusobacterium Group
n = 149
Veillonella Group
n = 143
Neisseria vs. StreptococcusNeisseria vs. FusobacteriumNeisseria vs. Veillonella
sex, male94 (28.1%)41 (47.7%)62 (41.6%)40 (28.0%)0.0050.0290.999
Age (year)50.0 (37.0–64.0)57.0 (38.0–68.0)57.0 (42.0–66.0)56.0 (39.0–66.0)0.2250.1140.183
BMI (kg/m2)22.2 (19.6–24.6)21.8 (20.2–23.6)23.2 (20.7–25.8)22.3 (20.0–25.1)0.9640.0090.639
Waist circumference (cm)74.0 (67.2–82.5)74.2 (68.9–82.8)79.0 (71.0–86.4)74.4 (68.0–83.8)0.762<0.0010.667
Fasting blood sugar (mmHg)90.0 (85.0–98.0)92.5 (86.8–100.3)92.0 (87.5–100.5)92.0 (85.0–98.0)0.2630.0410.794
HbA1c (%)5.7 (5.5–5.9)5.7 (5.5–6.0)5.7 (5.5–5.9)5.7 (5.5–5.9)0.6330.8900.895
Systolic blood pressure (mmHg)120.0 (109.0–131.3)121.5 (110.5–133.5)127.0 (114.5–139.0)123.0 (111.0–134.0)0.9970.0040.498
Diastolic blood pressure (mmHg)76.0 (69.0–83.0)76.0 (69.0–82.8)78.0 (69.5–87.0)77.0 (71.0–86.0)0.9870.1880.196
Triglycerides (mg/dL)72.0 (50.0–105.0)77.0 (53.8–97.3)82.0 (57.0–123.5)75.0 (54.0–110.0)0.9620.0360.663
HDL cholesterol (mg/dL)63.0 (53.0–74.3)62.0 (54.8–78.3)62.0 (50.0–75.0)64.0 (55.0–78.0)0.9070.9990.475
LDL cholesterol (mg/dL)116.0 (96.8–135.3)112.0 (98.5–136.5)119.0 (99.5–142.0)118.0 (99.0–138.0)0.9990.2990.535
Aspartate aminotransferase (IU/L)20.0 (17.0–24.0)22.0 (17.0–25.0)21.0 (17.5–26.0)20.0 (17.0–25.0)0.4470.0990.955
Alanine aminotransferase (IU/L)17.0 (12.0–23.0)18.0 (13.0–23.0)20.0 (14.0–29.0)17.0 (13.0–24.0)0.7620.0060.646
γ-Glutamyl TransPeptidase (IU/L)19.0 (14.0–31.0)21.0 (15.0–35.0)21.0 (17.0–35.0)20.0 (15.0–30.0)0.3550.0170.739
CAP (dB/m)208.0 (168.8–251.3)211.5 (174.5–261.3)223.0 (195.0–274.0)228.0 (185.0–267.0)0.9430.0020.084
LSM (kPa)4.3 (3.5–5.4)4.1 (3.5–5.6)4.4 (3.6–5.3)4.3 (3.6–5.4)0.9820.9860.999
Fatty liver index10.7 (4.1–28.4)11.8 (4.7–23.0)20.2 (6.8–45.8)13.4 (5.7–31.7)0.868<0.0010.338
Smoking habit35 (10.5%)17 (19.8%)19 (12.8%)22 (15.4%)0.1900.9990.999
Exercise habit57 (17.1%)18 (20.9%)30 (20.1%)18 (12.6%)0.9990.9990.999
MASLD115 (34.4%)31 (36.0%)66 (44.3%)65 (45.5%)0.9990.3000.180
Cardiometabolic risk factors
    High blood pressure144 (43.1%)44 (51.2%)91 (61.1%)71 (49.7%)0.9990.0020.999
    Obesity/central obesity85 (25.4%)19 (22.1%)58 (38.9%)40 (28.0%)0.9990.0230.999
    Hyperglycemia or diabetes182 (54.5%)56 (65.1%)86 (57.7%)84 (58.7%)0.5900.9990.999
    Resuce HDL-cholesterol12.3%8 (9.3%)19 (12.8%)11 (7.7%)0.9990.9990.999
    High triglycerides68 (20.4%)17 (19.8%)41 (27.5%)30 (21.0%)0.9990.6300.999
Cardiometabolic crieria ≥ 376 (22.8%)17 (19.8%)53 (35.6%)37 (25.9%)0.9990.0280.999
Data are presented as numbers (%) or median (range). HbA1c, hemoglobin A1c; BMI, body mass index; HDL, high-density lipoprotein; LDL, low density; CAP, controlled attenuation parameter; LSM, liver stiffness measure; MASLD, metabolic dysfunction-associated steatotic liver disease.
Table 4. The univariable and multivariate analyses of risk factors for MASLD.
UnivariableMultivariable
OR95%CIp-ValueOR95%CIp-Value
Male1.641.192.250.0021.410.952.090.084
Age1.021.011.03<0.0011.010.991.020.405
smoking habit1.561.012.420.0451.510.872.610.140
exercise habit1.140.771.690.5220.930.581.490.773
Obesity/central obesity7.285.0610.50<0.0014.913.277.35<0.001
Hyperglycemia or diabetes4.223.015.92<0.0012.901.924.36<0.001
High blood pressure2.551.873.48<0.0011.420.952.140.092
High triglycerides3.692.545.35<0.0012.291.482.55<0.001
Reduce HDL-cholesterol4.542.727.58<0.0012.701.474.95<0.001
Oral microbiota pattern
   Neisseria group1.00 1.00
   Streptococcus group1.070.651.760.7790.960.541.720.894
   Fusobacterium group1.511.022.250.0391.080.671.730.767
   Veillonella group1.591.062.370.0231.681.052.700.031
OR, odds ratio; CI, confidence interval; MASLD, metabolic dysfunction-associated steatotic liver disease.
Table 5. Single correlation analyses between MASLD-related items and oral microbiota.
NeisseriaStreptococcusFusobacteriumVeillonella
rp-Valuerp-Valuerp-Valuerp-Value
CAP−0.132<0.001−0.0940.0120.0350.3450.158<0.001
BMI−0.1210.001−0.0540.1530.0140.7120.138<0.001
Waist circumference−0.1240.001−0.0480.2030.0450.2360.1180.002
Systolic blood pressure−0.0650.084−0.0490.1920.0010.9880.1120.003
Diastolic blood pressure−0.0670.0720.0070.846−0.0280.4620.0970.010
Blood glucose−0.0920.0140.0130.725−0.0330.3820.0950.012
HbA1c−0.1090.0040.0270.465−0.0750.0460.1040.006
Triglycerides−0.1240.001−0.050.186−0.0010.9700.148<0.001
HDL cholesterol0.0760.0410.0230.5330.0150.689−0.0790.034
Aspartate aminotransferase−0.060.107−0.0530.1550.0720.0540.0920.014
Alanine aminotransferase−0.1070.004−0.0780.0370.1150.0020.0890.018
Gamma-glutamyl transpeptidase−0.14<0.001−0.0750.0460.0420.2670.160<0.001
Fatty liver index−0.0830.026−0.0630.0920.0950.0110.0700.062
LSM−0.040.2830.0180.6370.0300.4250.0200.602
r, Pearson’s correlation coefficient; CAP, controlled attenuation parameter; BMI, body mass index; HbA1c, hemoglobin A1c; HDL, high-density lipoprotein; LSM, liver stiffness measure; MASLD, metabolic dysfunction-associated steatotic liver disease.
Table 6. Multiple analyses between MASLD-related items and oral microbiota.
NeisseriaStreptococcusFusobacteriumVeillonella
βpR2βpR2βpR2βpR2
CAP−0.0920.0170.065−0.1250.0010.0300.0530.1780.0280.137<0.0010.038
Body mass index−0.0990.0100.067−0.0710.0700.0210.0010.9720.0250.137<0.0010.038
Waist circumference−0.0970.0230.065−0.0900.0400.0220.0300.4950.0260.1330.0020.034
Systolic blood pressure−0.0580.1500.061−0.0590.1550.019−0.0020.9690.0250.1010.0150.029
Diastolic blood pressure−0.0570.1360.0610.0070.8550.016−0.0400.3060.0270.0880.0230.028
Blood glucose−0.0590.1350.0610.0010.9810.016−0.0290.4650.0260.0690.0870.025
HbA1c−0.0770.0460.0630.0160.6780.016−0.0600.1290.0280.0730.0620.026
Triglycerides−0.0730.0650.062−0.0870.0310.0230.0020.9630.0250.136<0.0010.036
HDL cholesterol0.0500.2070.0600.0460.2560.0180.0470.2500.027−0.0980.0160.029
Aspartate aminotransferase−0.0660.1000.062−0.0580.1570.0190.0600.1370.0280.0940.0210.028
Alanine aminotransferase−0.1030.0110.067−0.1010.0140.0250.1000.0140.0330.1040.0110.030
Gamma-glutamyl transpeptidase−0.0520.1990.060−0.0950.0210.0240.0870.0340.0310.0740.0740.025
Fatty liver index−0.1050.0120.066−0.1290.0030.0290.0400.3470.0260.172<0.0010.043
LSM−0.0380.3020.0590.0170.6510.0160.0250.4970.0260.0220.5600.021
The multivariate analysis was adjusted for age, sex, smoking habits, exercise habits, and medication for hypertension, dyslipidemia, or diabetes mellitus. β, standardized coeffi-cient; R2, coefficient of determination; CAP, controlled attenuation parameter; BMI, body mass index; HbA1c, hemoglobin A1c; HDL, high-density lipoprotein; LSM, liver stiffness measure; MASLD, metabolic dysfunction-associated steatotic liver disease.
Disclaimer/Publisher’s Note: The statements, opinions and data contained in all publications are solely those of the individual author(s) and contributor(s) and not of MDPI and/or the editor(s). MDPI and/or the editor(s) disclaim responsibility for any injury to people or property resulting from any ideas, methods, instructions or products referred to in the content.

