
Smoothed Growth Trajectories for Weight, Length/Height, and BMI Percentiles of Children Aged 3 to 60 Months in Punjab, Pakistan

 , , ,
, , ,  and
and 
Abstract
1. Introduction
2. Materials and Methods
2.1. Sample and Design
2.2. Anthropometric Measurements
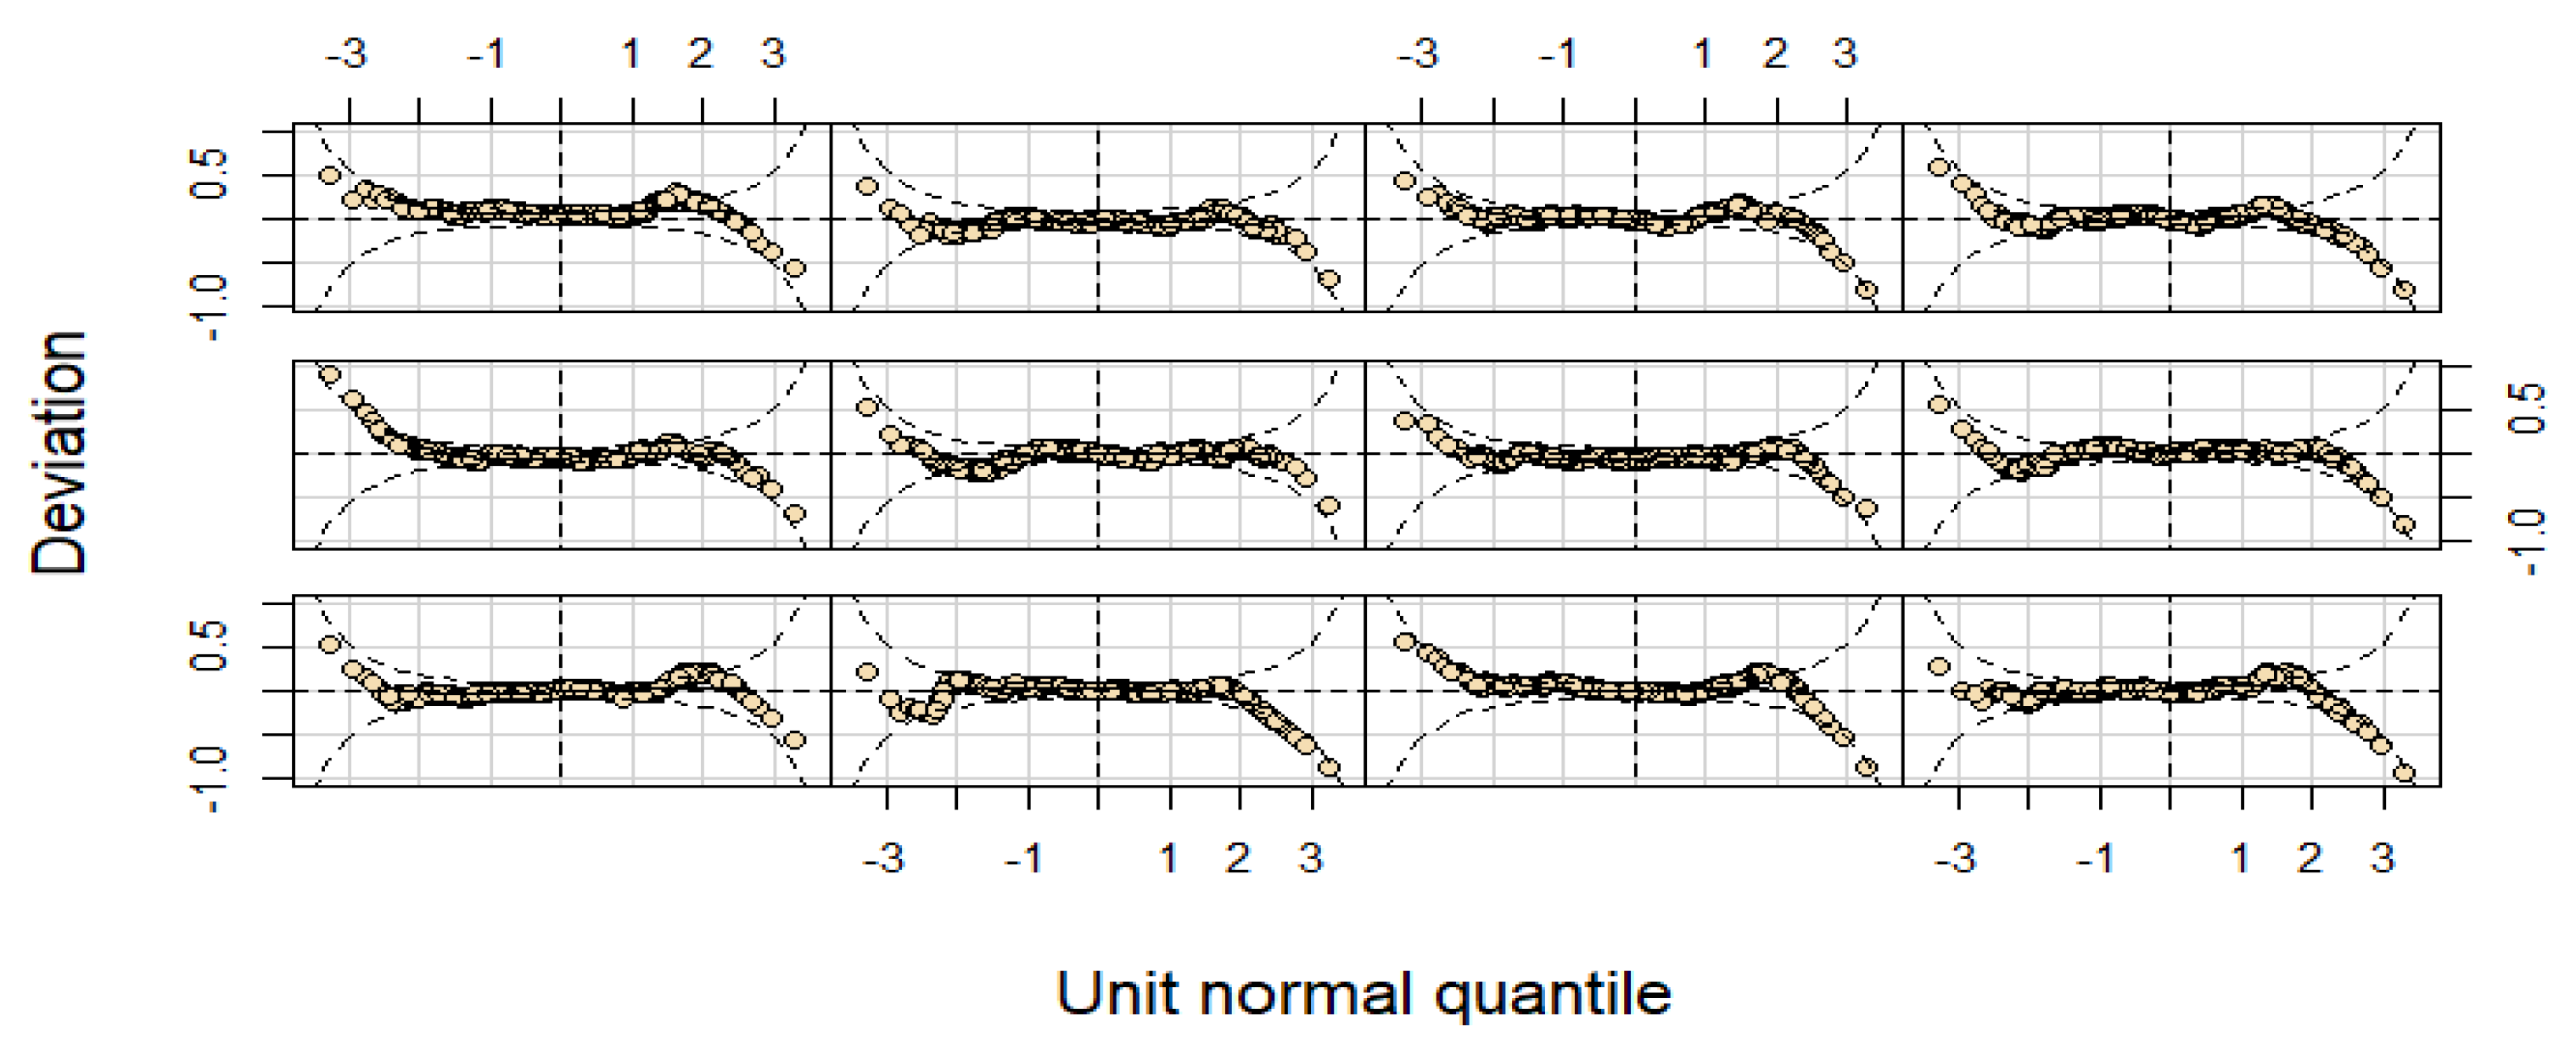
2.3. Statistical Methods and Analysis
3. Results
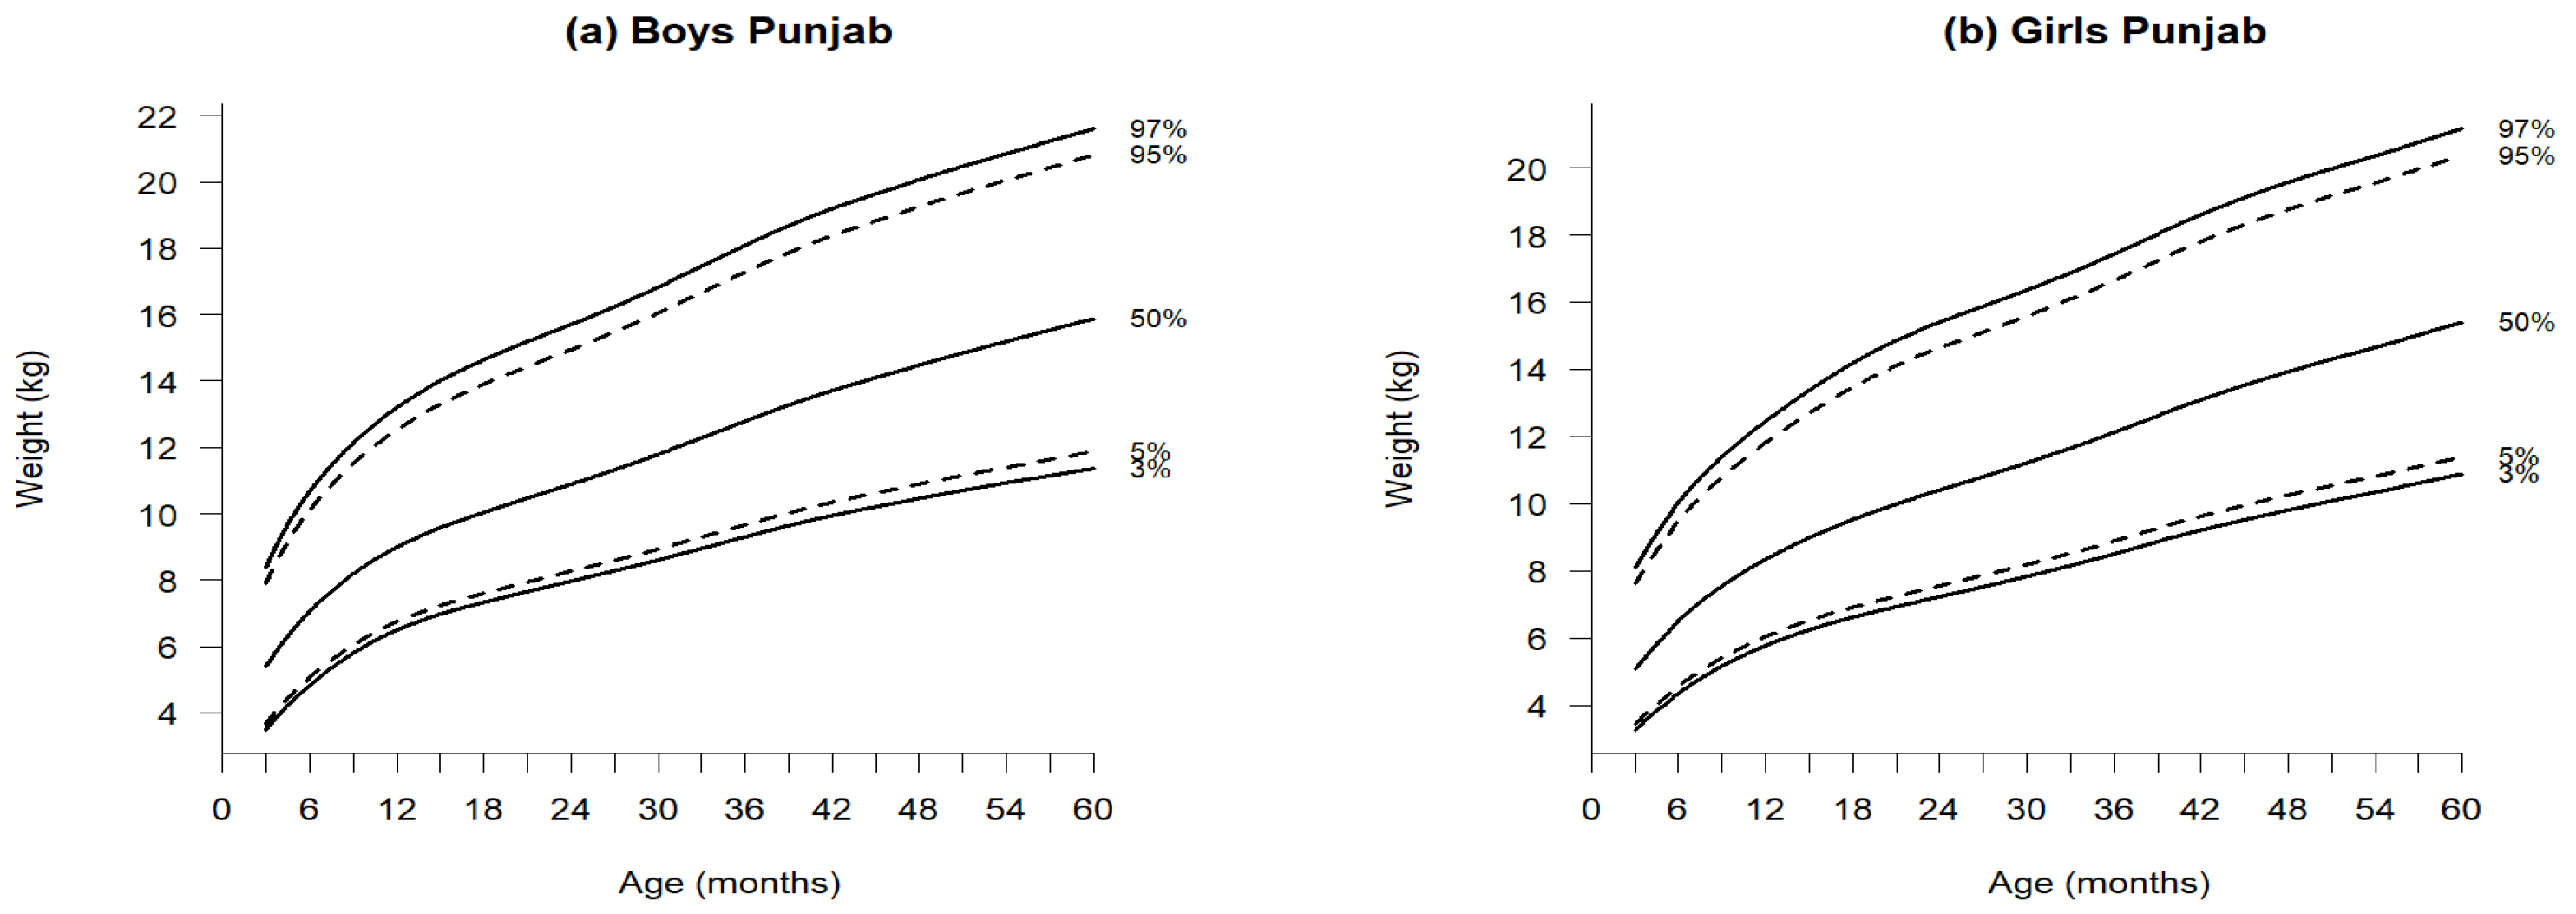
3.1. Weight-for-Age
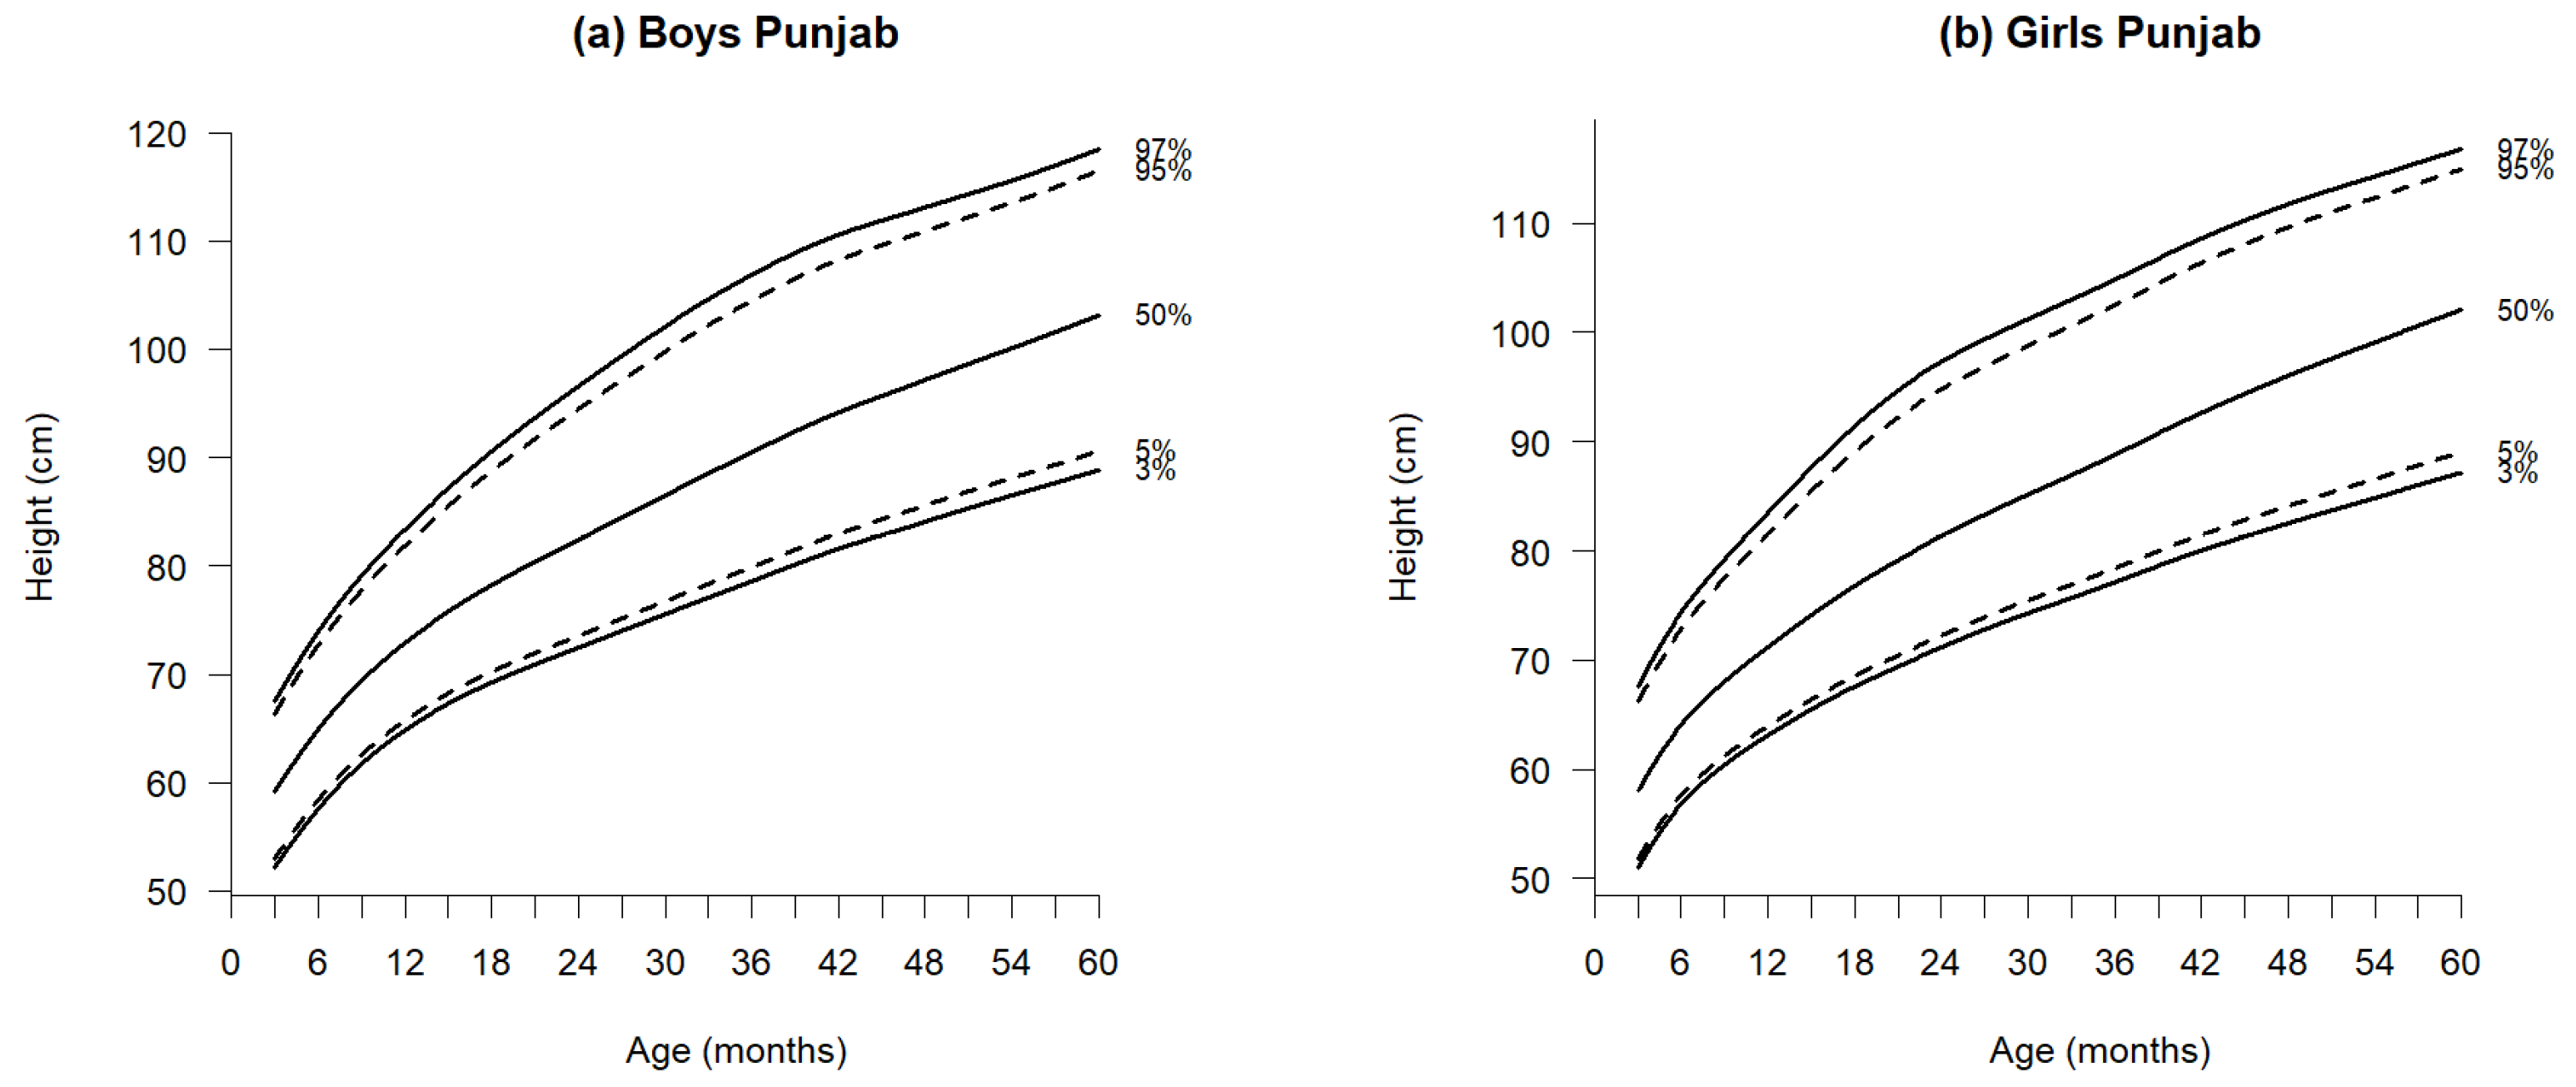
3.2. Length/Height-for-Age
3.3. BMI-for-Age
4. Discussion
Strengths and Limitations
5. Conclusions
Author Contributions
Funding
Institutional Review Board Statement
Informed Consent Statement
Data Availability Statement
Acknowledgments
Conflicts of Interest
Abbreviations
| MDPI | Multidisciplinary Digital Publishing Institute |
| DOAJ | Directory of open access journals |
| TLA | Three letter acronym |
| LD | Linear dichroism |
Appendix A

| Theoretical Percentiles | Empirical Percentiles | Empirical Percentiles | ||||
|---|---|---|---|---|---|---|
| Boys | Girls | |||||
| Weight (kg) | Height (cm) | BMI (kg/m2) | Weight (kg) | Height (cm) | BMI (kg/m2) | |
| 3 | 3.47 | 3.38 | 2.92 | 3.35 | 3.40 | 3.67 |
| 5 | 4.89 | 5.39 | 4.77 | 5.15 | 5.37 | 5.31 |
| 15 | 15.23 | 15.02 | 14.38 | 14.89 | 14.87 | 14.49 |
| 25 | 24.93 | 24.52 | 24.52 | 24.59 | 24.64 | 24.27 |
| 50 | 49.87 | 49.59 | 50.54 | 50.26 | 49.98 | 50.76 |
| 75 | 74.84 | 75.86 | 75.06 | 75.48 | 75.88 | 76.21 |
| 85 | 84.69 | 85.64 | 85.77 | 84.94 | 85.40 | 85.85 |
| 95 | 95.87 | 94.23 | 95.04 | 94.53 | 94.16 | 94.63 |
| 97 | 97.75 | 96.22 | 96.99 | 96.71 | 96.57 | 96.61 |
| Age (Months) | n | Weight (kg) | Height (cm) | BMI (kg/m2) | |||||||||
|---|---|---|---|---|---|---|---|---|---|---|---|---|---|
| Mean ± SD | Median | Skew | Kurt | Mean ± SD | Median | Skew | Kurt | Mean ± SD | Median | Skew | Kurt | ||
| 3 | 487 | 5.04 ± 1.14 | 5.00 | 0.84 | 4.36 | 57.51 ± 4.76 | 57.70 | −0.03 | 2.28 | 15.11 ± 3.34 | 14.72 | 0.56 | 3.69 |
| 6 | 506 | 6.99 ± 1.57 | 6.80 | 0.85 | 4.29 | 65.06 ± 4.65 | 65.00 | 0.26 | 3.41 | 16.42 ± 3.22 | 15.98 | 0.75 | 3.59 |
| 9 | 528 | 8.20 ± 1.67 | 8.00 | 0.62 | 3.82 | 68.84 ± 3.86 | 68.80 | 0.14 | 3.04 | 17.23 ± 3.23 | 16.79 | 0.57 | 3.57 |
| 12 | 531 | 9.17 ± 1.82 | 8.90 | 1.24 | 4.88 | 72.88 ± 4.92 | 72.40 | 0.65 | 3.62 | 17.18 ± 3.08 | 16.60 | 0.80 | 3.68 |
| 15 | 549 | 9.75 ± 1.89 | 9.50 | 1.06 | 4.61 | 75.38 ± 5.35 | 75.00 | 0.55 | 3.45 | 17.01 ± 3.06 | 16.49 | 0.70 | 3.70 |
| 18 | 551 | 10.14 ± 2.08 | 9.80 | 0.96 | 3.92 | 78.32 ± 5.86 | 77.6 | 0.46 | 2.79 | 16.52 ± 3.03 | 16.19 | 0.51 | 3.49 |
| 21 | 522 | 10.72 ± 1.95 | 10.45 | 0.69 | 3.25 | 80.74 ± 6.29 | 80.1 | 0.83 | 4.27 | 16.53 ± 2.91 | 16.27 | 0.67 | 4.04 |
| 24 | 447 | 11.11 ± 2.13 | 10.80 | 0.87 | 3.78 | 82.18 ± 6.75 | 81.4 | 0.74 | 3.83 | 16.45 ± 2.94 | 16.10 | 0.99 | 4.36 |
| 27 | 591 | 11.48 ± 2.10 | 11.20 | 0.78 | 3.67 | 84.50 ± 6.44 | 83.80 | 0.69 | 4.04 | 16.13 ± 2.86 | 15.78 | 0.92 | 4.66 |
| 30 | 550 | 11.84 ± 2.12 | 11.70 | 0.60 | 3.98 | 86.74 ± 7.04 | 85.80 | 0.71 | 3.62 | 15.78 ± 2.57 | 15.54 | 0.54 | 4.36 |
| 33 | 585 | 12.46 ± 2.27 | 12.30 | 0.82 | 4.08 | 89.28 ± 7.65 | 88.50 | 0.62 | 3.68 | 15.70 ± 2.65 | 15.37 | 0.83 | 4.59 |
| 36 | 570 | 12.84 ± 2.46 | 12.50 | 0.79 | 3.76 | 90.02 ± 7.41 | 89.50 | 0.37 | 2.99 | 15.88 ± 2.70 | 15.48 | 0.96 | 4.60 |
| 39 | 624 | 13.52 ± 2.28 | 13.30 | 0.48 | 3.27 | 92.70 ± 7.61 | 92.20 | 0.34 | 3.38 | 15.81 ± 2.62 | 15.29 | 0.81 | 4.22 |
| 42 | 563 | 14.11 ± 2.52 | 13.70 | 0.72 | 3.55 | 95.33 ± 7.91 | 94.70 | 0.65 | 3.69 | 15.58 ± 2.67 | 15.07 | 1.13 | 5.00 |
| 45 | 581 | 14.21 ± 2.51 | 14.00 | 0.72 | 3.71 | 95.92 ± 7.81 | 95.70 | 0.58 | 3.72 | 15.48 ± 2.54 | 15.07 | 0.83 | 4.04 |
| 48 | 610 | 14.44 ± 2.54 | 14.30 | 0.50 | 3.48 | 96.74 ± 7.68 | 96.60 | 0.27 | 3.25 | 15.47 ± 2.72 | 15.15 | 0.89 | 4.95 |
| 51 | 514 | 15.15 ± 2.73 | 14.90 | 0.47 | 2.99 | 99.03 ± 7.80 | 99.20 | 0.22 | 3.81 | 15.52 ± 2.74 | 15.04 | 1.11 | 4.55 |
| 54 | 529 | 15.25 ± 2.56 | 14.90 | 0.53 | 3.04 | 99.89 ± 7.30 | 100.20 | 0.25 | 3.56 | 15.32 ± 2.52 | 14.81 | 1.10 | 5.00 |
| 57 | 533 | 15.62 ± 2.66 | 15.30 | 0.33 | 2.86 | 101.33 ± 7.71 | 101.10 | 0.08 | 3.11 | 15.27 ± 2.46 | 14.92 | 0.77 | 4.14 |
| 60 | 360 | 15.99 ± 2.70 | 15.80 | 0.14 | 2.50 | 103.08 ± 8.19 | 102.35 | 0.23 | 2.96 | 15.11 ± 2.35 | 14.82 | 0.63 | 3.97 |
| Total | 10,731 | ||||||||||||
| Age (Months) | n | Weight (kg) | Height (cm) | BMI (kg/m2) | |||||||||
|---|---|---|---|---|---|---|---|---|---|---|---|---|---|
| Mean ± SD | Median | Skew | Kurt | Mean ± SD | Median | Skew | Kurt | Mean ± SD | Median | Skew | Kurt | ||
| 3 | 484 | 4.88 ± 1.43 | 4.60 | 1.07 | 4.42 | 56.71 ± 5.11 | 56.40 | 0.63 | 4.50 | 15.09 ± 3.43 | 14.46 | 0.75 | 3.74 |
| 6 | 474 | 6.44 ± 1.49 | 6.40 | 0.65 | 4.23 | 63.54 ± 4.60 | 63.00 | 0.72 | 4.27 | 15.91 ± 3.28 | 15.54 | 0.51 | 3.43 |
| 9 | 507 | 7.59 ± 1.53 | 7.50 | 0.73 | 3.96 | 67.78 ± 4.87 | 67.60 | 0.28 | 3.16 | 16.55 ± 3.23 | 15.98 | 0.78 | 3.83 |
| 12 | 470 | 8.41 ± 1.75 | 8.10 | 1.16 | 5.22 | 71.01 ± 5.59 | 70.10 | 1.22 | 5.84 | 16.69 ± 3.14 | 16.27 | 0.56 | 3.80 |
| 15 | 540 | 9.08 ± 1.90 | 8.80 | 0.97 | 4.29 | 74.38 ± 6.08 | 73.50 | 0.91 | 4.13 | 16.41 ± 3.08 | 16.13 | 0.66 | 3.78 |
| 18 | 481 | 9.60 ± 1.91 | 9.40 | 0.73 | 3.77 | 76.87 ± 5.75 | 76.50 | 0.71 | 3.73 | 16.22 ± 2.91 | 15.93 | 0.56 | 3.96 |
| 21 | 519 | 10.42 ± 2.54 | 9.80 | 0.88 | 3.31 | 79.89 ± 7.45 | 78.60 | 0.72 | 3.36 | 16.22 ± 3.25 | 15.69 | 0.72 | 3.59 |
| 24 | 450 | 10.47 ± 2.09 | 10.20 | 0.69 | 3.61 | 81.93 ± 7.29 | 80.70 | 0.84 | 3.65 | 15.65 ± 2.69 | 15.51 | 0.46 | 3.68 |
| 27 | 559 | 10.98 ± 2.20 | 10.70 | 0.73 | 3.72 | 83.76 ± 7.06 | 83.20 | 0.71 | 4.09 | 15.68 ± 2.79 | 15.38 | 0.81 | 4.76 |
| 30 | 556 | 11.29 ± 2.11 | 10.90 | 0.63 | 3.99 | 85.27 ± 6.72 | 84.60 | 0.68 | 3.89 | 15.58 ± 2.75 | 15.35 | 0.71 | 4.76 |
| 33 | 531 | 11.91 ± 2.47 | 11.60 | 0.93 | 4.45 | 87.49 ± 7.74 | 86.40 | 0.86 | 4.22 | 15.58 ± 2.65 | 15.42 | 0.95 | 5.59 |
| 36 | 538 | 12.09 ± 2.47 | 11.90 | 0.66 | 3.79 | 88.75 ± 7.42 | 88.30 | 0.49 | 3.56 | 15.42 ± 2.99 | 15.14 | 0.74 | 4.49 |
| 39 | 519 | 12.64 ± 2.14 | 12.40 | 0.68 | 3.88 | 90.53 ± 6.74 | 90.10 | 0.47 | 3.75 | 15.48 ± 2.43 | 15.17 | 1.08 | 5.62 |
| 42 | 551 | 13.45 ± 2.60 | 13.00 | 0.63 | 3.22 | 93.32 ± 7.95 | 92.90 | 0.47 | 3.44 | 15.52 ± 2.81 | 15.10 | 0.98 | 4.22 |
| 45 | 528 | 13.67 ± 2.62 | 13.30 | 0.60 | 3.26 | 94.35 ± 7.72 | 94.10 | 0.36 | 3.33 | 15.40 ± 2.68 | 14.98 | 0.92 | 4.39 |
| 48 | 523 | 14.15 ± 2.71 | 13.80 | 0.42 | 3.26 | 95.88 ± 7.96 | 95.80 | 0.31 | 3.40 | 15.47 ± 2.88 | 14.96 | 0.78 | 4.24 |
| 51 | 502 | 14.45 ± 2.55 | 14.20 | 0.51 | 3.32 | 98.11 ± 8.11 | 98.10 | 0.28 | 3.33 | 15.09 ± 2.56 | 14.58 | 0.82 | 4.34 |
| 54 | 504 | 14.77 ± 2.60 | 14.60 | 0.42 | 3.19 | 98.75 ± 7.64 | 99.15 | −0.08 | 3.22 | 15.21 ± 2.59 | 14.84 | 0.96 | 4.52 |
| 57 | 498 | 14.91 ± 2.74 | 14.60 | 0.45 | 2.99 | 100.06 ± 7.89 | 100.00 | 0.06 | 3.26 | 14.97 ± 2.69 | 14.49 | 0.87 | 4.96 |
| 60 | 380 | 15.63 ± 2.71 | 15.40 | 0.29 | 2.84 | 101.87 ± 7.65 | 102.05 | −0.01 | 3.05 | 15.11 ± 2.46 | 14.66 | 1.06 | 5.40 |
| Total | 10,114 | ||||||||||||
References
- Tanner, J.M.; Demirjian, A. Growth as a mirror of the condition of society: Secular Trends and Class Distinctions. Acta Paediatr. Jpn. 1986, 29, 96–103. [Google Scholar] [CrossRef] [PubMed]
- Cole, T.J. The development of growth references and growth charts. Ann. Hum. Biol. 2012, 39, 382–394. [Google Scholar] [CrossRef]
- Borghi, E.; de Onis, M.; Garza, C.; Van den Broeck, J.; Frongillo, E.A.; Grummer-Strawn, L.; WHO Multicentre Growth Reference Study Group. Construction of the World Health Organization child growth standards: Selection of methods for attained growth curves. Stat. Med. 2006, 25, 247–265. [Google Scholar] [CrossRef]
- Nielsen, A.M.; Olsen, E.M.; Juul, A. New Danish reference values for height, weight and body mass index of children aged 0–5 years. Acta Paediatr. 2010, 99, 268–278. [Google Scholar] [CrossRef]
- Khadilkar, V.; Khadilkar, A.V.; Kajale, N. Indian growth references from 0-18-year-old children and adolescents comparison of two methods. Indian J. Endoc. Met. 2019, 23, 635. [Google Scholar] [CrossRef]
- El Shafie, A.M.; El-Gendy, F.M.; Allahony, D.M.; Hegran, H.H.; Omar, Z.A.; Samir, M.A.; Kasemy, Z.A.; El-Bazzar, A.N.; Abd El-Fattah, M.A.; Abdel Monsef, A.A.; et al. Development of LMS and Z score growth references for Egyptian children from birth up to 5 years. Front. Pediatr. 2021, 18, 598499. [Google Scholar] [CrossRef]
- Akbar, N.; Aslam, M.; Petersen, J.H.; Mustafa, G. The 2022 Pakistani references from birth to 60 months for length/height, weight and body mass index. Acta Paediatr. 2023, 112, 1249–1258. [Google Scholar] [CrossRef]
- Asif, M.; Aslam, M.; Wyszyńska, J.; Altaf, S. Establishing body mass index growth charts for Pakistani children and adolescents using the Lambda-Mu-Sigma (LMS) and quantile regression method. Minerva Pediatr. 2020, 75, 866–875. [Google Scholar] [CrossRef]
- Mushtaq, M.U.; Gull, S.; Mushtaq, K.; Abdullah, H.M.; Khurshid, U.; Shahid, U.; Shad, M.A.; Akram, J. Height, weight and BMI percentiles and nutritional status relative to the international growth references among Pakistani school-aged children. BMC Pediatr. 2012, 12, 31. [Google Scholar] [CrossRef]
- Aziz, S.; Ain, W.N.; Majeed, R.; Khan, M.A.; Qayum, I.; Ahmed, I.; Hosain, K. Growth centile charts (anthropometric measurement) of Pakistani pediatric population. J. Pak. Med. Assoc. 2012, 62, 367. [Google Scholar]
- Karim, A.; Qaisar, R. Anthropometric measurements of school-going-girls of the Punjab, Pakistan. BMC Pediatr. 2020, 20, 223. [Google Scholar] [CrossRef] [PubMed]
- Sadiq, S.; Qureshi, M.F.; Farooq, L.; Mohammad, D.; Lakhani, M.; Lodhi, M. Reference percentile for height, weight and BMI among children/adolescents of Karachi Pakistan. Res. J. Food Sci. Nutr. 2019, 4, 90–96. [Google Scholar] [CrossRef]
- Akbar, N.; Aslam, M.; Petersen, J.H.; Altaf, S.; Ahmed, K.M. Disparities with global standards about growth references of mid-upper arm circumference-for-age for Pakistani children aged 6–60 months. Acta Paediatr. 2024, 113, 1592–1599. [Google Scholar] [CrossRef] [PubMed]
- Pakistan National Nutrition Survey 2018: Key Finding Report, UNICEF. 2018. Available online: https://www.unicef.org/pakistan/ (accessed on 22 October 2020).
- GOP Census of Pakistan; Pakistan Census Bureau. Population Census Organization, Statistics Division, Islamabad, Government of Pakistan; 2017. Available online: https://www.pbs.gov.pk/content/brief-census-2017 (accessed on 14 March 2021).
- Chen, Q.; Liu, J.; Tian, K.; Liu, Z. Height/Length and Weight Growth Curves and Growth References of Children Aged 0–7 in Chongqing by GAMLSS. Health 2020, 12, 86–98. [Google Scholar] [CrossRef]
- Stasinopoulos, D.M.; Rigby, R.A. Generalized additive models for location scale and shape (GAMLSS) in R. J. Stat. Softw. 2008, 23, 1–46. [Google Scholar] [CrossRef]
- Rigby, R.A.; Stasinopoulos, D.M. Smooth centile curves for skew and kurtotic data modelled using the Box–Cox power exponential distribution. Stat. Med. 2004, 23, 3053–3076. [Google Scholar] [CrossRef]
- Khadilkar, V. The growing controversy about growth charts: WHO or regional? Inter. J. Pedia Endoc. 2013, 2013, O6. [Google Scholar] [CrossRef]
- Rigby, R.A.; Stasinopoulos, D.M. Generalized additive models for location, scale and shape. J. R. Stat. Soc. Ser. C Appl. Stat. 2005, 54, 507–554. [Google Scholar] [CrossRef]
- Heude, B.; Scherdel, P.; Werner, A.; Le Guern, M.; Gelbert, N.; Walther, D.; Arnould, M.; Bellaïche, M.; Chevallier, B.; Cheymol, J.; et al. A big-data approach to producing descriptive anthropometric references: A feasibility and validation study of paediatric growth charts. Lancet Digit. Health 2019, 1, e413–e523. [Google Scholar] [CrossRef]
- WHO Multicentre Growth Reference Study Group. WHO Child growth standards based on length/height, weight and age. Acta Paediatr. 2006, 450, 76–85. [Google Scholar]
- Tanweer, A.; Zaman, G.P.; Fatima, W.; Javed, H. Report on malnutrition as an epidemic in Pakistan. Sci. Int. 2015, 27, 2589–2592. [Google Scholar]
- Jafar, T.H.; Qadri, Z.; Islam, M.; Hatcher, J.; Bhutta, Z.A.; Chaturvedi, N. Rise in childhood obesity with persistently high rates of undernutrition among urban school-aged Indo-Asian children. Arch. Dis. Child. 2008, 93, 373–378. [Google Scholar] [CrossRef] [PubMed]
- Shahid, M.; Ahmed, F.; Ameer, W.; Guo, J.; Raza, S.; Fatima, S.; Qureshi, M.G. Prevalence of child malnutrition and household socioeconomic deprivation: A case study of marginalized district in Punjab, Pakistan. PLoS ONE 2022, 17, e0263470. [Google Scholar] [CrossRef] [PubMed]

| (a) | ||||||||||||
|---|---|---|---|---|---|---|---|---|---|---|---|---|
| Age (Months) | L | M | S | |||||||||
| 3 | 3.49 | 3.68 | 4.24 | 4.60 | 5.38 | 6.30 | 6.86 | 7.91 | 8.37 | −0.04 | 5.38 | 0.23 |
| 6 | 4.82 | 5.05 | 5.70 | 6.13 | 7.05 | 8.15 | 8.82 | 10.11 | 10.67 | −0.22 | 7.05 | 0.21 |
| 9 | 5.80 | 6.04 | 6.73 | 7.19 | 8.18 | 9.36 | 10.09 | 11.50 | 12.12 | −0.36 | 8.18 | 0.20 |
| 12 | 6.49 | 6.75 | 7.47 | 7.96 | 8.99 | 10.24 | 11.02 | 12.53 | 13.20 | −0.47 | 8.99 | 0.19 |
| 15 | 6.96 | 7.23 | 7.98 | 8.49 | 9.57 | 10.87 | 11.69 | 13.28 | 13.99 | −0.52 | 9.57 | 0.18 |
| 18 | 7.32 | 7.60 | 8.38 | 8.90 | 10.03 | 11.39 | 12.23 | 13.89 | 14.62 | −0.53 | 10.03 | 0.18 |
| 21 | 7.65 | 7.94 | 8.75 | 9.30 | 10.46 | 11.86 | 12.73 | 14.43 | 15.18 | −0.51 | 10.46 | 0.18 |
| 24 | 7.97 | 8.26 | 9.11 | 9.68 | 10.88 | 12.32 | 13.21 | 14.94 | 15.69 | −0.47 | 10.88 | 0.18 |
| 27 | 8.28 | 8.59 | 9.48 | 10.07 | 11.32 | 12.81 | 13.72 | 15.47 | 16.24 | −0.42 | 11.32 | 0.18 |
| 30 | 8.60 | 8.93 | 9.86 | 10.48 | 11.78 | 13.32 | 14.26 | 16.04 | 16.82 | −0.37 | 11.78 | 0.18 |
| 33 | 8.94 | 9.29 | 10.27 | 10.92 | 12.27 | 13.86 | 14.82 | 16.65 | 17.44 | −0.31 | 12.27 | 0.18 |
| 36 | 9.29 | 9.66 | 10.69 | 11.36 | 12.78 | 14.42 | 15.41 | 17.27 | 18.07 | −0.26 | 12.78 | 0.18 |
| 39 | 9.64 | 10.02 | 11.10 | 11.80 | 13.27 | 14.95 | 15.97 | 17.86 | 18.67 | −0.20 | 13.27 | 0.18 |
| 42 | 9.94 | 10.34 | 11.46 | 12.20 | 13.71 | 15.43 | 16.46 | 18.38 | 19.19 | −0.14 | 13.71 | 0.17 |
| 45 | 10.21 | 10.63 | 11.79 | 12.54 | 14.10 | 15.86 | 16.90 | 18.82 | 19.63 | −0.08 | 14.10 | 0.17 |
| 48 | 10.46 | 10.89 | 12.10 | 12.88 | 14.47 | 16.26 | 17.32 | 19.25 | 20.05 | −0.01 | 14.47 | 0.17 |
| 51 | 10.70 | 11.15 | 12.40 | 13.20 | 14.83 | 16.66 | 17.72 | 19.65 | 20.46 | 0.05 | 14.83 | 0.17 |
| 54 | 10.93 | 11.39 | 12.69 | 13.51 | 15.18 | 17.03 | 18.11 | 20.04 | 20.84 | 0.12 | 15.18 | 0.17 |
| 57 | 11.15 | 11.63 | 12.97 | 13.82 | 15.53 | 17.41 | 18.49 | 20.42 | 21.22 | 0.19 | 15.53 | 0.17 |
| 60 | 11.36 | 11.86 | 13.25 | 14.12 | 15.87 | 17.77 | 18.86 | 20.80 | 21.60 | 0.26 | 15.87 | 0.17 |
| (b) | ||||||||||||
| Age (Months) | L | M | S | |||||||||
| 3 | 3.26 | 3.44 | 3.96 | 4.31 | 5.07 | 5.98 | 6.54 | 7.63 | 8.11 | −0.14 | 5.07 | 0.24 |
| 6 | 4.33 | 4.54 | 5.17 | 5.59 | 6.48 | 7.55 | 8.20 | 9.47 | 10.01 | −0.17 | 6.48 | 0.22 |
| 9 | 5.15 | 5.39 | 6.08 | 6.55 | 7.53 | 8.69 | 9.41 | 10.77 | 11.37 | −0.20 | 7.53 | 0.21 |
| 12 | 5.76 | 6.03 | 6.77 | 7.27 | 8.33 | 9.58 | 10.34 | 11.80 | 12.43 | −0.22 | 8.33 | 0.20 |
| 15 | 6.24 | 6.52 | 7.32 | 7.85 | 8.98 | 10.31 | 11.13 | 12.69 | 13.36 | −0.23 | 8.98 | 0.20 |
| 18 | 6.61 | 6.91 | 7.76 | 8.33 | 9.52 | 10.94 | 11.81 | 13.46 | 14.18 | −0.23 | 9.52 | 0.20 |
| 21 | 6.93 | 7.24 | 8.14 | 8.73 | 9.99 | 11.47 | 12.38 | 14.11 | 14.86 | −0.22 | 9.99 | 0.20 |
| 24 | 7.22 | 7.55 | 8.48 | 9.10 | 10.40 | 11.93 | 12.86 | 14.63 | 15.39 | −0.20 | 10.40 | 0.20 |
| 27 | 7.52 | 7.86 | 8.82 | 9.46 | 10.80 | 12.36 | 13.31 | 15.10 | 15.87 | −0.17 | 10.80 | 0.20 |
| 30 | 7.83 | 8.18 | 9.18 | 9.83 | 11.21 | 12.80 | 13.77 | 15.58 | 16.35 | −0.14 | 11.21 | 0.20 |
| 33 | 8.15 | 8.52 | 9.55 | 10.23 | 11.65 | 13.28 | 14.26 | 16.09 | 16.87 | −0.11 | 11.65 | 0.19 |
| 36 | 8.50 | 8.89 | 9.96 | 10.66 | 12.12 | 13.79 | 14.79 | 16.64 | 17.43 | −0.07 | 12.12 | 0.19 |
| 39 | 8.86 | 9.26 | 10.38 | 11.11 | 12.61 | 14.32 | 15.34 | 17.23 | 18.02 | −0.03 | 12.61 | 0.19 |
| 42 | 9.20 | 9.62 | 10.78 | 11.53 | 13.08 | 14.84 | 15.88 | 17.79 | 18.59 | 0.01 | 13.08 | 0.19 |
| 45 | 9.51 | 9.94 | 11.15 | 11.93 | 13.52 | 15.31 | 16.37 | 18.30 | 19.11 | 0.05 | 13.52 | 0.19 |
| 48 | 9.80 | 10.25 | 11.49 | 12.29 | 13.92 | 15.75 | 16.81 | 18.76 | 19.56 | 0.09 | 13.92 | 0.18 |
| 51 | 10.08 | 10.54 | 11.81 | 12.63 | 14.30 | 16.14 | 17.22 | 19.16 | 19.97 | 0.13 | 14.30 | 0.18 |
| 54 | 10.34 | 10.81 | 12.12 | 12.96 | 14.65 | 16.52 | 17.60 | 19.55 | 20.35 | 0.18 | 14.65 | 0.18 |
| 57 | 10.61 | 11.10 | 12.44 | 13.30 | 15.02 | 16.91 | 18.00 | 19.95 | 20.75 | 0.22 | 15.02 | 0.18 |
| 60 | 10.88 | 11.38 | 12.76 | 13.64 | 15.39 | 17.31 | 18.40 | 20.36 | 21.16 | 0.26 | 15.39 | 0.18 |
| (a) | ||||||||||||
|---|---|---|---|---|---|---|---|---|---|---|---|---|
| Age (Months) | L | M | S | |||||||||
| 3 | 52.16 | 52.98 | 55.15 | 56.50 | 59.15 | 61.96 | 63.55 | 66.35 | 67.48 | −0.37 | 59.15 | 0.07 |
| 6 | 57.53 | 58.38 | 60.66 | 62.08 | 64.89 | 67.91 | 69.63 | 72.69 | 73.93 | −0.64 | 64.89 | 0.07 |
| 9 | 61.70 | 62.58 | 64.94 | 66.43 | 69.39 | 72.60 | 74.44 | 77.74 | 79.09 | −0.88 | 69.39 | 0.07 |
| 12 | 64.83 | 65.74 | 68.20 | 69.76 | 72.88 | 76.31 | 78.29 | 81.87 | 83.35 | −1.09 | 72.88 | 0.07 |
| 15 | 67.24 | 68.19 | 70.77 | 72.42 | 75.73 | 79.40 | 81.54 | 85.45 | 87.09 | −1.25 | 75.73 | 0.07 |
| 18 | 69.21 | 70.20 | 72.92 | 74.66 | 78.18 | 82.12 | 84.43 | 88.70 | 90.50 | −1.37 | 78.18 | 0.07 |
| 21 | 70.89 | 71.92 | 74.78 | 76.62 | 80.35 | 84.56 | 87.05 | 91.67 | 93.63 | −1.44 | 80.35 | 0.07 |
| 24 | 72.44 | 73.53 | 76.53 | 78.46 | 82.40 | 86.86 | 89.51 | 94.45 | 96.55 | −1.45 | 82.40 | 0.08 |
| 27 | 74.00 | 75.14 | 78.28 | 80.31 | 84.45 | 89.15 | 91.94 | 97.15 | 99.37 | −1.41 | 84.45 | 0.08 |
| 30 | 75.53 | 76.73 | 80.03 | 82.16 | 86.50 | 91.41 | 94.33 | 99.76 | 102.07 | −1.33 | 86.50 | 0.08 |
| 33 | 77.04 | 78.29 | 81.75 | 83.97 | 88.49 | 93.59 | 96.61 | 102.20 | 104.57 | −1.22 | 88.49 | 0.08 |
| 36 | 78.56 | 79.87 | 83.47 | 85.78 | 90.46 | 95.69 | 98.78 | 104.45 | 106.83 | −1.08 | 90.46 | 0.08 |
| 39 | 80.11 | 81.48 | 85.21 | 87.60 | 92.39 | 97.72 | 100.83 | 106.50 | 108.87 | −0.92 | 92.39 | 0.08 |
| 42 | 81.56 | 82.98 | 86.83 | 89.28 | 94.16 | 99.52 | 102.63 | 108.24 | 110.56 | −0.74 | 94.16 | 0.08 |
| 45 | 82.84 | 84.30 | 88.26 | 90.75 | 95.69 | 101.06 | 104.13 | 109.63 | 111.88 | −0.54 | 95.69 | 0.08 |
| 48 | 84.06 | 85.57 | 89.63 | 92.16 | 97.15 | 102.49 | 105.53 | 110.90 | 113.07 | −0.33 | 97.15 | 0.08 |
| 51 | 85.30 | 86.86 | 91.01 | 93.59 | 98.62 | 103.94 | 106.94 | 112.18 | 114.29 | −0.11 | 98.62 | 0.08 |
| 54 | 86.49 | 88.10 | 92.37 | 95.00 | 100.08 | 105.40 | 108.36 | 113.51 | 115.56 | 0.10 | 100.08 | 0.08 |
| 57 | 87.66 | 89.33 | 93.73 | 96.42 | 101.57 | 106.91 | 109.86 | 114.94 | 116.95 | 0.30 | 101.57 | 0.08 |
| 60 | 88.84 | 90.57 | 95.12 | 97.88 | 103.12 | 108.50 | 111.44 | 116.47 | 118.45 | 0.51 | 103.12 | 0.08 |
| (b) | ||||||||||||
| Age (Months) | L | M | S | |||||||||
| 3 | 51.01 | 51.79 | 53.92 | 55.28 | 58.03 | 61.10 | 62.90 | 66.20 | 67.59 | −1.20 | 58.03 | 0.07 |
| 6 | 56.73 | 57.53 | 59.72 | 61.13 | 64.00 | 67.24 | 69.17 | 72.75 | 74.27 | −1.58 | 64.00 | 0.07 |
| 9 | 60.34 | 61.16 | 63.45 | 64.92 | 67.96 | 71.43 | 73.51 | 77.44 | 79.13 | −1.83 | 67.96 | 0.07 |
| 12 | 63.06 | 63.93 | 66.33 | 67.90 | 71.14 | 74.89 | 77.17 | 81.52 | 83.42 | −2.00 | 71.14 | 0.07 |
| 15 | 65.46 | 66.38 | 68.93 | 70.61 | 74.09 | 78.16 | 80.65 | 85.45 | 87.57 | −2.08 | 74.09 | 0.08 |
| 18 | 67.57 | 68.54 | 71.26 | 73.04 | 76.77 | 81.15 | 83.85 | 89.07 | 91.39 | −2.08 | 76.77 | 0.08 |
| 21 | 69.39 | 70.42 | 73.29 | 75.18 | 79.13 | 83.78 | 86.65 | 92.20 | 94.67 | −2.02 | 79.13 | 0.08 |
| 24 | 71.13 | 72.21 | 75.21 | 77.18 | 81.29 | 86.10 | 89.05 | 94.75 | 97.25 | −1.90 | 81.29 | 0.08 |
| 27 | 72.77 | 73.90 | 77.02 | 79.06 | 83.28 | 88.18 | 91.16 | 96.85 | 99.33 | −1.73 | 83.28 | 0.08 |
| 30 | 74.27 | 75.44 | 78.69 | 80.79 | 85.13 | 90.11 | 93.10 | 98.75 | 101.19 | −1.54 | 85.13 | 0.08 |
| 33 | 75.68 | 76.90 | 80.28 | 82.46 | 86.92 | 91.98 | 94.99 | 100.59 | 102.98 | −1.32 | 86.92 | 0.08 |
| 36 | 77.13 | 78.41 | 81.94 | 84.21 | 88.79 | 93.92 | 96.94 | 102.49 | 104.83 | −1.08 | 88.79 | 0.08 |
| 39 | 78.60 | 79.96 | 83.65 | 86.00 | 90.72 | 95.92 | 98.95 | 104.44 | 106.72 | −0.82 | 90.72 | 0.08 |
| 42 | 80.00 | 81.42 | 85.30 | 87.74 | 92.59 | 97.87 | 100.90 | 106.33 | 108.56 | −0.55 | 92.59 | 0.08 |
| 45 | 81.29 | 82.80 | 86.85 | 89.38 | 94.35 | 99.68 | 102.71 | 108.05 | 110.22 | −0.28 | 94.35 | 0.08 |
| 48 | 82.52 | 84.10 | 88.33 | 90.94 | 96.02 | 101.38 | 104.37 | 109.61 | 111.72 | 0.00 | 96.02 | 0.08 |
| 51 | 83.69 | 85.35 | 89.74 | 92.43 | 97.59 | 102.94 | 105.91 | 111.02 | 113.05 | 0.29 | 97.59 | 0.08 |
| 54 | 84.84 | 86.58 | 91.12 | 93.87 | 99.09 | 104.43 | 107.35 | 112.33 | 114.29 | 0.56 | 99.09 | 0.08 |
| 57 | 86.00 | 87.81 | 92.49 | 95.30 | 100.57 | 105.89 | 108.76 | 113.62 | 115.51 | 0.83 | 100.57 | 0.08 |
| 60 | 87.15 | 89.03 | 93.87 | 96.73 | 102.05 | 107.34 | 110.17 | 114.92 | 116.75 | 1.09 | 102.05 | 0.08 |
| (a) | ||||||||||||
|---|---|---|---|---|---|---|---|---|---|---|---|---|
| Age (Months) | L | M | S | |||||||||
| 3 | 10.29 | 10.82 | 12.32 | 13.29 | 15.31 | 17.59 | 18.94 | 21.43 | 22.47 | 0.09 | 15.31 | 0.21 |
| 6 | 11.15 | 11.68 | 13.18 | 14.15 | 16.15 | 18.42 | 19.76 | 22.23 | 23.26 | 0.04 | 16.15 | 0.20 |
| 9 | 11.76 | 12.28 | 13.76 | 14.72 | 16.69 | 18.92 | 20.24 | 22.67 | 23.69 | 0.00 | 16.69 | 0.19 |
| 12 | 12.02 | 12.54 | 13.98 | 14.91 | 16.84 | 19.02 | 20.31 | 22.69 | 23.69 | −0.04 | 16.84 | 0.18 |
| 15 | 12.01 | 12.51 | 13.91 | 14.83 | 16.70 | 18.83 | 20.09 | 22.42 | 23.40 | −0.07 | 16.70 | 0.18 |
| 18 | 11.89 | 12.38 | 13.74 | 14.63 | 16.45 | 18.52 | 19.75 | 22.03 | 22.99 | −0.10 | 16.45 | 0.18 |
| 21 | 11.78 | 12.25 | 13.57 | 14.43 | 16.20 | 18.23 | 19.43 | 21.65 | 22.59 | −0.12 | 16.20 | 0.17 |
| 24 | 11.68 | 12.14 | 13.42 | 14.26 | 15.98 | 17.95 | 19.12 | 21.29 | 22.20 | −0.15 | 15.98 | 0.17 |
| 27 | 11.60 | 12.05 | 13.29 | 14.10 | 15.78 | 17.69 | 18.83 | 20.95 | 21.84 | −0.17 | 15.78 | 0.17 |
| 30 | 11.54 | 11.98 | 13.19 | 13.98 | 15.62 | 17.49 | 18.60 | 20.67 | 21.55 | −0.20 | 15.62 | 0.17 |
| 33 | 11.53 | 11.96 | 13.15 | 13.93 | 15.54 | 17.38 | 18.49 | 20.54 | 21.41 | −0.23 | 15.54 | 0.16 |
| 36 | 11.53 | 11.95 | 13.14 | 13.91 | 15.51 | 17.34 | 18.44 | 20.49 | 21.36 | −0.26 | 15.51 | 0.16 |
| 39 | 11.50 | 11.91 | 13.08 | 13.85 | 15.44 | 17.27 | 18.36 | 20.42 | 21.30 | −0.28 | 15.44 | 0.16 |
| 42 | 11.43 | 11.84 | 13.00 | 13.75 | 15.33 | 17.15 | 18.25 | 20.30 | 21.18 | −0.31 | 15.33 | 0.16 |
| 45 | 11.37 | 11.78 | 12.92 | 13.68 | 15.24 | 17.06 | 18.15 | 20.21 | 21.09 | −0.33 | 15.24 | 0.16 |
| 48 | 11.35 | 11.76 | 12.89 | 13.64 | 15.19 | 17.00 | 18.09 | 20.14 | 21.02 | −0.35 | 15.19 | 0.16 |
| 51 | 11.35 | 11.75 | 12.87 | 13.60 | 15.14 | 16.92 | 17.99 | 20.01 | 20.88 | −0.36 | 15.14 | 0.16 |
| 54 | 11.34 | 11.73 | 12.83 | 13.56 | 15.06 | 16.80 | 17.85 | 19.83 | 20.68 | −0.36 | 15.06 | 0.16 |
| 57 | 11.32 | 11.70 | 12.79 | 13.50 | 14.97 | 16.67 | 17.70 | 19.62 | 20.45 | −0.36 | 14.97 | 0.16 |
| 60 | 11.28 | 11.66 | 12.72 | 13.42 | 14.87 | 16.53 | 17.53 | 19.40 | 20.20 | −0.36 | 14.87 | 0.15 |
| (b) | ||||||||||||
| Age (Months) | L | M | S | |||||||||
| 3 | 9.97 | 10.49 | 11.98 | 12.95 | 14.97 | 17.28 | 18.65 | 21.20 | 22.27 | 0.06 | 14.97 | 0.21 |
| 6 | 10.84 | 11.38 | 12.90 | 13.88 | 15.90 | 18.18 | 19.53 | 22.00 | 23.03 | 0.09 | 15.90 | 0.20 |
| 9 | 11.23 | 11.77 | 13.28 | 14.26 | 16.25 | 18.50 | 19.81 | 22.21 | 23.21 | 0.10 | 16.25 | 0.19 |
| 12 | 11.35 | 11.89 | 13.37 | 14.33 | 16.30 | 18.49 | 19.78 | 22.13 | 23.10 | 0.10 | 16.30 | 0.19 |
| 15 | 11.32 | 11.85 | 13.31 | 14.25 | 16.17 | 18.33 | 19.59 | 21.89 | 22.85 | 0.09 | 16.17 | 0.19 |
| 18 | 11.24 | 11.76 | 13.18 | 14.10 | 15.98 | 18.09 | 19.32 | 21.58 | 22.52 | 0.07 | 15.98 | 0.18 |
| 21 | 11.15 | 11.65 | 13.03 | 13.93 | 15.76 | 17.81 | 19.02 | 21.23 | 22.15 | 0.05 | 15.76 | 0.18 |
| 24 | 11.09 | 11.57 | 12.91 | 13.78 | 15.56 | 17.56 | 18.73 | 20.89 | 21.78 | 0.02 | 15.56 | 0.18 |
| 27 | 11.06 | 11.53 | 12.84 | 13.69 | 15.42 | 17.38 | 18.53 | 20.64 | 21.52 | −0.01 | 15.42 | 0.18 |
| 30 | 11.06 | 11.52 | 12.80 | 13.63 | 15.33 | 17.26 | 18.39 | 20.48 | 21.35 | −0.03 | 15.33 | 0.17 |
| 33 | 11.07 | 11.52 | 12.78 | 13.60 | 15.28 | 17.19 | 18.32 | 20.39 | 21.26 | −0.06 | 15.28 | 0.17 |
| 36 | 11.08 | 11.53 | 12.78 | 13.59 | 15.25 | 17.15 | 18.27 | 20.33 | 21.20 | −0.09 | 15.25 | 0.17 |
| 39 | 11.10 | 11.54 | 12.77 | 13.57 | 15.23 | 17.11 | 18.22 | 20.28 | 21.15 | −0.12 | 15.23 | 0.17 |
| 42 | 11.09 | 11.52 | 12.74 | 13.54 | 15.18 | 17.05 | 18.16 | 20.22 | 21.09 | −0.14 | 15.18 | 0.17 |
| 45 | 11.06 | 11.49 | 12.70 | 13.49 | 15.12 | 16.98 | 18.08 | 20.14 | 21.00 | −0.16 | 15.12 | 0.17 |
| 48 | 11.03 | 11.46 | 12.65 | 13.43 | 15.05 | 16.89 | 17.99 | 20.03 | 20.90 | −0.18 | 15.05 | 0.17 |
| 51 | 11.00 | 11.42 | 12.60 | 13.37 | 14.97 | 16.79 | 17.88 | 19.91 | 20.77 | −0.20 | 14.97 | 0.17 |
| 54 | 10.97 | 11.39 | 12.55 | 13.31 | 14.89 | 16.69 | 17.77 | 19.78 | 20.64 | −0.21 | 14.89 | 0.17 |
| 57 | 10.95 | 11.36 | 12.51 | 13.26 | 14.82 | 16.61 | 17.67 | 19.67 | 20.51 | −0.23 | 14.82 | 0.17 |
| 60 | 10.93 | 11.34 | 12.47 | 13.22 | 14.76 | 16.53 | 17.58 | 19.56 | 20.40 | −0.24 | 14.76 | 0.17 |
| Age (Months) | Punjab Pakistan Present Study | WHO 2006 [22] | Pakistani 2022 [7] | India 2019 [5] | Egyptian 2021 [6] | |||||
|---|---|---|---|---|---|---|---|---|---|---|
| Boys | Girls | Boys | Girls | Boys | Girls | Boys | Girls | Boys | Girls | |
| Weight (kg) | ||||||||||
| 3 | 5.38 | 5.07 | 6.40 | 5.80 | 5.36 | 5.09 | ----- | ----- | ------ | ----- |
| 6 | 7.05 | 6.48 | 7.90 | 7.30 | 6.9 | 6.5 | 6.9 | 6.8 | ------ | ----- |
| 12 | 8.99 | 8.33 | 9.6 | 8.9 | 8.8 | 8.2 | 8.9 | 8.9 | 7.6 | 7.0 |
| 24 | 10.88 | 10.40 | 12.2 | 11.5 | 10.8 | 10.2 | 10.7 | 10.7 | 11.5 | 10.7 |
| 36 | 12.78 | 12.12 | 14.3 | 13.9 | 12.5 | 11.9 | 12.7 | 12.4 | 13.8 | 13.4 |
| 48 | 14.47 | 13.92 | 16.3 | 16.1 | 14.1 | 13.6 | 14.8 | 14.4 | 15.7 | 15.9 |
| 60 | 15.87 | 15.39 | 18.3 | 18.2 | 15.5 | 15.0 | 17.0 | 16.5 | 17.7 | 17.9 |
| Length/height (cm) | ||||||||||
| 3 | 59.15 | 58.03 | 61.4 | 59.8 | 58.88 | 57.99 | ----- | ----- | ----- | ------ |
| 6 | 64.89 | 64.00 | 67.6 | 65.7 | 65.3 | 63.7 | 63.2 | 62.4 | ------ | ------ |
| 12 | 72.88 | 71.14 | 75.7 | 74.0 | 72.4 | 70.9 | 73.2 | 72.1 | 65.2 | 63.8 |
| 24 | 82.40 | 81.29 | 87.1 | 86.4 | 81.9 | 80.6 | 85.3 | 84.6 | 81.9 | 80.2 |
| 36 | 90.46 | 88.79 | 96.1 | 95.1 | 89.9 | 88.1 | 92.9 | 92.6 | 91.5 | 90.2 |
| 48 | 97.15 | 96.02 | 103.3 | 102.7 | 96.4 | 95.3 | 100.6 | 99.7 | 99.5 | 98.6 |
| 60 | 103.12 | 102.05 | 110.0 | 109.4 | 102.1 | 100.7 | 108.0 | 106.8 | 106.3 | 105.7 |
| BMI (kg/m2) | ||||||||||
| 3 | 15.31 | 14.97 | 16.9 | 16.4 | 15.55 | 15.23 | ----- | ------ | ------ | ------ |
| 6 | 16.15 | 15.90 | 17.3 | 16.9 | 16.4 | 16.0 | 14.3 | 14.3 | ------ | ------ |
| 12 | 16.84 | 16.30 | 16.8 | 16.4 | 16.8 | 16.2 | 14.9 | 14.8 | 17.50 | 17.3 |
| 24 | 15.98 | 15.56 | 15.7 | 15.4 | 16.0 | 15.6 | 15.2 | 14.9 | 17.31 | 16.9 |
| 36 | 15.51 | 15.25 | 15.8 | 15.4 | 15.4 | 15.3 | 15.0 | 14.7 | 16.58 | 16.3 |
| 48 | 15.19 | 15.05 | 15.3 | 15.3 | 15.1 | 14.9 | 14.8 | 14.5 | 16.01 | 15.8 |
| 60 | 14.87 | 14.76 | 15.2 | 15.3 | 14.9 | 14.7 | 14.7 | 14.5 | 15.74 | 15.6 |
Disclaimer/Publisher’s Note: The statements, opinions and data contained in all publications are solely those of the individual author(s) and contributor(s) and not of MDPI and/or the editor(s). MDPI and/or the editor(s) disclaim responsibility for any injury to people or property resulting from any ideas, methods, instructions or products referred to in the content. |
© 2025 by the authors. Licensee MDPI, Basel, Switzerland. This article is an open access article distributed under the terms and conditions of the Creative Commons Attribution (CC BY) license (https://creativecommons.org/licenses/by/4.0/).
Share and Cite
Akbar, N.; Aslam, M.; Sabih Haider, S.M.D.; Asif, M.; Matłosz, P.; Wyszyńska, J. Smoothed Growth Trajectories for Weight, Length/Height, and BMI Percentiles of Children Aged 3 to 60 Months in Punjab, Pakistan. J. Clin. Med. 2025, 14, 1949. https://doi.org/10.3390/jcm14061949
Akbar N, Aslam M, Sabih Haider SMD, Asif M, Matłosz P, Wyszyńska J. Smoothed Growth Trajectories for Weight, Length/Height, and BMI Percentiles of Children Aged 3 to 60 Months in Punjab, Pakistan. Journal of Clinical Medicine. 2025; 14(6):1949. https://doi.org/10.3390/jcm14061949
Chicago/Turabian StyleAkbar, Natasha, Muhammad Aslam, Syed Muhammad Dure Sabih Haider, Muhammad Asif, Piotr Matłosz, and Justyna Wyszyńska. 2025. "Smoothed Growth Trajectories for Weight, Length/Height, and BMI Percentiles of Children Aged 3 to 60 Months in Punjab, Pakistan" Journal of Clinical Medicine 14, no. 6: 1949. https://doi.org/10.3390/jcm14061949
APA StyleAkbar, N., Aslam, M., Sabih Haider, S. M. D., Asif, M., Matłosz, P., & Wyszyńska, J. (2025). Smoothed Growth Trajectories for Weight, Length/Height, and BMI Percentiles of Children Aged 3 to 60 Months in Punjab, Pakistan. Journal of Clinical Medicine, 14(6), 1949. https://doi.org/10.3390/jcm14061949