
The Dammiss EEG Score: A New System to Quantify EEG Abnormalities and Predict the Outcome in Asphyxiated Newborns


 , , and
Abstract
1. Introduction
- At which time point (6 h, 12 h, 24 h, 48 h, 72 h, 78 h and 2 weeks) do the EEG parameters best correlate with HIE outcomes?
- Among the seven EEG features, which demonstrates the highest accuracy in predicting the neurodevelopmental outcomes of HIE infants 24 months after birth?
- What additional insights can continuous EEG monitoring provide?
2. Methods
2.1. EEG Criteria
2.2. Statistical Analysis
2.3. Study Group
3. Results
4. Discussion
Strengths and Limitations of the Study
5. Conclusions
Author Contributions
Funding
Institutional Review Board Statement
Informed Consent Statement
Data Availability Statement
Acknowledgments
Conflicts of Interest
Abbreviations
Appendix A. Dammiss Score
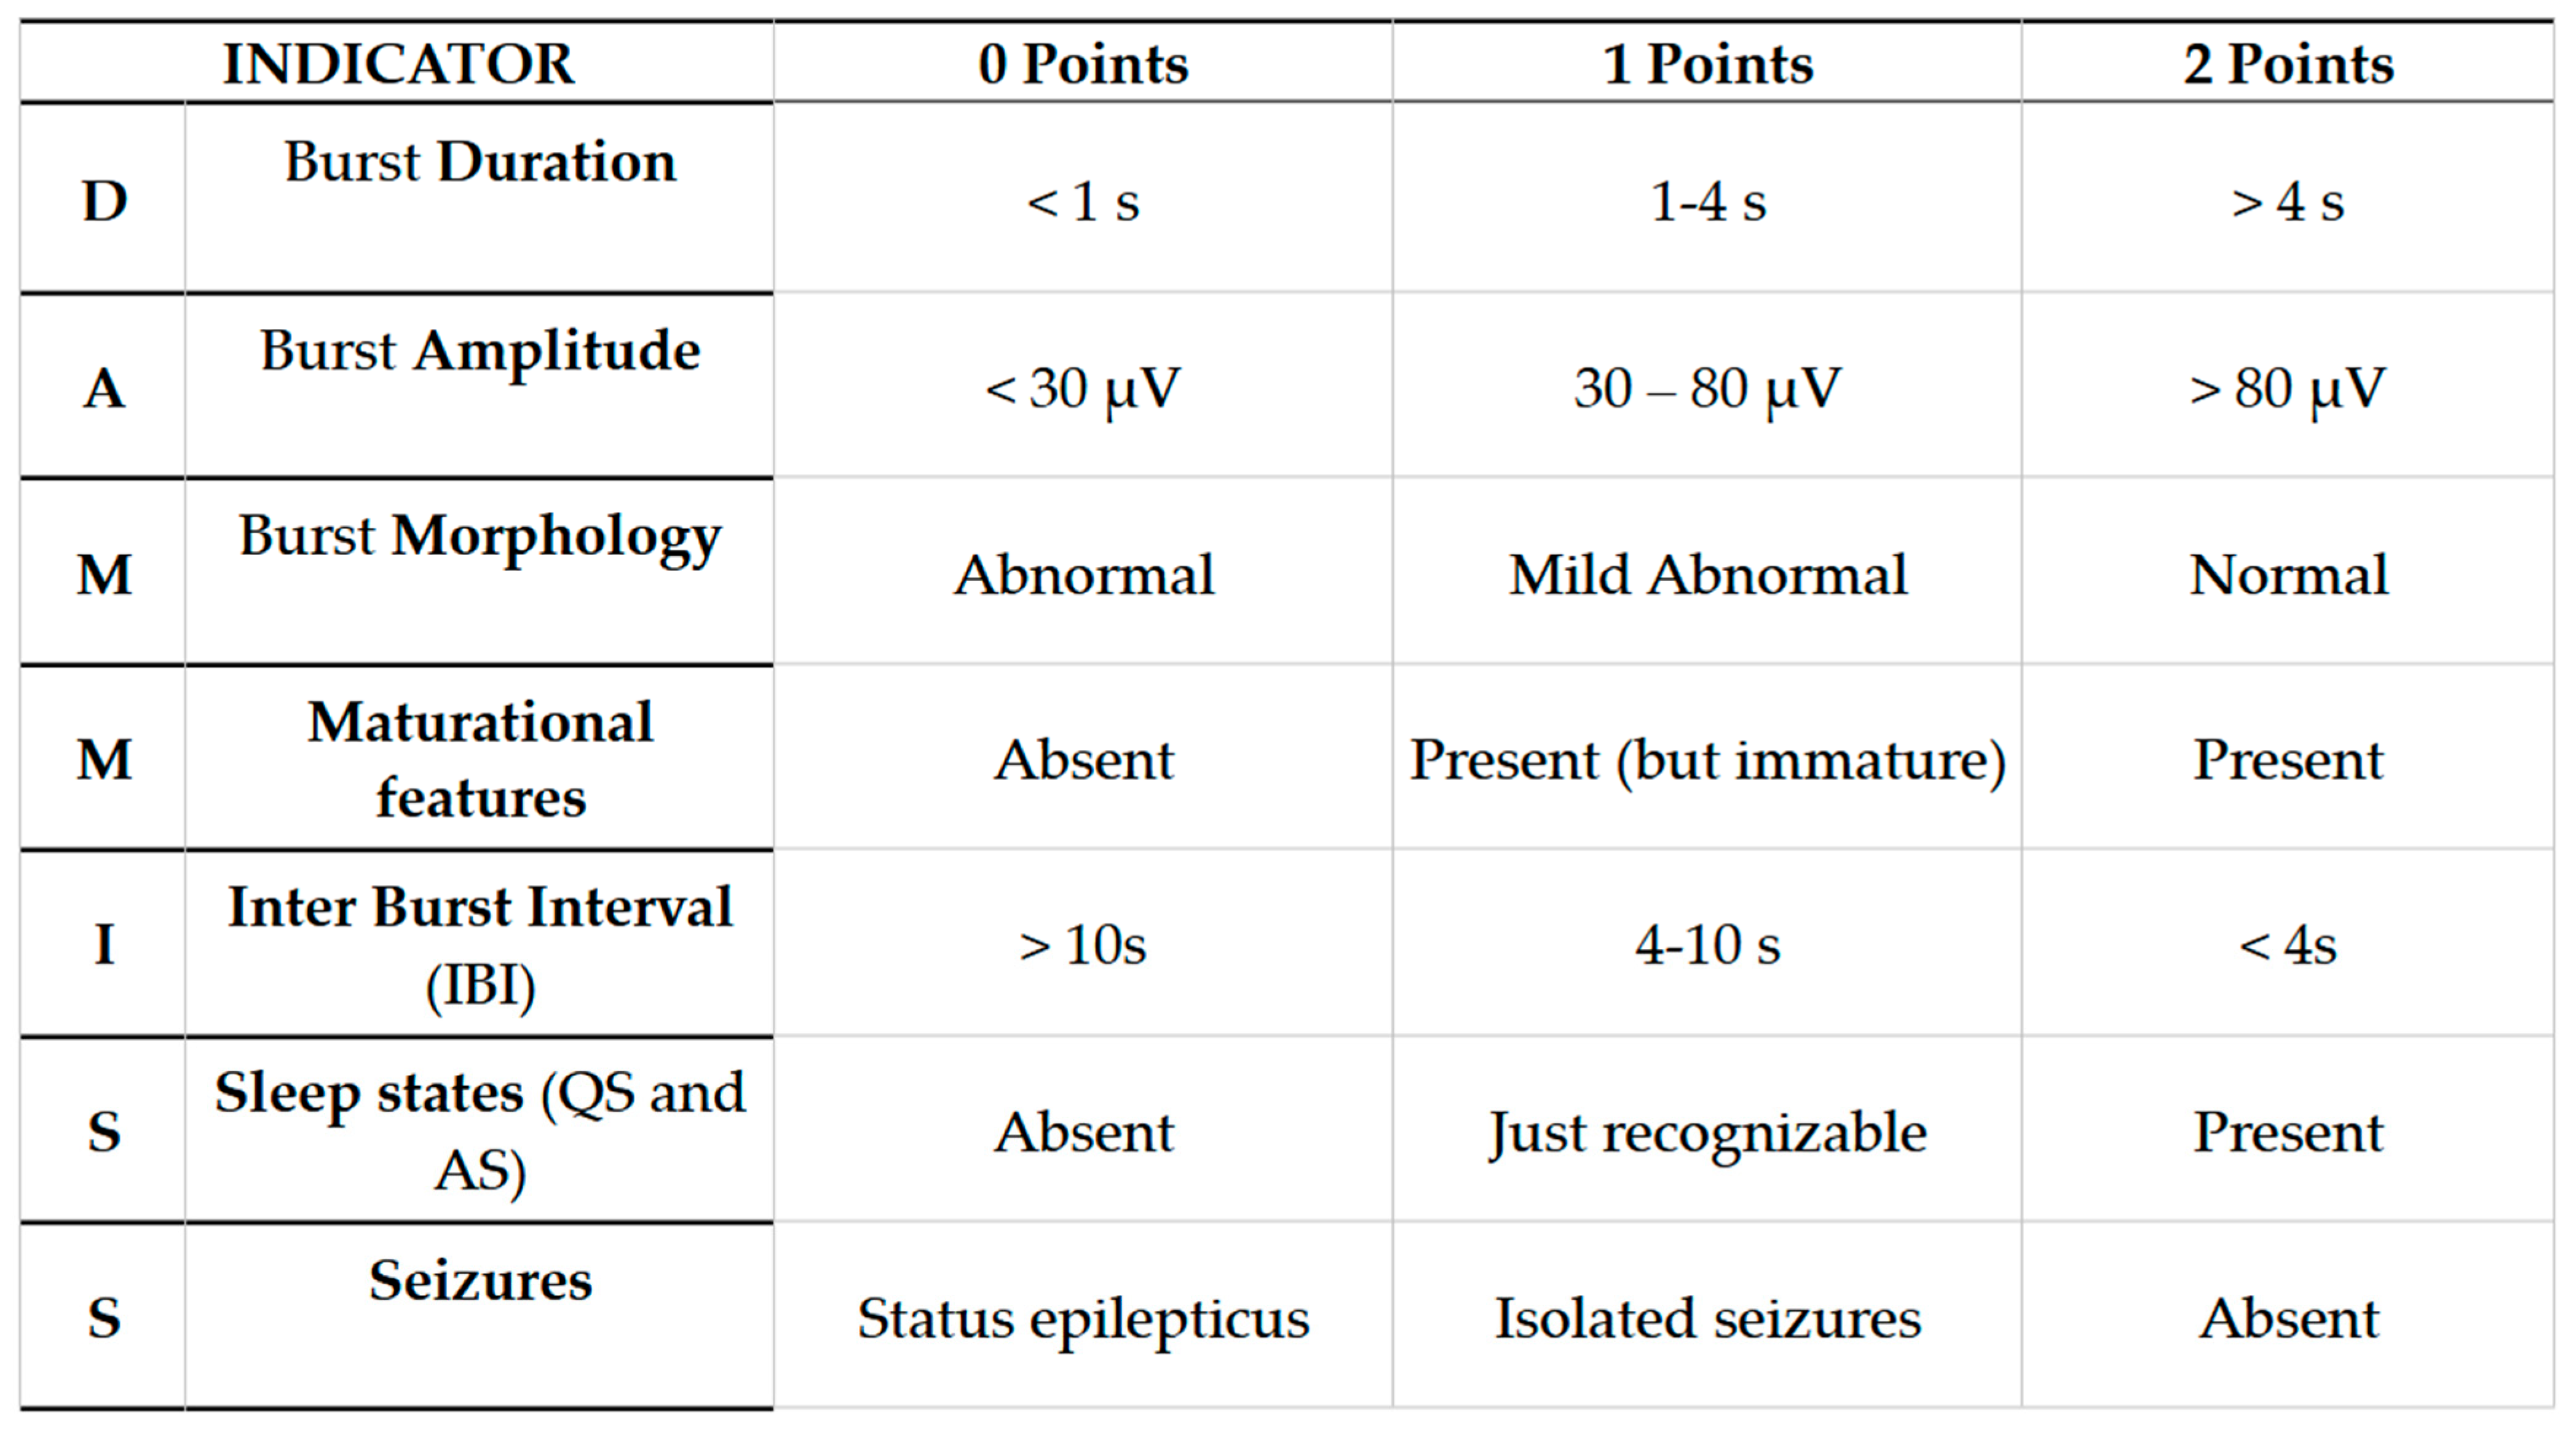
- Burst Duration (BD): Expressed in seconds. We calculate the average considering three consecutive larger bouffées. The duration of the bouffées can be easily measured by evaluating the time on the abscissa of the recording (considered the bigger bouffées in the interval).
- Burst Amplitude (BA): Expressed in μV. The average is calculated on three consecutive larger bouffées. Through the EEG program used in our NICU, we measured the amplitude analyzing the peak–peak parameter (μV) on derivation C3–C4.
- Burst Morphology (BM): Essentially assessed by visual qualitative evaluation. Physiological bouffées are considered as those having three different physiological elements: sharp waves, slow delta waves (0.5–4 Hz), and slow theta waves (4–8 Hz). For undifferentiated bouffées or the absence of physiological features, a score of 0 was assigned.
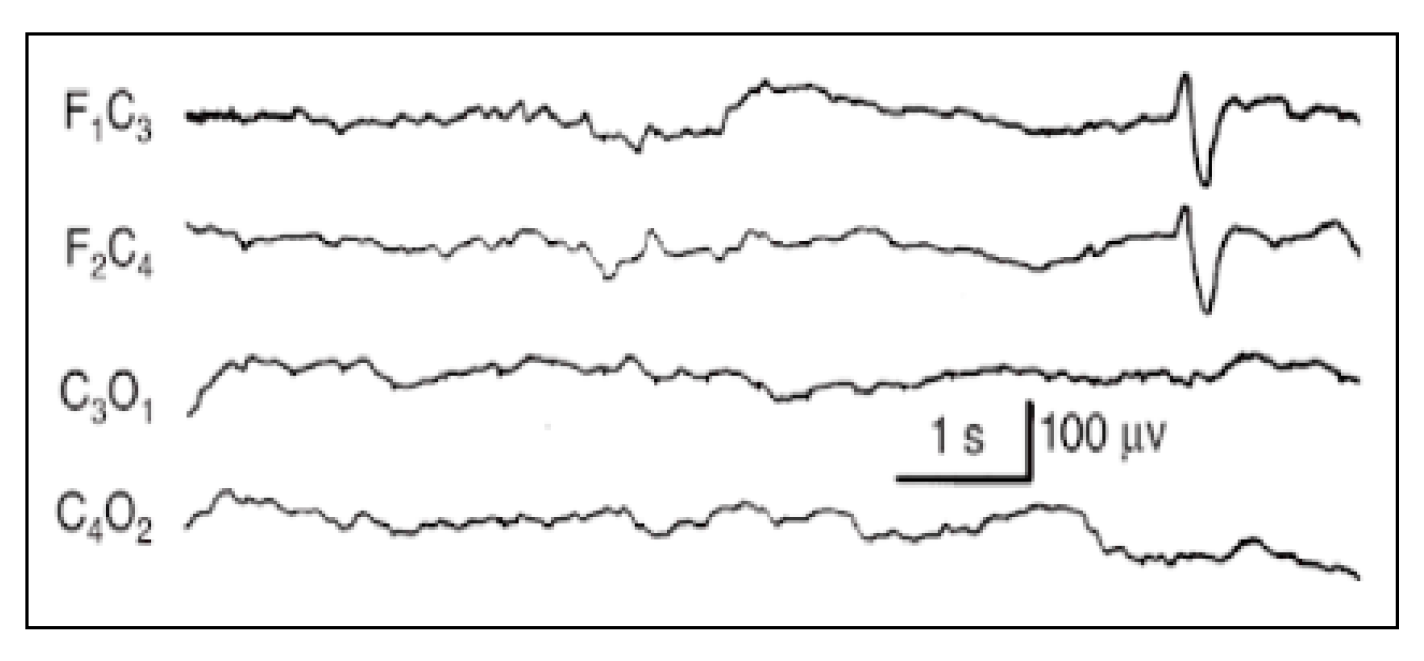
- Maturational features (M): Given by visual qualitative assessment. We evaluated frontal encoches (or FSTs, frontal sharp transients) and ASD (anterior slow dysrhythmia). Frontal encoches or FSTs (Figure A2) are high-amplitude (250 μV) polyphasic waves in frontal regions with the tendency to spread to the posterior areas. They are generally symmetrical and synchronous in the two hemispheres. FSTs are physiological from 34 to 35 weeks. Anterior slow dysrhythmia (ASD): Delta waves (1–3 Hz) of 50–100 μV in short sequences lasting a few seconds, predominant in the frontal regions. (Figure A3). FSTs and ASD are typical of the first hours of life, but from the 10th day of life, the typical physiological patterns are TA, HVS, M, LVI, and Moyenne activity.

- IBI duration (I): Expressed in seconds. Since burst interval characterizes the discontinuous background, its duration (seconds) and aspects (physiological IBIs are not isoelectric or flat) can easily be evaluated. If different types of bouffées are present, consider the largest ones. At least three IBIs have to be present to consider the background as discontinuous. To assess duration, calculate the average. If IBIs are difficult to recognize, give a score of 1 point.
- Sleep States (SS): Evaluated by visual assessment. If EEG patterns agree with gestational age, behavioral states, and the sleep–wake cycle, they are signs of brain integrity, while the lack of this agreement can be considered a sign of brain dysfunction. The organization of sleep states is therefore another important window into the development and integrity of the CNS. In the newborn, the sleep cycle can be divided into five phases:
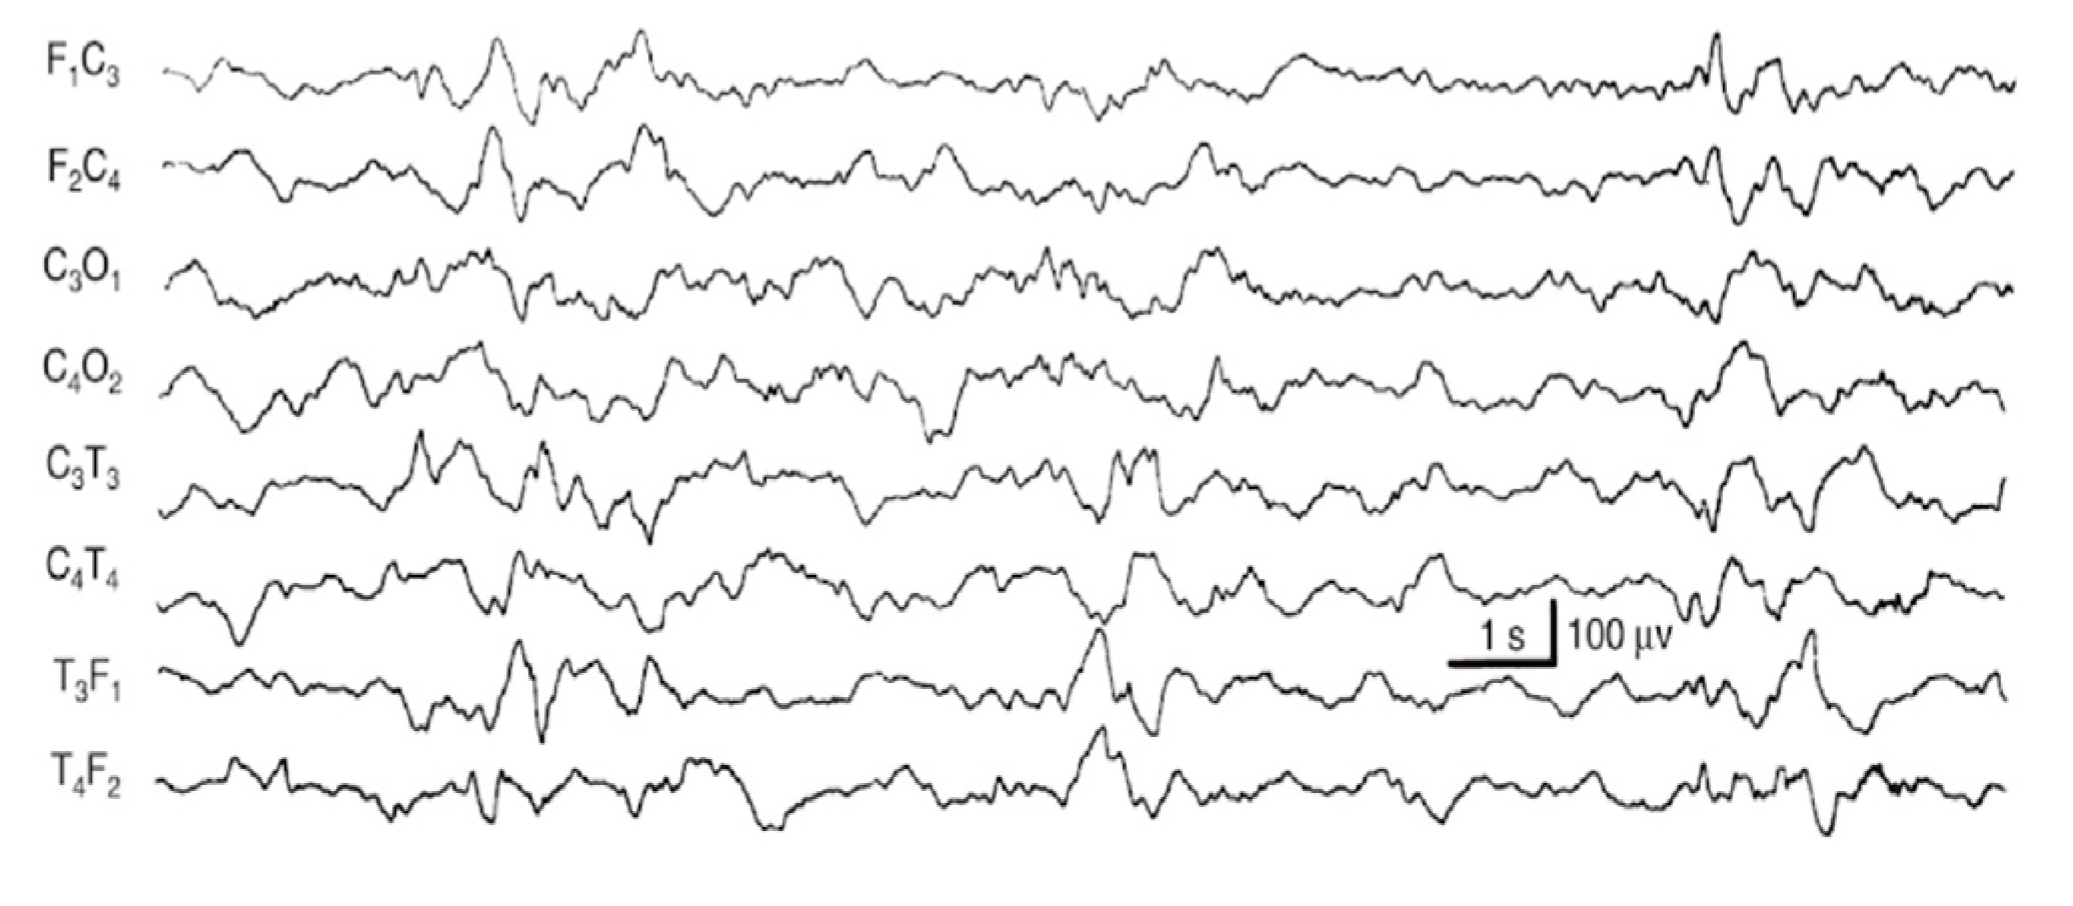
- Quiet sleep (QS) is mature at 36–37 weeks PMA. It can occur through two patterns: HVS (high-voltage slow), a medium-voltage pattern rich in delta activity, and TA (alternating pattern, “tracé alternant”) (Figure A4), which is a discontinuous pattern of 1–3 Hz and 50–100 μV, alternating with lower amplitude beta waves and theta activity bursts of 3–10 Hz lasting 3–5 s.
- Active sleep (AS) coincides with REM sleep. It consists of 2 patterns: M (mixed) and LVI (low-voltage irregular). M is a continuous activity which appears at the beginning of AS, characterized by theta and delta waves with some alpha waves, and voltage of 40–100 μV. When AS follows QS, it presents as LVI (20–50 μV), associated with beta/theta and alpha waves diffusely distributed.
- Quiet wakefulness
- Active wakefulness with general movements
- Crying
In the second week of extra-uterine life, the QS is characterized mostly by HVS (high-voltage slow), which predominates over TA (tracé alternant). To analyze each sleep state, besides EEG patterns, we considered information resulting from breaths and eye movements measurement too. The AS is characterized by rapid eye movements (REM), body movements, continuous alterations of respiratory and cardiac rate and of systemic blood pressure; meanwhile, during QS, the newborn appears motionless and with regular breathing. A score of 1 was assigned if the TA was recognizable; a score of 2 if in an interval of 1 h it was possible to recognize a complete sleep cycle (two different states). If the indeterminate sleep pattern was present, a score of 0 was given (because it does not exist in the healthy newborn) [33,34].
- Seizures (S): If seizures were reported in clinical history, they were always annotated with the time of beginning and the duration of electrographic seizures and/or status epilepticus. We distinguished three conditions: status epilepticus (score: 0), electroencephalographic seizures (score: 1), and lack of seizures (score: 2). Status epilepticus is a clinical situation where an epileptic seizure (generalized or focal, motor or not) is prolonged for more than 20 min or the crises are repeated at very short intervals (less than a minute) such as to configure a continuous epileptic state (score: 0). An electrographic seizure (score: 1) was defined as a sudden, repetitive, stereotyped electrographic discharge of theta or delta rhythmic waves, alpha activity, or “sharp waves”, with a defined beginning, an intermediate evolution, and a precise end, lasting at least 10 s on almost one EEG channel. Suspected clinical seizures without an EEG discharge were not considered seizures. Video recording EEG was used to assess the possible correlation of clinical signs, if not reported in the clinical data available. For the absence of seizures, a score 2 was assigned [35].
- TIMING
- In our study, we analyzed EEGs at seven time intervals. A period of approximately 45 min was evaluated for each time interval. The first recording coincided with the first available EEG of the newborn, which was collected within the first 6 h of life (A). The second EEG assessment corresponded to 6 h after the first one (B = A + 6 h). The third EEG was performed 12 h after the second (C = B + 12 h), and the fourth and fifth were performed 24 h after the previous one (D = C + 24 h and E = D + 24 h). The sixth coincided with 6 h after the fifth (F = E + 6 h), and the last one was recorded on between the 9th and the 15th day of extrauterine life (G = 9–10 days after birth). If the last EEG available was recorded earlier, at 7–9 days old, it was considered only if it scored more than 9 points. Recordings earlier than the 7th day of life were not evaluated.
- ANNOTATIONS AND SPECIAL CASES
- -
- If TA and bursts were not recognizable at that time interval, but a coherent background activity was present, a score of 1 point was assigned for each parameter characterizing the burst: BD, BA, and BM (total 3 points).
- -
- If continuous artifacts were present, the assessment was not possible (score = X/NA, not assessable)
- -
- Burst suppression (also called paroxysmal), which presents long periods of inactivity interrupted by bursts of abnormal activity of spikes, slow waves, or theta or beta rhythms shorter than <10 s, since it is very suggestive of HIE, was scored 1 point (1 point for all the six parameters).
- -
- Inactive EEG was scored 0.
References
- Azzopardi, D.V.; Strohm, B.; Edwards, A.D.; Dyet, L.; Halliday, H.L.; Juszczak, E.; Kapellou, O.; Levene, M.; Marlow, N.; Porter, E.; et al. Moderate hypothermia to treat perinatal asphyxial encephalopathy. N. Engl. J. Med. 2009, 361, 1349–1358, Erratum in N. Engl. J. Med. 2010, 362, 1056. [Google Scholar] [CrossRef] [PubMed]
- Biagioni, E.; Ferrari, F.; Boldrini, A.; Roversi, M.F.; Cioni, G. Electroclinical correlation in neonatal seizures. Eur. J. Paediatr. Neurol. 1998, 2, 117–125. [Google Scholar] [CrossRef] [PubMed]
- Boylan, G.B.; Kharoshnkaya, L.; Wusthoff, C.J. Seizures and hypothermia: Importance of electroencephalographic monitoring and consideration for treatment. Semin. Fetal Neonatal Med. 2015, 20, 103–108. [Google Scholar] [CrossRef] [PubMed]
- Del Río, R.; Ochoa, C.; Alarcon, A.; Arnáez, J.; Blanco, D.; García-Alix, A. Amplitude Integrated Electroencephalogram as a Prognostic Tool in Neonates with Hypoxic-Ischemic Encephalopathy: A Systematic Review. PLoS ONE 2016, 11, e0165744. [Google Scholar] [CrossRef] [PubMed] [PubMed Central]
- Murray, D.M.; Bala, P.; O’Connor, C.M.; Ryan, C.A.; Connolly, S.; Boylan, G.B. The predictive value of early neurological examination in neonatal hypoxic-ischaemic encephalopathy and neurodevelopmental outcome at 24 months. Dev. Med. Child Neurol. 2010, 52, e55–e59. [Google Scholar] [CrossRef] [PubMed]
- Murray, D.M.; Boylan, G.B.; Ryan, C.A.; Connolly, S. Early EEG findings in hypoxic-ischemic encephalopathy predict outcomes at 2 years. Pediatrics 2009, 124, e459–e467. [Google Scholar] [CrossRef] [PubMed]
- Murray, D.M.; Ryan, C.A.; Boylan, G.B.; Fitzgerald, A.P.; Connolly, S. Prediction of seizures in asphyxiated neonates: Correlation with continuous video-electroencephalographic monitoring. Pediatrics 2006, 118, 41–46. [Google Scholar] [CrossRef] [PubMed]
- Thoresen, M. Who should we cool after perinatal asphyxia? Semin. Fetal Neonatal Med. 2015, 20, 66–71. [Google Scholar] [CrossRef] [PubMed]
- Stockard-Pope, J.E.; Werner, S.S.; Bickford, R.G. Atlas of Neonatal Electroencephalography, 2nd ed.; Raven Press: New York, NY, USA, 1992; p. 10036. [Google Scholar]
- Nanavati, T.; Seemaladinne, N.; Regier, M.; Yossuck, P.; Pergami, P. Can We Predict Functional Outcome in Neonates with Hypoxic Ischemic Encephalopathy by the Combination of Neuroimaging and Electroencephalography? Pediatr. Neonatol. 2015, 56, 307–316. [Google Scholar] [CrossRef] [PubMed] [PubMed Central]
- Low, J.A. Determining the contribution of asphyxia to brain damage in the neonate. J. Obstet. Obstet. Gynaecol. Res. 2004, 30, 276–286. [Google Scholar] [CrossRef] [PubMed]
- Pressler, R.M.; Boylan, G.B.; Morton, M.; Binnie, C.D.; Rennie, J.M. Early serial EEG in hypoxic ischaemic encephalopathy. Clin. Neurophysiol. 2001, 112, 31–37. [Google Scholar] [CrossRef] [PubMed]
- Lamblin, M.D.; Walls Esquivel, E.; André, M. The electroencephalogram of the full-term newborn: Review of normal features and hypoxic-ischemic encephalopathy patterns. Neurophysiol. Clin. 2013, 43, 267–287. [Google Scholar] [CrossRef] [PubMed]
- Walsh, B.H.; Murray, D.M.; Boylan, G.B. The use of conventional EEG for the assessment of hypoxic ischaemic encephalopathy in the newborn: A review. Clin. Neurophysiol. 2011, 122, 1284–1294. [Google Scholar] [CrossRef] [PubMed]
- Lugli, L.; Guidotti, I.; Pugliese, M.; Roversi, M.F.; Bedetti, L.; Della Casa Muttini, E.; Cavalleri, F.; Todeschini, A.; Genovese, M.; Ori, L.; et al. Polygraphic EEG Can Identify Asphyxiated Infants for Therapeutic Hypothermia and Predict Neurodevelopmental Outcomes. Children 2022, 9, 1194. [Google Scholar] [CrossRef]
- Prechtl, H.F.R. The optimality concept.Editorial. Early Human Dev. 1980, 4, 201–205. [Google Scholar]
- Sarnat, H.B.; Sarnat, M.S. Neonatal encephalopathy following fetal distress. A clinical and electroencephalographic study. Arch. Neurol. 1976, 33, 696–705. [Google Scholar] [CrossRef] [PubMed]
- Ancora, G.; Pomero, G.; Ferrari, F. (Eds.) 2012–2023 Italian Recommendations on Assistance to the Newborn with Hypoxic-Ischemic Encephalopathy Candidate for Hypothermic Treatment; Biomedia s.r.l.: Milano, Italy, 2023. [Google Scholar]
- Shankaran, S.; Laptook, A.R.; Ehrenkranz, R.A.; Tyson, J.E.; McDonald, S.A.; Donovan, E.F.; Fanaroff, A.A.; Poole, W.K.; Wright, L.L.; Higgins, R.D.; et al. Whole-body hypothermia for neonates with hypoxic-ischemic encephalopathy. N. Engl. J. Med. 2005, 353, 1574–1584. [Google Scholar] [CrossRef] [PubMed]
- Amiel-Tison, C. Neurological evaluation of the maturity of newborn infants. Arch. Dis. Child. 1968, 43, 89–93. [Google Scholar] [CrossRef]
- Pezzani, C.; Radvanyi-Bouvet, M.F.; Relier, J.P.; Monod, N. Neonatal electroencephalography during the first twenty-four hours of life in full-term newborn infants. Neuropediatrics 1986, 17, 11–18. [Google Scholar] [CrossRef] [PubMed]
- Briatore, E.; Ferrari, F.; Pomero, G.; Boghi, A.; Gozzoli, L.; Micciolo, R.; Espa, G.; Gancia, P.; Calzolari, S. EEG findings in cooled asphyxiated newborns and correlation with site and severity of brain damage. Brain Dev. 2013, 35, 420–426. [Google Scholar] [CrossRef] [PubMed]
- Gluckman, P.D.; Wyatt, J.S.; Azzopardi, D.; Ballard, R.; Edwards, A.D.; Ferriero, D.M.; Polin, R.A.; Robertson, C.M.; Thoresen, M.; Whitelaw, A.; et al. Selective head cooling with mild systemic hypothermia after neonatal encephalopathy: Multicentre randomised trial. Lancet 2005, 365, 663–670. [Google Scholar] [CrossRef] [PubMed]
- Clancy, R.R.; Dicker, L.; Cho, S.; Cook, N.; Nicolson, S.C.; Wernovsky, G.; Spray, T.L.; Gaynor, J.W. Agreement between long-term neonatal background classification by conventional and amplitude-integrated EEG. J. Clin. Neurophysiol. 2011, 28, 1–9. [Google Scholar] [CrossRef] [PubMed]
- Garvey, A.A.; Pavel, A.M.; O’Toole, J.M.; Walsh, B.H.; Korotchikova, I.; Livingstone, V.; Dempsey, E.M.; Murray, D.M.; Boylan, G.B. Multichannel EEG abnormalities during the first 6 hours in infants with mild hypoxic-ischaemic encephalopathy. Pediatr. Res. 2021, 90, 117–124, Erratum in Pediatr. Res. 2022, 91, 1626. https://doi.org/10.1038/s41390-021-01610-7. [Google Scholar] [CrossRef] [PubMed] [PubMed Central]
- Koskela, T.; Kendall, G.S.; Memon, S.; Sokolska, M.; Mabuza, T.; Huertas-Ceballos, A.; Mitra, S.; Robertson, N.J.; Meek, J.; Whitehead, K. Prognostic value of neonatal EEG following therapeutic hypothermia in survivors of hypoxic-ischemic encephalopathy. Clin. Neurophysiol. 2021, 132, 2091–2100. [Google Scholar] [CrossRef] [PubMed] [PubMed Central]
- Nash, K.B.; Bonifacio, S.L.; Glass, H.C.; Sullivan, J.E.; Barkovich, A.J.; Ferriero, D.M.; Cilio, M.R. Video-EEG monitoring in newborns with hypoxic-ischemic encephalopathy treated with hypothermia. Neurology 2011, 76, 556–562. [Google Scholar] [CrossRef] [PubMed] [PubMed Central]
- Ferrari, F.; Biagioni, E.; Cioni, G. Neonatal Electroencephalography in Fetal and Neonatal Neurology and Neurosurgery, 3rd ed.; Levene, M.I., Chervenak, F.A., Whittle, M., Eds.; Churchill Livingstone: London, UK, 2001; pp. 155–180. [Google Scholar]
- Pisani, F.; Cerminara, C.; Fusco, C.; Sisti, L. Neonatal status epilepticus vs recurrent neonatal seizures: Clinical findings and outcome. Neurology 2007, 69, 2177–2185. [Google Scholar] [CrossRef] [PubMed]
- Volpe, J.J. Neurology of the newborn. Major Probl. Clin. Pediatr. 1981, 22, 1–648. [Google Scholar] [PubMed]
- Touwen, B.C.L. Neurological Development in Infancy; Mc Keith Press: London, UK, 1976. [Google Scholar]
- Hrachovy, R.A.; Mizrahi, E.M.; Kellaway, P. Electroencephalography of the newborn. In Current Practice of Clinical Electroencephalography, 2nd ed.; Daly, D.D., Pedley, T.A., Eds.; Raven Press: New York, NY, USA, 1990. [Google Scholar]
- Pisani, F.; Spagnoli, C.; Falsaperla, R.; Nagarajan, L.; Ramantani, G. Seizures in the neonate: A review of etiologies and outcomes. Seizure 2021, 85, 48–56. [Google Scholar] [CrossRef] [PubMed]
- Shalak, L.F.; Laptook, A.R.; Velaphi, S.C.; Perlman, J.M. Amplitude-integrated electroencephalography coupled with an early neurologic examination enhances prediction of term infants at risk for persistent encephalopathy. Pediatrics 2003, 111, 351–357. [Google Scholar] [CrossRef] [PubMed]
- Guidotti, I.; Lugli, L.; Guerra, M.P.; Ori, L.; Gallo, C.; Cavalleri, F.; Ranzi, A.; Frassoldati, R.; Berardi, A.; Ferrari, F. Hypothermia reduces seizure burden and improves neurological outcome in severe hypoxic-ischemic encephalopathy: An observational study. Dev. Med. Child Neurol. 2016, 58, 1235–1241. [Google Scholar] [CrossRef] [PubMed]

| Perinatal Data | |
|---|---|
| 36 (59%) | Male, n (%) |
| Auxological data at birth: | |
| 61.67 (27.07) | Mean percentile birth weight (SD) |
| 66.32 (28.08) | Mean percentile birth length (SD) |
| 39.75 (1.18) | Mean Gestational Age, weeks (SD) |
| Mode of Delivery | |
| 21 (34.42%) | Vaginal delivery, n (%) |
| 40 (65.5%) | Operative delivery, n (%) |
| 15 (24.59%) | Vacuum, n (%) |
| 3 (4.92%) | Kristeller, n (%) |
| 3 (4.92%) | Kristeller + Sucker, n (%) |
| 19 (31.15%) | Emergency Cesarean Section, n (%) |
| Amniotic Fluid | |
| 20 (37.8%) | Limpid, n (%) |
| 30 (56.6%) | Meconium stained, n (%) |
| 3 (5.6%) | Hematic, n (%) |
| 1.72 (1.35) | Mean APGAR SCORE at 1st minute (SD) |
| 4.1 (1.68) | Mean APGAR SCORE at 5th minute (SD) |
| 5.6 (1.65) | Mean APGAR SCORE at 10th minute (SD) |
| Umbilical Cord Acidosis | |
| 6.93 (0.16) | Mean pH (SD) |
| −17.07 (5.54) | Mean Base Excess (SD) |
| Griffith DQ | Neurological Outcome at 24 Months | HIE GRADE | Global Dammiss Score at the 7 Time Points | Patient No. | ||||||
|---|---|---|---|---|---|---|---|---|---|---|
| >7 | 78 | 72 | 48 | 24 | 12 | 6 | ||||
| 108 | Mild Abnormal: clumsy | 3 | X | X | 4 | 8 | 3 | 9 | 10 | 1 |
| 96 | Normal | 3 | X | X | X | 8 | 5 | 7 | 4 | 2 |
| NA | Normal | 3 | 14 | X | 11 | 9 | 1 | 7 | 6 | 3 |
| 75 | Mild Abnormal: clumsy speech delay | 3 | X | X | 10 | 9 | 9 | 9 | 4 | 4 |
| 111 | Normal | 3 | 13 | X | X | 7 | 9 | 7 | 6 | 5 |
| 104 | Normal | 3 | 13 | 11 | 10 | 8 | 6 | 5 | 6 | 6 |
| 49 | Abnormal: CP | 3 | 13 | 11 | 11 | X | 6 | 7 | 6 | 7 |
| 117 | Normal | 2 | 14 | 11 | 11 | 10 | X | 10 | 10 | 8 |
| 110 | Normal | 2 | X | 12 | 11 | 10 | 9 | 9 | 9 | 9 |
| 89 | Normal | 2 | X | 12 | 12 | X | 9 | 10 | 9 | 10 |
| NA | Normal | 3 | 12 | X | 7 | 9 | 9 | 8 | 6 | 11 |
| 49 | Abnormal: CP | 3 | 12 | 8 | 6 | 9 | 6 | X | 6 | 12 |
| 93 | Abnormal: CP | 3 | X | 12 | 11 | 9 | 5 | 4 | 3 | 13 |
| 101 | Mild Abnormal: clumsy | 2 | 11 | 7 | 8 | 5 | 3 | 5 | 4 | 14 |
| 105 | Normal | 2 | X | 11 | 11 | 10 | 9 | 9 | 10 | 15 |
| 112 | Normal | 3 | 12 | 11 | 10 | 8 | 5 | 2 | X | 16 |
| 106 | Mild Abnormal: clumsy | 2 | 13 | 12 | 10 | 9 | X | X | 4 | 17 |
| 111 | Normal | 3 | 14 | 12 | 12 | 12 | 11 | 10 | 9 | 18 |
| 110 | Normal | 2 | 12 | 12 | 11 | 11 | 10 | 13 | 10 | 19 |
| 112 | Normal | 2 | 12 | 12 | 11 | 11 | 10 | 13 | 10 | 20 |
| 77 | Mild Abnormal: mental delay | 3 | 11 | 6 | 5 | 5 | 2 | 5 | 2 | 21 |
| 85 | Mild Abnormal: speech delay | 3 | 14 | 12 | 9 | 8 | 5 | 4 | 6 | 22 |
| 102 | Normal | 2 | 14 | X | 13 | 10 | 11 | 10 | 9 | 23 |
| 89 | Mild Abnormal: clumsy | 2 | 14 | 11 | 10 | 12 | 5 | 6 | 2 | 24 |
| 117 | Normal | 2 | 13 | 13 | 9 | 5 | 7 | 9 | 8 | 25 |
| 117 | Normal | 2 | 12 | 12 | 12 | 12 | 12 | 11 | 11 | 26 |
| 100 | Normal | 2 | 12 | 11 | 11 | 10 | 9 | 8 | 7 | 27 |
| 106 | Normal | 2 | X | 12 | 10 | 9 | X | 8 | 8 | 28 |
| 110 | Normal | 2 | 12 | 11 | 8 | 5 | 9 | 10 | 8 | 29 |
| 109 | Mild Abnormal: eye movement deficit | 2 | 13 | 11 | 11 | 10 | 8 | 9 | 8 | 30 |
| 112 | Normal | 2 | 6 | 4 | 4 | 5 | 5 | 7 | 10 | 31 |
| 106 | Normal | 2 | 11 | 10 | 6 | 6 | 7 | 6 | 6 | 32 |
| 114 | Abnormal | 2 | 10 | 9 | 8 | 8 | 7 | 6 | 7 | 33 |
| NA | Mild Abnormal: mild hearing loss | 2 | 10 | 10 | 11 | 8 | 7 | 7 | 7 | 34 |
| 111 | Normal | 2 | 14 | 11 | 11 | 10 | X | X | 7 | 35 |
| 105 | Normal | 3 | 13 | 11 | 11 | 8 | 6 | 4 | 4 | 36 |
| NA | Normal | 2 | X | 11 | 11 | 9 | 8 | 4 | 2 | 37 |
| 109 | Normal | 2 | X | 11 | 11 | 10 | 10 | 10 | 9 | 38 |
| 108 | Normal | 2 | 12 | 9 | 9 | 7 | 9 | 9 | 7 | 39 |
| 88 | Normal | 2 | 10 | 10 | 7 | 9 | 8 | 9 | 10 | 40 |
| 112 | Normal | 2 | 13 | 13 | 11 | 10 | 10 | 9 | 7 | 41 |
| 93 | Normal | 2 | X | 8 | 8 | 8 | 6 | 5 | 6 | 42 |
| 83 | Mild Abnormal: clumsy | 2 | X | 10 | 10 | 9 | 9 | 6 | 5 | 43 |
| 102 | Normal | 2 | X | 10 | 10 | X | 10 | 8 | 9 | 44 |
| 110 | Abnormal: CP | 2 | 13 | 10 | 10 | 7 | 8 | 8 | 11 | 45 |
| 104 | Normal | 3 | 11 | 10 | 10 | 10 | 9 | 5 | 2 | 46 |
| NA | Normal | 3 | 14 | 10 | 10 | 9 | 9 | 9 | 9 | 47 |
| 104 | Normal | 2 | 13 | 11 | 10 | 10 | 9 | NA | 11 | 48 |
| 86 | Mild Abnormal: speech delay | 3 | 11 | 8 | 6 | 4 | 0 | 1 | 2 | 49 |
| 110 | Normal | 3 | 13 | 6 | 11 | 10 | 7 | 8 | 6 | 50 |
| 105 | Normal | 2 | 14 | 9 | 10 | 9 | 9 | 11 | 6 | 51 |
| NA | Normal | 2 | 12 | 7 | 7 | 7 | 5 | 6 | 7 | 52 |
| 103 | Normal | 2 | NP | 10 | 9 | 9 | 10 | 7 | 7 | 53 |
| 108 | Normal | 3 | NP | 12 | 9 | 8 | 8 | 5 | 12 | 54 |
| 119 | Mild Abnormal: clumsy | 23 | 14 | 12 | 11 | 9 | 8 | 6 | 8 | 55 |
| 85 | Mild Abnormal: clumsy | 2 | X | 8 | 8 | 8 | 8 | 7 | X | 56 |
| 115 | Normal | 1–2 | 9 | 4 | 2 | 4 | 5 | 4 | 5 | 57 |
| 100 | Normal | 1–2 | 14 | 9 | 8 | 7 | 8 | 8 | 8 | 58 |
| 105 | Mild Abnormal: clumsy | 1–2 | X | 9 | 8 | 8 | 8 | 6 | 6 | 59 |
| 74 | Normal | 1–2 | 11 | 11 | 8 | 9 | 8 | 8 | 9 | 60 |
| 111 | Mild Abnormal: clumsy | 2 | 14 | 13 | 10 | 3 | 7 | 8 | 8 | 61 |
| Griffith Tot | ||||||||
|---|---|---|---|---|---|---|---|---|
| Spearman Rank (R) and p-Value | 6 h | 12 h | 24 h | 48 h | 72 h | 78 h | 2 nd Week | |
| M | R | 0.36 | 0.08 | 0.14 | −0.05 | 0.23 | 0.15 | −0.27 |
| p-value | 0.0087 | 0.5939 | 0.3329 | 0.7089 | 0.1035 | 0.3149 | 0.0952 | |
| SS | R | 0.42 | 0.33 | 0.28 | 0.17 | 0.32 | 0.34 | 0.19 |
| p-value | 0.0018 | 0.0210 | 0.0503 | 0.2353 | 0.0222 | 0.0171 | 0.2609 | |
| I | R | 0.28 | 0.22 | 0.18 | −0.12 | 0.14 | 0.28 | 0.08 |
| p-value | 0.0410 | 0.1248 | 0.2055 | 0.4109 | 0.3165 | 0.0453 | 0.6188 | |
| BD | R | 0.29 | 0.19 | 0.19 | 0.09 | 0.14 | 0.01 | −0.27 |
| p-value | 0.0380 | 0.1964 | 0.1755 | 0.5464 | 0.3394 | 0.9557 | 0.1050 | |
| BA | R | 0.18 | 0.13 | −0.08 | −0.20 | −0.18 | 0.01 | 0.00 |
| p-value | 0.2060 | 0.3635 | 0.6035 | 0.1690 | 0.2109 | 0.9682 | 1.0000 | |
| BM | R | 0.45 | 0.35 | 0.36 | 0.03 | 0.13 | −0.01 | 0.00 |
| p-value | 0.0007 | 0.0137 | 0.0092 | 0.8420 | 0.3760 | 0.9657 | 0.9766 | |
| S | R | NA | 0.19 | 0.16 | 0.13 | −0.20 | −0.09 | NA |
| p-value | NA | 0.1663 | 0.2396 | 0.3572 | 0.1446 | 0.5315 | NA | |
| DS | R | 0.45 | 0.31 | 0.26 | 0.07 | 0.29 | 0.33 | 0.07 |
| p-value | 0.0008 | 0.0320 | 0.0731 | 0.6241 | 0.0402 | 0.0205 | 0.6601 | |
| AUC at 6 h | AUC at 12 h | AUC at 24 h | |
|---|---|---|---|
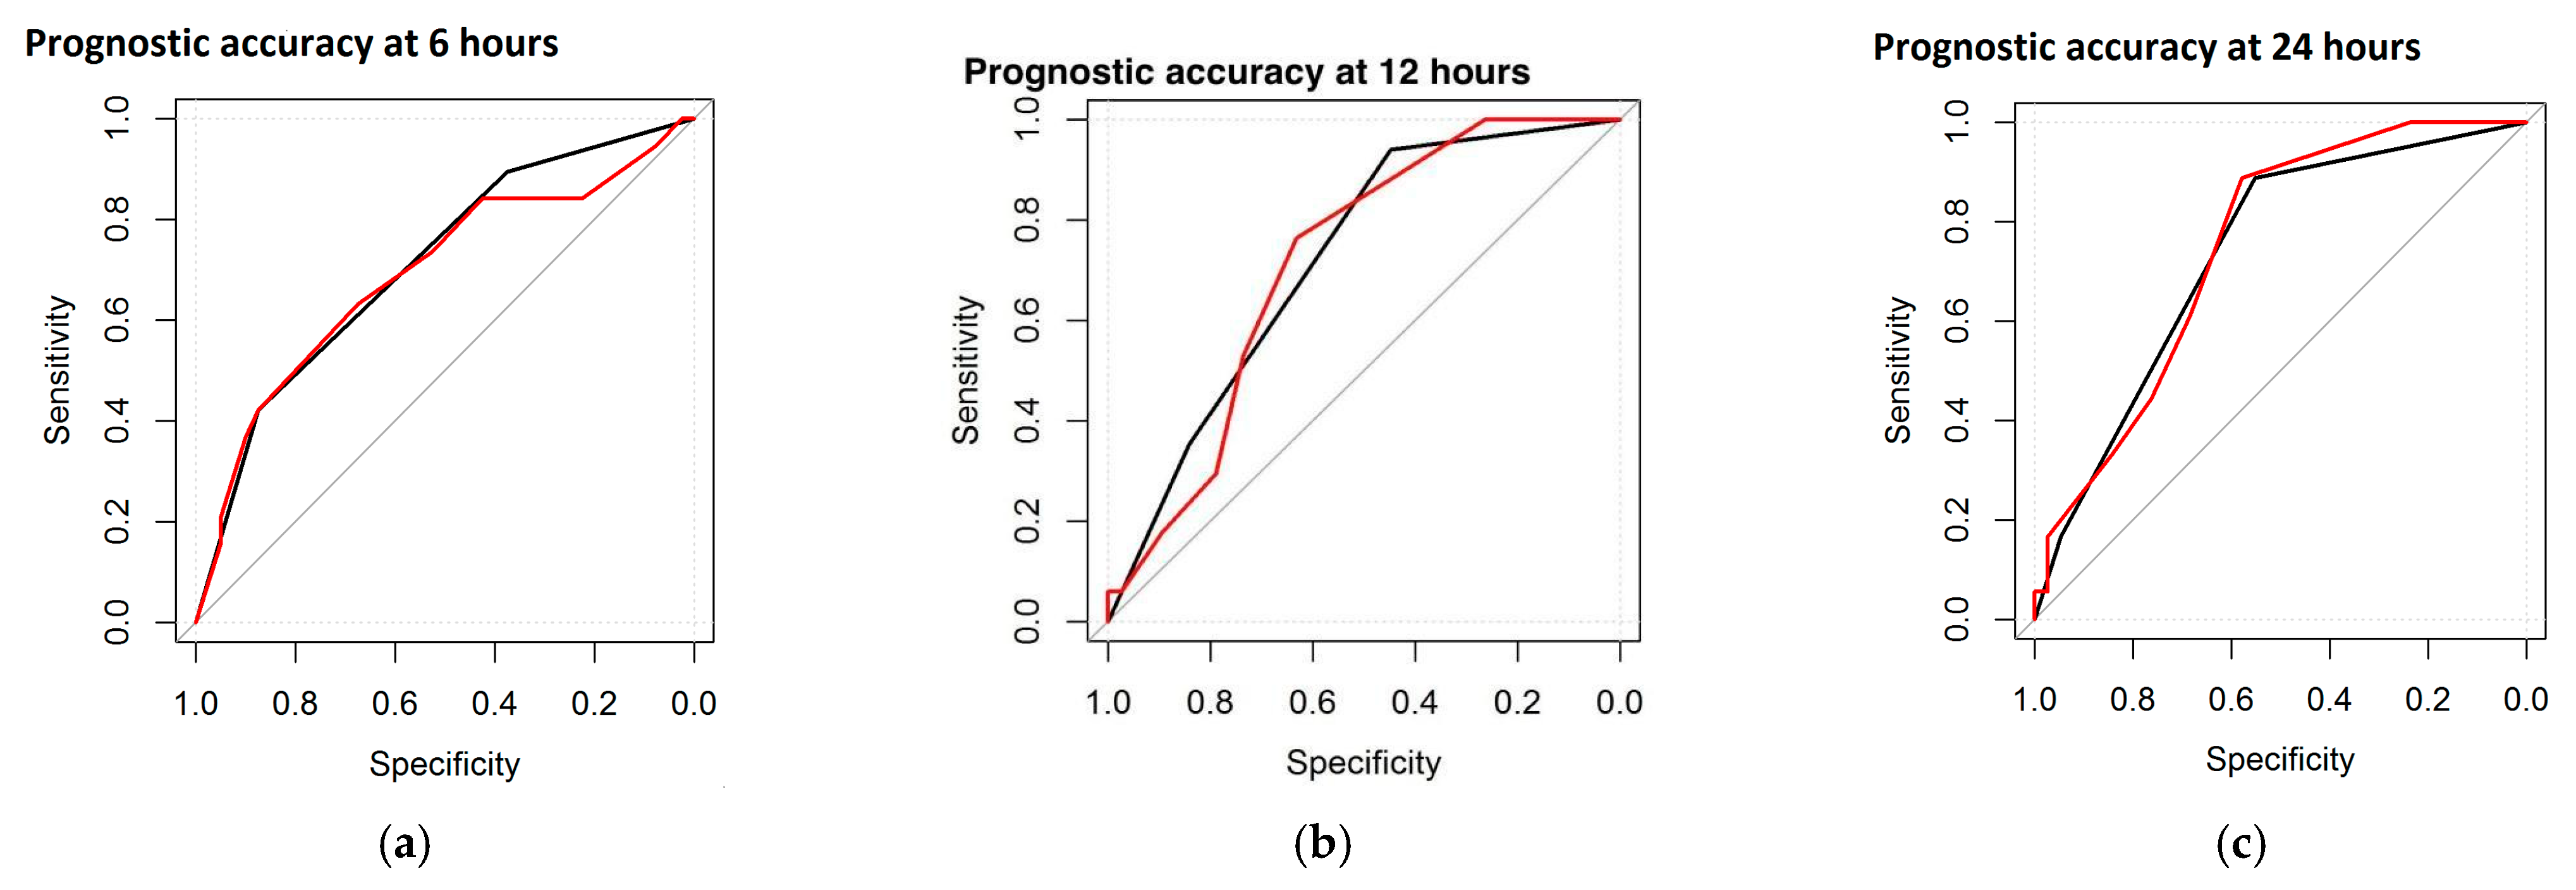
| Global DS | 78.6% | 74.6% | 67.6% |
| Maturational Features | 75.1% | 73.5% | 70.9% |
Disclaimer/Publisher’s Note: The statements, opinions and data contained in all publications are solely those of the individual author(s) and contributor(s) and not of MDPI and/or the editor(s). MDPI and/or the editor(s) disclaim responsibility for any injury to people or property resulting from any ideas, methods, instructions or products referred to in the content. |
© 2025 by the authors. Licensee MDPI, Basel, Switzerland. This article is an open access article distributed under the terms and conditions of the Creative Commons Attribution (CC BY) license (https://creativecommons.org/licenses/by/4.0/).
Share and Cite
Ferrari, F.; Bondi, C.; Lugli, L.; Bedetti, L.; Guidotti, I.; Banchelli, F.; Lucaccioni, L.; Berardi, A. The Dammiss EEG Score: A New System to Quantify EEG Abnormalities and Predict the Outcome in Asphyxiated Newborns. J. Clin. Med. 2025, 14, 1920. https://doi.org/10.3390/jcm14061920
Ferrari F, Bondi C, Lugli L, Bedetti L, Guidotti I, Banchelli F, Lucaccioni L, Berardi A. The Dammiss EEG Score: A New System to Quantify EEG Abnormalities and Predict the Outcome in Asphyxiated Newborns. Journal of Clinical Medicine. 2025; 14(6):1920. https://doi.org/10.3390/jcm14061920
Chicago/Turabian StyleFerrari, Fabrizio, Carolina Bondi, Licia Lugli, Luca Bedetti, Isotta Guidotti, Federico Banchelli, Laura Lucaccioni, and Alberto Berardi. 2025. "The Dammiss EEG Score: A New System to Quantify EEG Abnormalities and Predict the Outcome in Asphyxiated Newborns" Journal of Clinical Medicine 14, no. 6: 1920. https://doi.org/10.3390/jcm14061920
APA StyleFerrari, F., Bondi, C., Lugli, L., Bedetti, L., Guidotti, I., Banchelli, F., Lucaccioni, L., & Berardi, A. (2025). The Dammiss EEG Score: A New System to Quantify EEG Abnormalities and Predict the Outcome in Asphyxiated Newborns. Journal of Clinical Medicine, 14(6), 1920. https://doi.org/10.3390/jcm14061920