Author Contributions
Conceptualization, Ö.N.S. and T.B.; methodology, Ö.N.S.; software, T.B.; validation, Ö.N.S., T.B. and S.Y.; formal analysis, Ö.N.S., T.B. and S.Y.; investigation, Ö.N.S. and S.Y.; resources, Ö.N.S.; data curation, Ö.N.S. and T.B.; writing—original draft preparation, Ö.N.S.; writing—review and editing, Ö.N.S.; visualization, Ö.N.S. and S.Y.; supervision, Ö.N.S. and T.B. All authors have read and agreed to the published version of the manuscript.
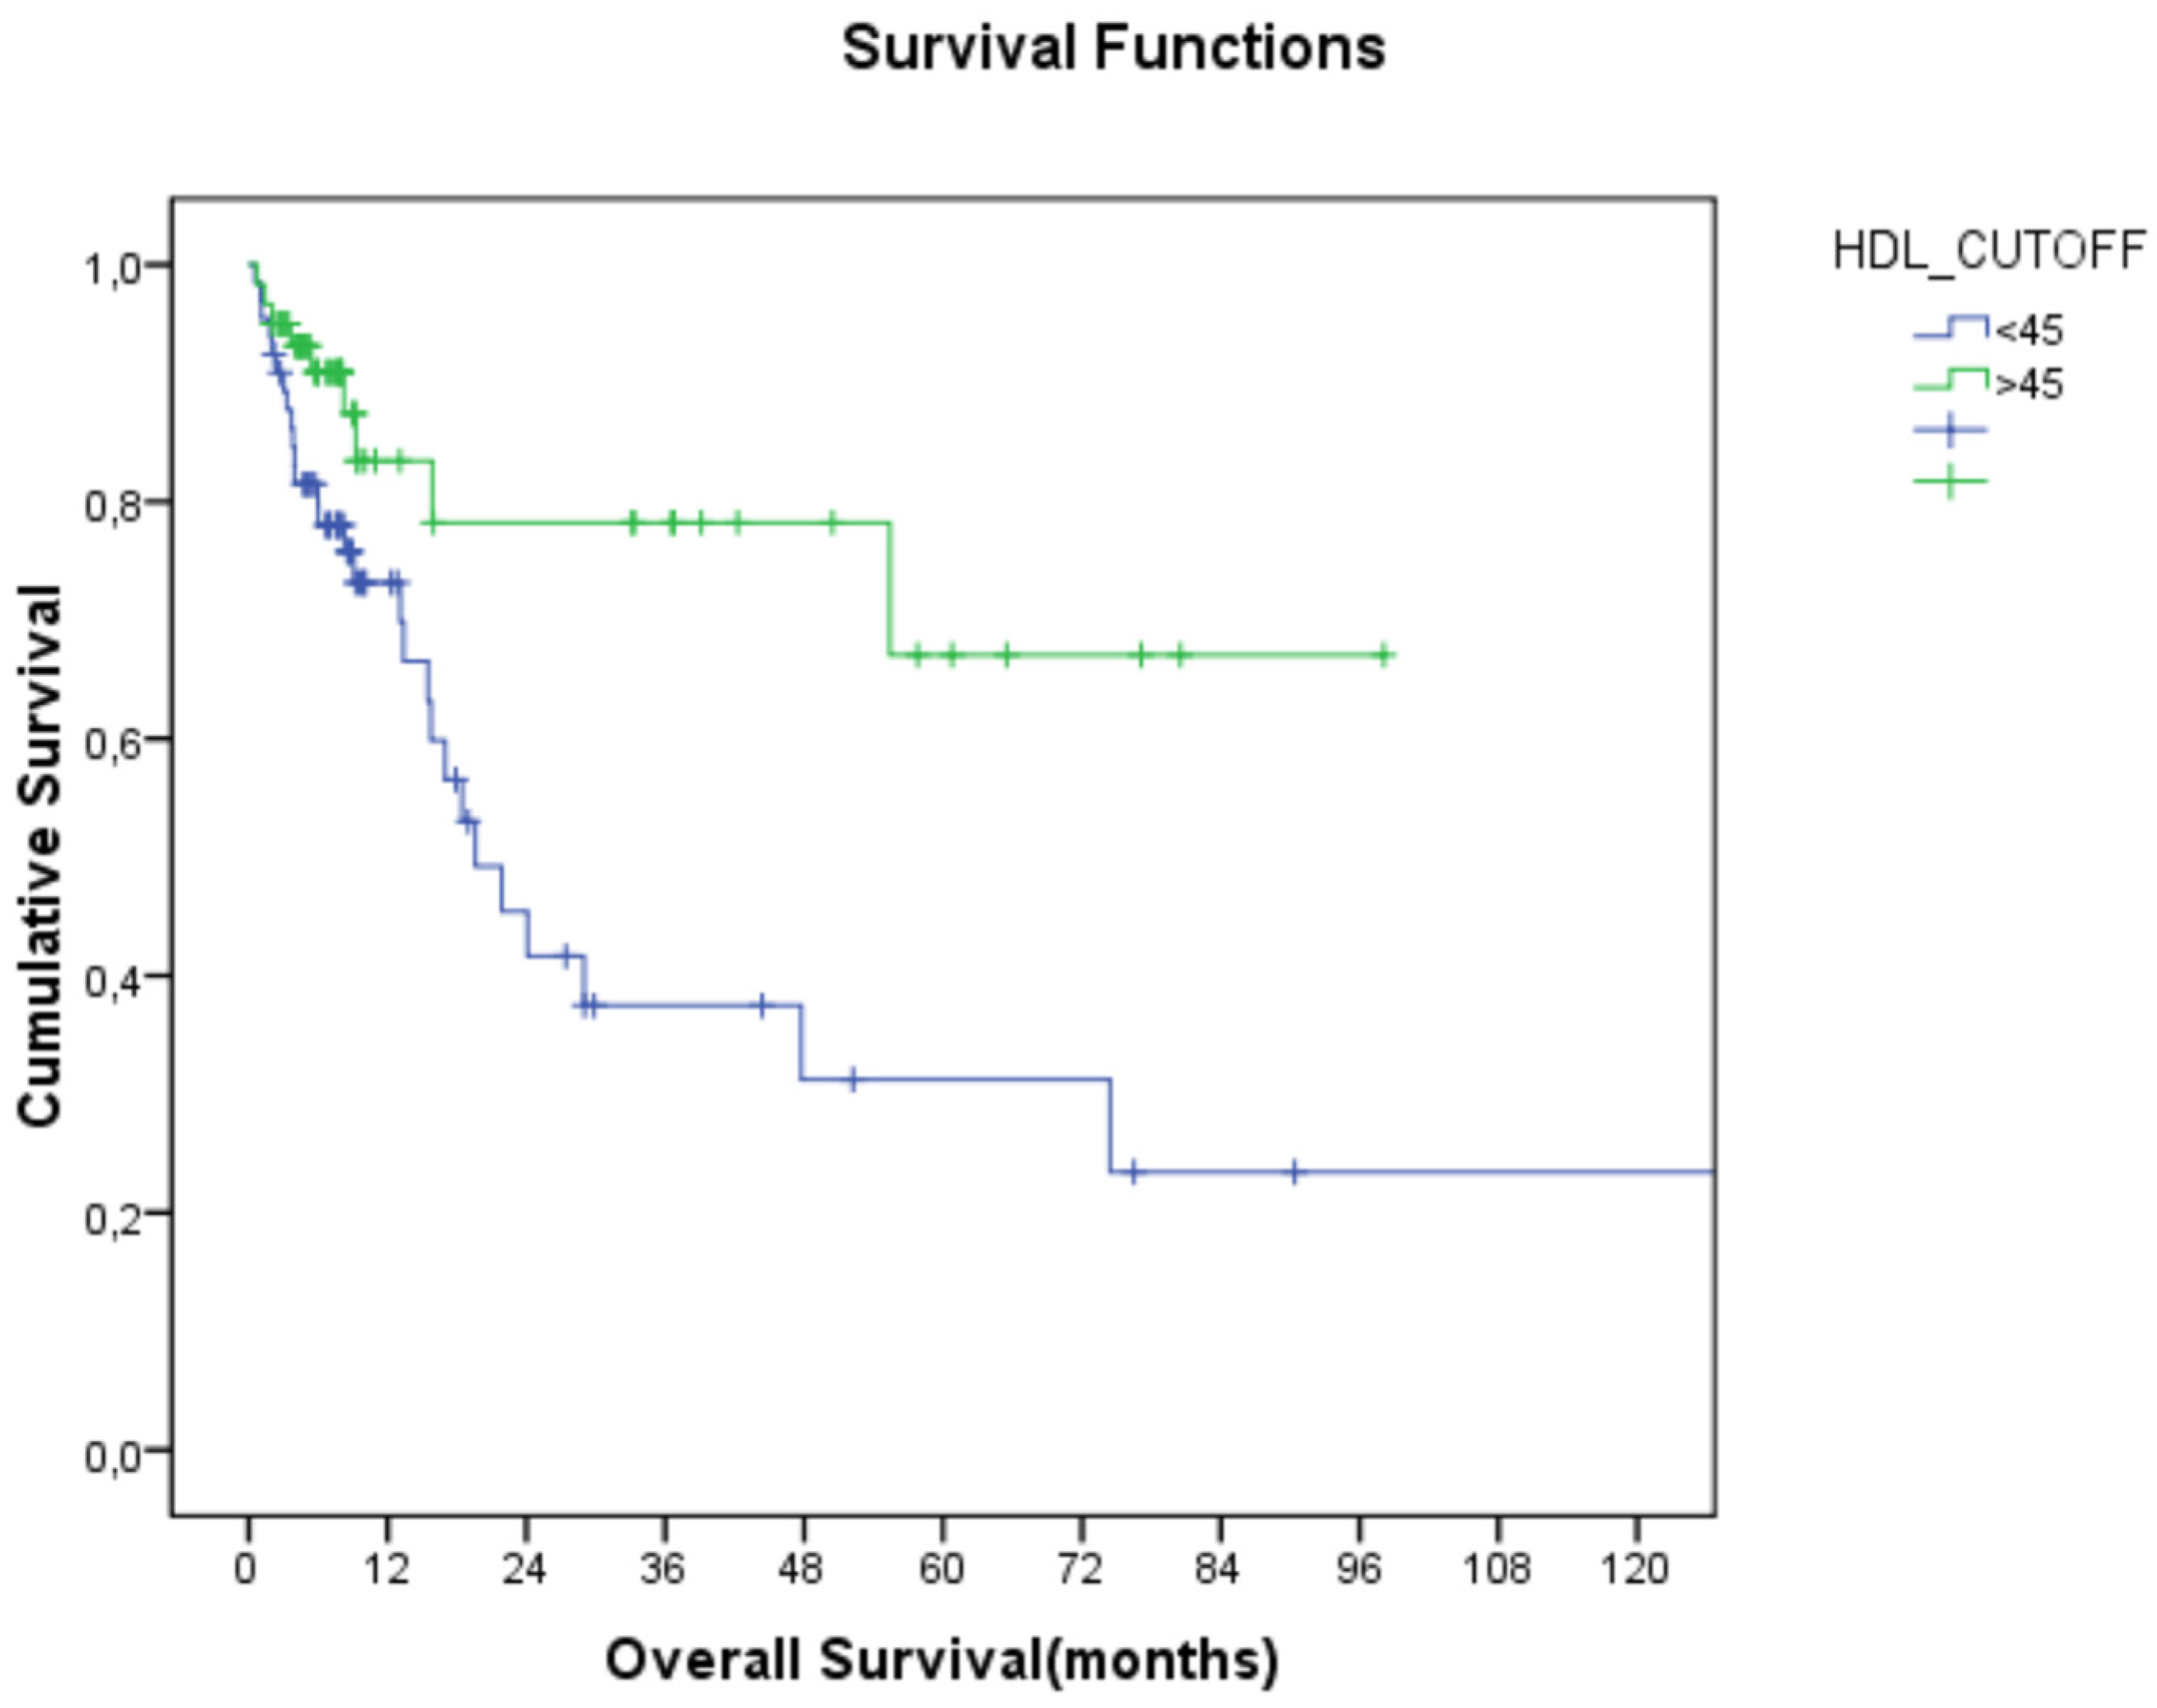
Figure 1.
Relationship between HDL-C and overall survival (HDL-C: high-density lipoprotein cholesterol).
Figure 1.
Relationship between HDL-C and overall survival (HDL-C: high-density lipoprotein cholesterol).
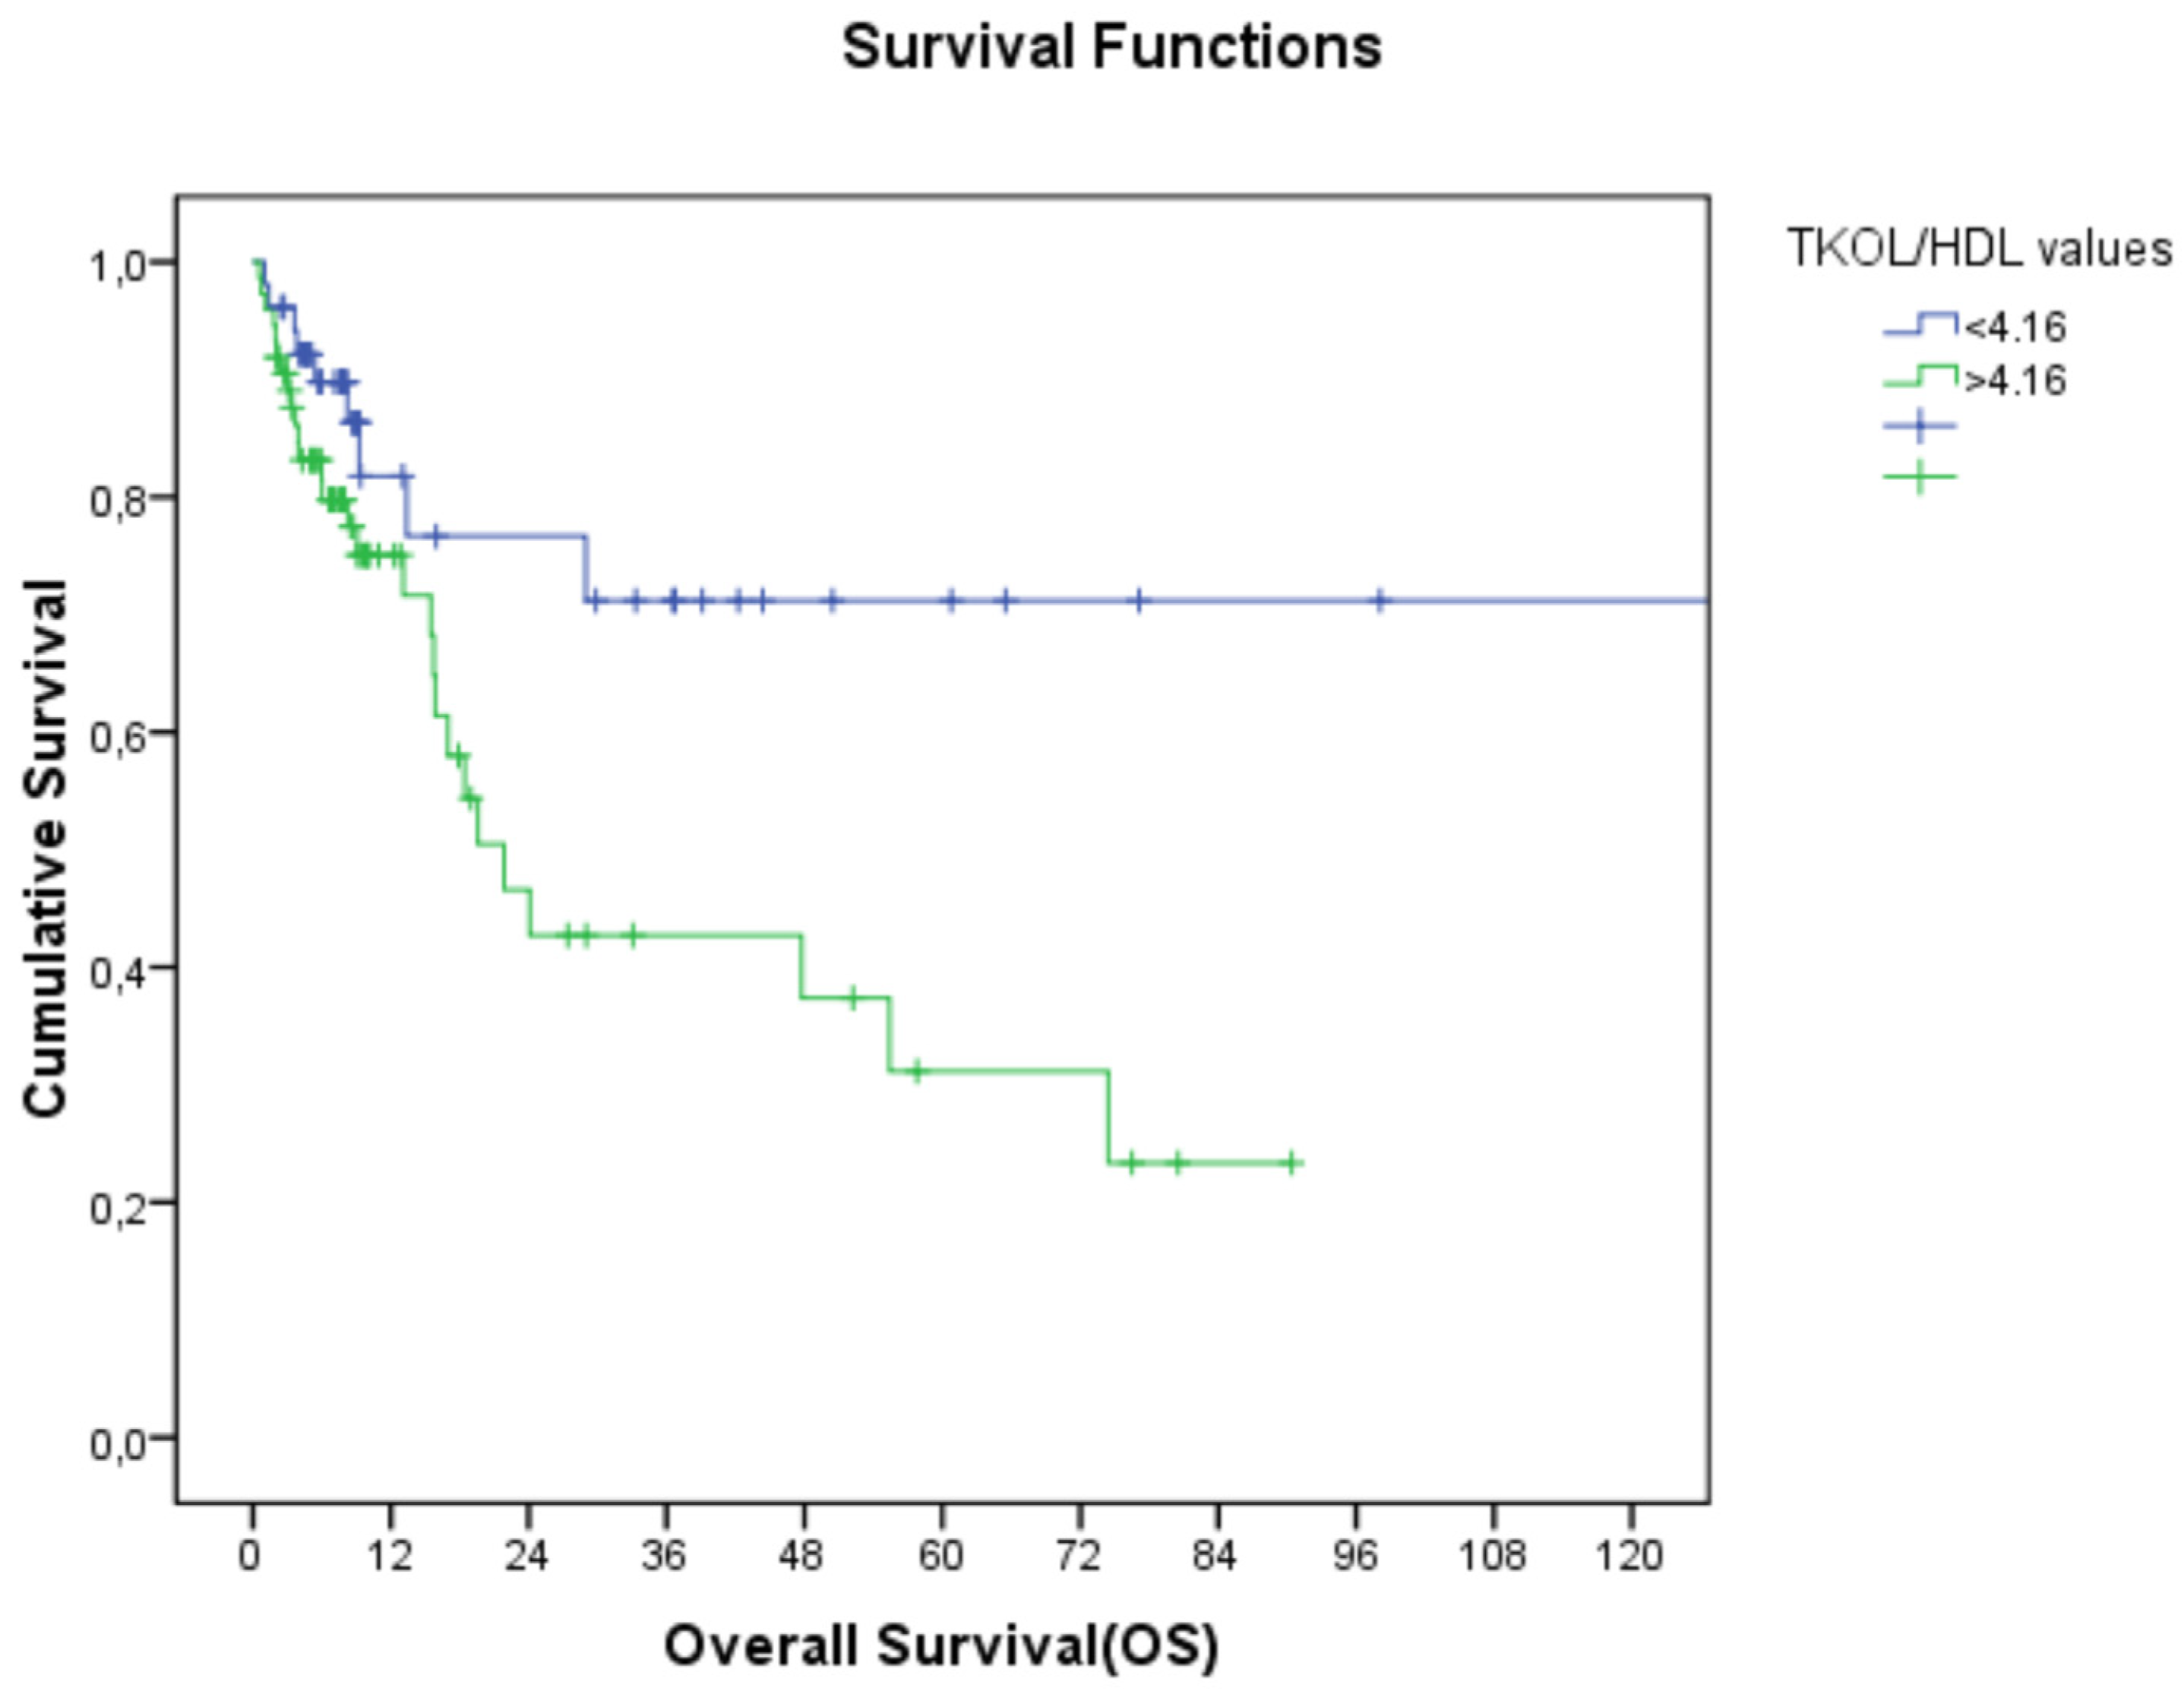
Figure 2.
Relationship between TC/HDL-C and overall survival (TC/HDL-C: total cholesterol/high-density lipoprotein cholesterol).
Figure 2.
Relationship between TC/HDL-C and overall survival (TC/HDL-C: total cholesterol/high-density lipoprotein cholesterol).
Table 1.
Demographic and clinical characteristics of the patients (descriptive statistics analyses).
Table 1.
Demographic and clinical characteristics of the patients (descriptive statistics analyses).
| | n (%) |
|---|
| Age | |
| <65 | 63 (50%) |
| ≥65 | 63 (50%) |
| Gender | |
| Female | 46 (36.5%) |
| Male | 80 (63.5%) |
| ECOG | |
| 0 | 81 (64.3%) |
| 1 | 31 (24.6%) |
| 2 | 14 (11.1%) |
| Localization | |
| Right colon | 45 (35.7%) |
| Left colon | 81 (64.3%) |
| Stage | |
| Early stage (I, II, and III) | 71 (56.3%) |
| Advanced stage (IV) | 55 (43.7%) |
| CEA | |
| ˂5 ng/mL | 72 (57.1%) |
| ≥5 ng/mL | 54 (42.9%) |
Table 2.
(a) Lipid profiles of the patients according to cut-off values (descriptive statistics analyses with crosstabs). TC: total cholesterol, TGs: triglycerides, LDL-C: low-density lipoprotein cholesterol, HDL-C: high-density lipoprotein cholesterol, TC/HDL-C: total cholesterol/high-density lipoprotein cholesterol, TGs/HDL-C: triglycerides/high-density lipoprotein cholesterol, n: number. (b) Lipid parameters according to tumor localization (descriptive statistics analyses with crosstabs). TC: total cholesterol, TGs: triglycerides, LDL-C: low-density lipoprotein cholesterol, HDL-C: high-density lipoprotein cholesterol, n: number.
| (a) |
|---|
| Lipid Parameter | Cut-Off | Total, n (%) | Left Colon, n (%) | Right Colon, n (%) |
|---|
| TC (mg/dL) | >200 | 47 (37.9) | 33 (40.7) | 14 (31.1) |
| | ≤200 | 79 (62.7) | 48 (59.3) | 31 (68.9) |
| TGs (mg/dL) | >150 | 46 (36.5) | 29 (35.8) | 17 (37.8) |
| | ≤150 | 80 (63.5) | 52 (64.2) | 28 (62.2) |
| LDL-C (mg/dL) | >150 | 27 (21.4) | 22 (27.2) | 5 (11.1) |
| | ≤150 | 99 (78.6) | 59 (72.8) | 40 (88.9) |
| HDL-C (mg/dL) | ˂45 | 66 (52.4) | 45 (55.6) | 21 (46.7) |
| | ≥45 | 60 (47.6) | 36 (44.4) | 24 (53.3) |
| TC/HDL-C | ˂4.16 | 52 (41.3) | 27 (33.3) | 25 (55.6) |
| | ≥4.16 | 74 (58.7) | 54 (66.7) | 20 (44.4) |
| TGs/HDL-C | ˂2.97 | 61 (48.4) | 37 (45.7) | 24 (53.3) |
| | ≥2.97 | 65 (51.6) | 44 (54.3) | 21 (46.7) |
| (b) |
| Lipid Parameters | Left Colon (n = 81) (median (min–max)) | Right Colon (n = 45) (median (min–max)) |
| HDL-C (mg/dL) | 42 (17–71) | 45 (13–80) |
| LDL-C (mg/dL) | 122 (60–257) | 93.5 (33–271) |
| TGs (mg/dL) | 130.5 (61–639) | 136 (29–431) |
| TC (mg/dL) | 196 (119–318) | 172 (77–304) |
Table 3.
Relationship between lipid parameters and overall survival regardless of stage (Kaplan– Meier analyses). TC: total cholesterol, TGs: triglycerides, LDL-C: low-density lipoprotein cholesterol, HDL-C: high-density lipoprotein cholesterol, TC/HDL-C: total cholesterol/high-density lipoprotein cholesterol, TGs/HDL-C: triglycerides/high-density lipoprotein cholesterol, OS: overall survival.
| Lipid Parameter | Cut-Off | OS | p-Value |
|---|
| TC (mg/dL) | >200 | 74 | |
| | ≤200 | 21 | 0.5 |
| TGs (mg/dL) | >150 | 47 | |
| | ≤150 | 53 | 0.9 |
| LDL-C (mg/dL) | >150 | 24 | |
| | ≤150 | 74 | 0.6 |
| HDL-C (mg/dL) | ˂45 | 19.9 | |
| | ≥45 | NR | 0.004 |
| TC/HDL-C | ˂4.16 | 130 | |
| | ≥4.16 | 21 | 0.016 |
| TGs/HDL-C | ˂2.97 | 28 | |
| | ≥2.97 | 55 | 0.98 |
Table 4.
Relationship between lipid parameters and overall survival in early- and advanced-stage disease (Kaplan–Meier analyses). TC: total cholesterol, TGs: triglycerides, LDL-C: low-density lipoprotein cholesterol, HDL-C: high-density lipoprotein cholesterol, TC/HDL-C: total cholesterol/high-density lipoprotein cholesterol, TGs/HDL-C: triglycerides/high-density lipoprotein cholesterol, OS: overall survival, NR: not reached, n: number.
| | | Early Stages (Stage 1, 2, and 3) (n = 71) | | Advanced Stage (Stage 4) (n = 55) | |
|---|
| Lipid Parameter | Cut-Off | OS | p-Value | OS | p-Value |
|---|
| TC (mg/dL) | >200 | NR | | 16.9 | |
| | ≤200 | 130 | 0.8 | 8.2 | 0.58 |
| TGs (mg/dL) | >150 | 130 | | 19.5 | |
| | ≤150 | NR | 0.98 | 15.5 | 0.83 |
| LDL-C (mg/dL) | >150 | 55 | | 15.7 | |
| | ≤150 | 13 | 0.50 | 9.2 | 0.80 |
| HDL-C (mg/dL) | ˂45 | 74 | | 15.5 | |
| | ≥45 | NR | 0.04 | NR | 0.09 |
| TC/HDL-C | ˂4.16 | 130 | | NR | |
| | ≥4.16 | 74 | 0.41 | 15 | 0.03 |
| TGs/HDL-C | ˂2.97 | NR | 0.96 | 13.1 | 0.86 |
| | ≥2.97 | 130 | | 18.4 | |
Table 5.
Relationship between lipid parameters and overall survival according to left colon and right colon localization (Kaplan–Meier analyses). TC: total cholesterol, TGs: triglycerides, LDL-C: low-density lipoprotein cholesterol, HDL-C: high-density lipoprotein cholesterol, TC/HDL-C: total cholesterol/high-density lipoprotein cholesterol, TGs/HDL-C: triglycerides/high-density lipoprotein cholesterol, OS: overall survival).
| | | Left Colon (n = 81) | | Right Colon (n = 45) | |
|---|
| Lipid Parameter | Cut-Off | OS (Months) | p-Value | OS (Months) | p-Value |
|---|
| TC (mg/dL) | >200 | 24 | | 21.8 | |
| | ≤200 | 47.7 | 0.26 | 130 | 0.83 |
| TGs (mg/dL) | >150 | 24 | | 130 | |
| | ≤150 | 47.7 | 0.79 | 28 | 0.50 |
| LDL-C (mg/dL) | >150 | 55.4 | | 13.1 | |
| | ≤150 | 47.7 | 0.36 | 130 | 0.018 |
| HDL-C (mg/dL) | ˂45 | 19.5 | | 21 | |
| | ≥45 | NR | 0.01 | NR | 0.11 |
| TC/HDL-C | ˂4.16 | NR | | 130 | |
| | ≥4.16 | 19.5 | 0.05 | 21 | 0.26 |
| TGs/HDL-C | ˂2.97 | NR | | 28 | |
| | ≥2.97 | 47.7 | 0.94 | 130 | 0.067 |
Table 6.
Univariate analysis of parameters affecting overall survival using Cox regression analyses (TC: total cholesterol, TGs: triglycerides, LDL-C: low-density lipoprotein cholesterol, HDL-C: high-density lipoprotein cholesterol, TC/HDL-C: total cholesterol/high-density lipoprotein cholesterol, TGs/HDL-C: triglycerides/high-density lipoprotein cholesterol, CEA: carcinoembryonic antigen, HR: hazard ratio, CI: confidence interval).
| | HR | p-Value | CI |
|---|
| Age (<65 vs. ≥65) | 2.82 | 0.004 | 1.40–5.90 |
| Gender (female vs. male) | 1.37 | 0.39 | 0.66–2.83 |
| Localization (left vs. right) | 0.84 | 0.61 | 0.42–1.65 |
| Stage (early vs. advanced) | 0.11 | <0.01 | 0.42–1.28 |
| HDL-C (mg/dL) | 0.34 | 0.006 | 0.16–0.74 |
| LDL-C (mg/dL) | 0.84 | 0.66 | 0.39–1.79 |
| TGs (mg/dL) | 1.02 | 0.94 | 0.51–2.04 |
| TC (mg/dL) | 1.20 | 0.59 | 0.60–2.41 |
| TGs/HDL-C | 1.00 | 0.98 | 0.52–1.93 |
| TC/HDL-C | 2.45 | 0.02 | 1.15–5.20 |
| CEA (<5 vs. ≥5) | 2.89 | 0.003 | 1.42–5.89 |
Table 7.
Multivariate analysis of parameters affecting overall survival using Cox regression analyses (HDL-C: high-density lipoprotein cholesterol, TC/HDL-C: total cholesterol/high-density lipoprotein cholesterol, CEA: carcinoembryonic antigen, HR: hazard ratio, CI: confidence interval).
Table 7.
Multivariate analysis of parameters affecting overall survival using Cox regression analyses (HDL-C: high-density lipoprotein cholesterol, TC/HDL-C: total cholesterol/high-density lipoprotein cholesterol, CEA: carcinoembryonic antigen, HR: hazard ratio, CI: confidence interval).
| | HR | p-Value | CI |
|---|
| Age (<65 vs. ≥65) | 2.24 | 0.002 | 1.11–4.53 |
| Stage (early vs. advanced) | 7.96 | <0.01 | 3.05–20.81 |
| HDL-C (mg/dL) | 0.38 | 0.01 | 0.17–0.81 |
| TC/HDL-C | 1.22 | 0.05 | 0.47–3.16 |
| CEA (<5 vs. ≥5) | 1.77 | 0.12 | 0.85–3.69 |


