
The Validity and Reliability of the Polish Version of the PedsQL™ Gastrointestinal Symptoms Module for Pediatric Patients (Aged 2–18)

 , , , , and
Abstract
1. Introduction
2. Materials and Methods
2.1. Questionnaire Design
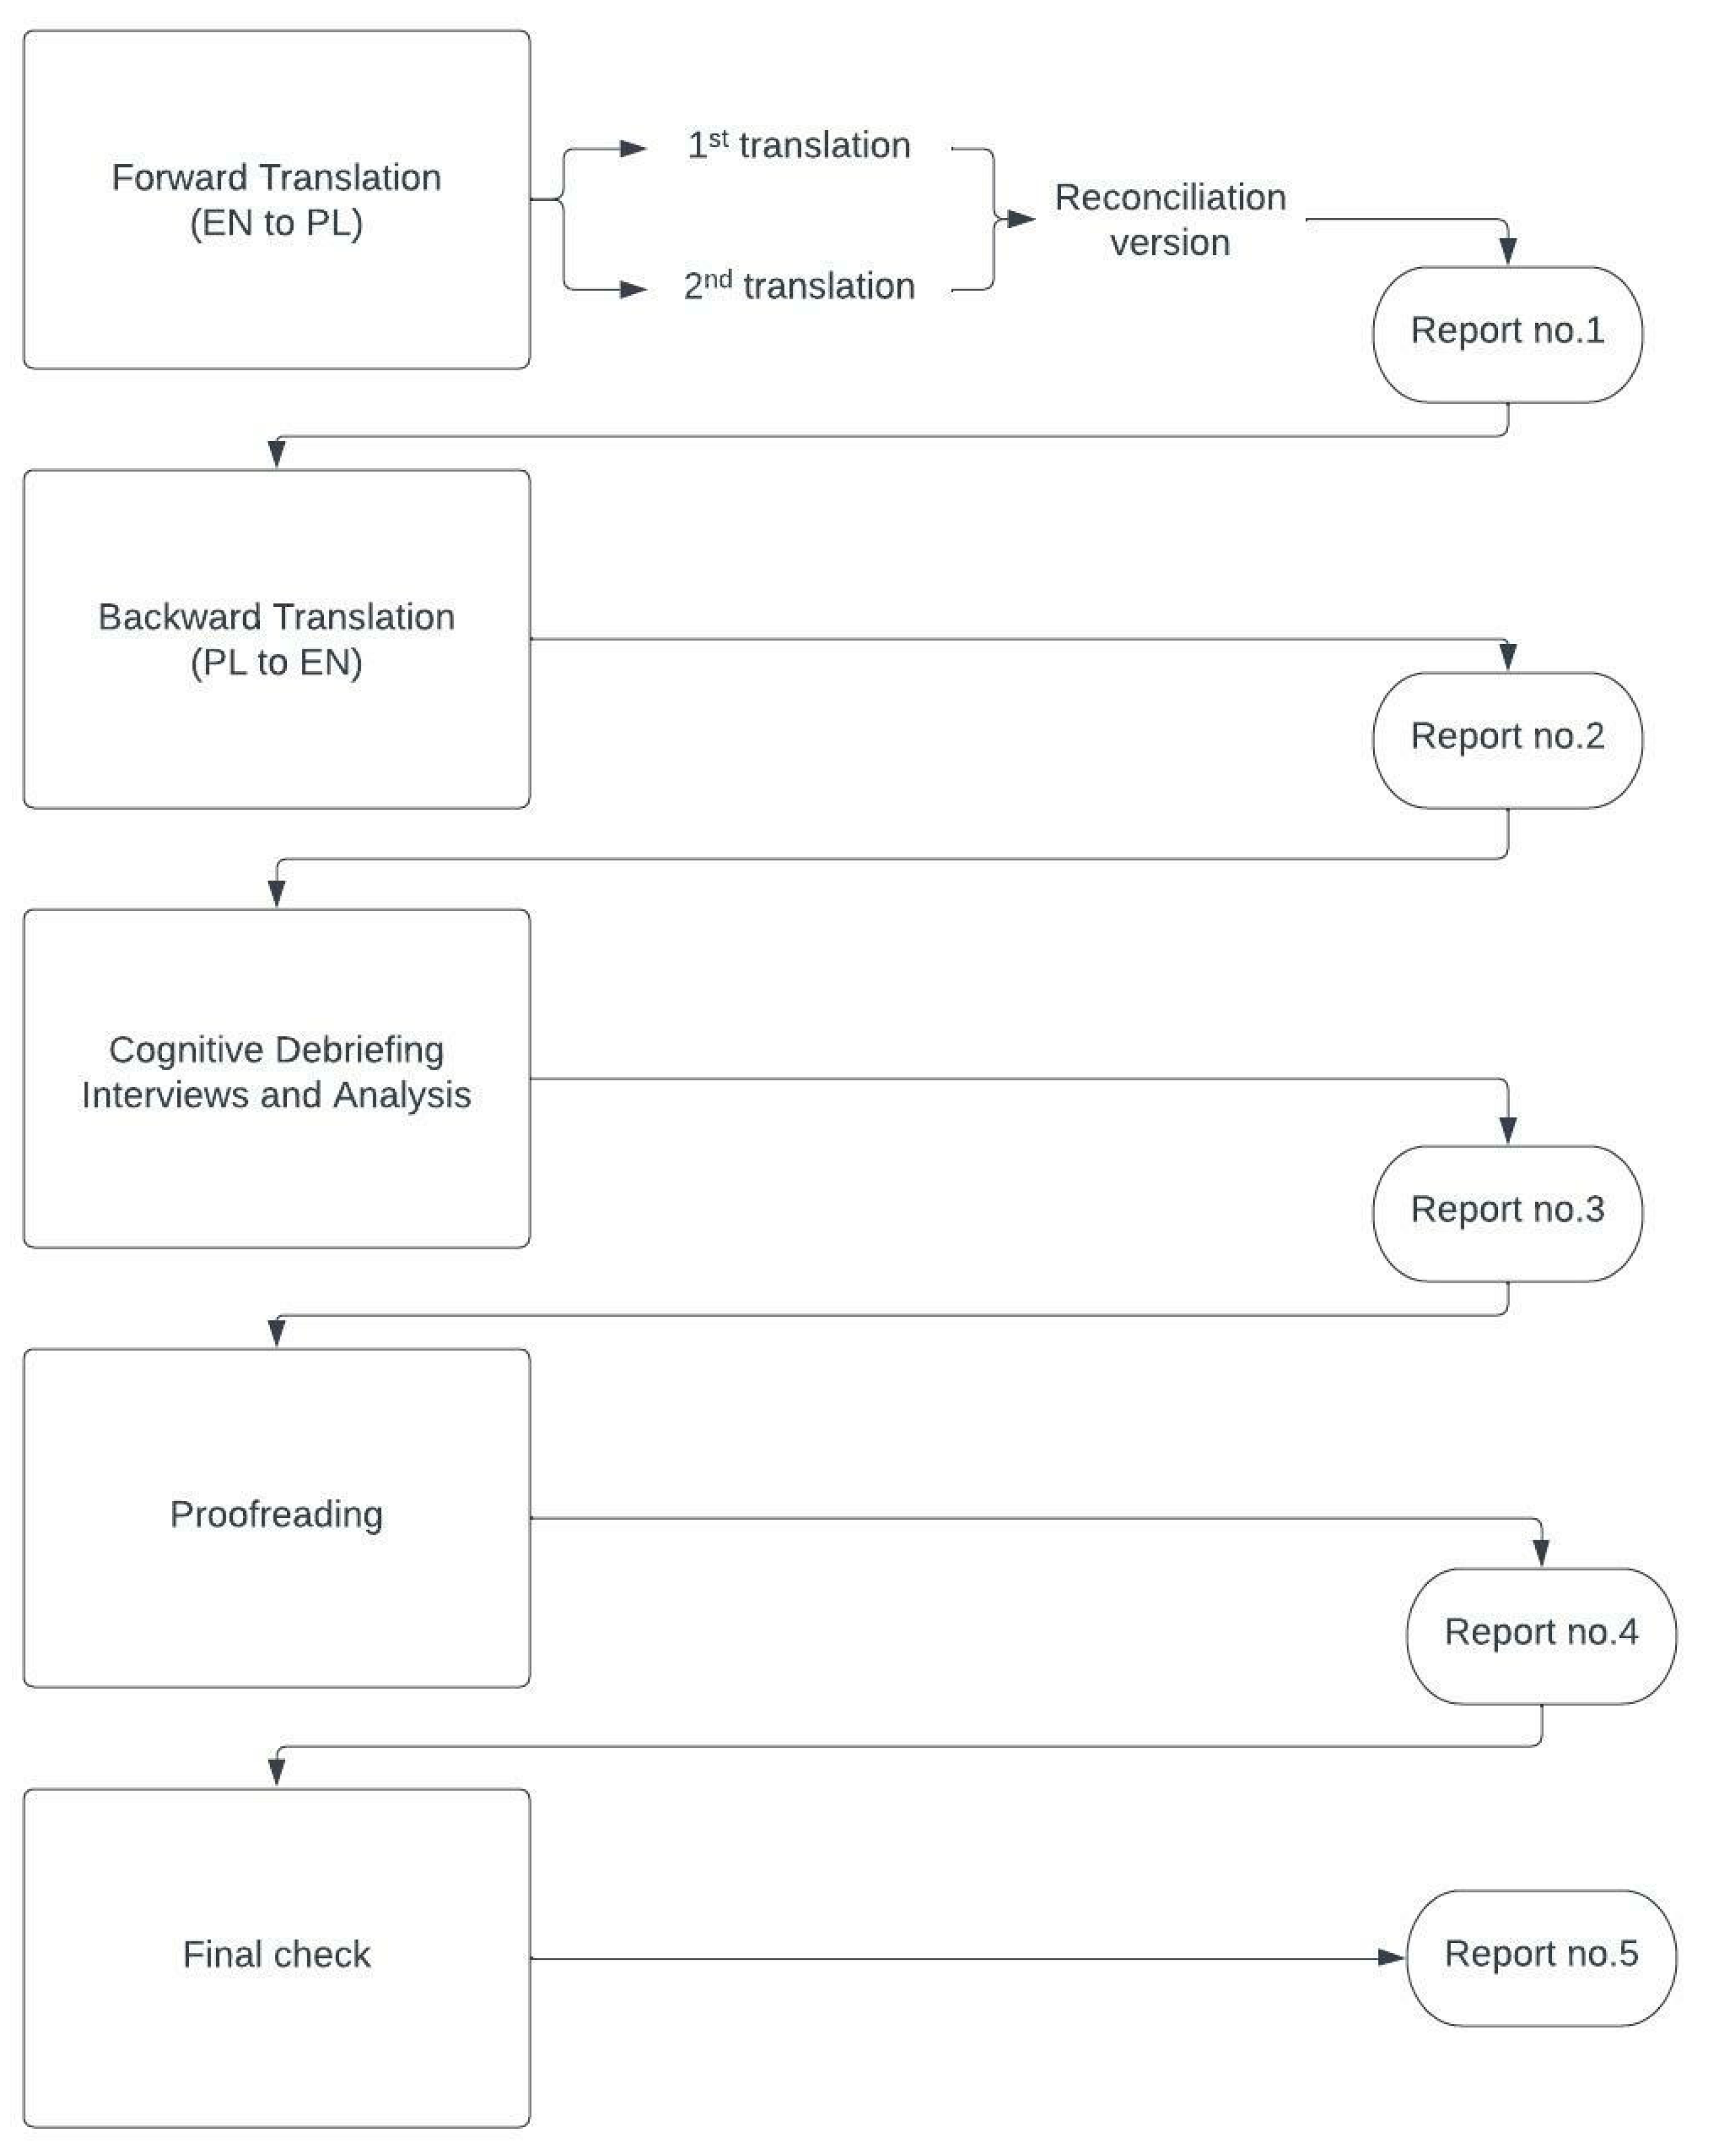
2.2. Linguistic Validity
2.3. Field Testing
2.4. Statistical Analysis
3. Results
3.1. General Characteristics
3.2. Factor Analysis
3.3. Comparison of Control and Exposed Groups
3.4. Internal Consistency
4. Discussion
5. Conclusions
Author Contributions
Funding
Institutional Review Board Statement
Informed Consent Statement
Data Availability Statement
Conflicts of Interest
Appendix A

| Item | Skewness | Kurtosis |
|---|---|---|
| I feel pain or hurt in my stomach | 0.03 | −0.97 |
| I get stomach aches | 0.02 | −1.03 |
| My stomach hurts | 0.07 | −0.97 |
| I wake up at night with stomach aches | 1.38 | 0.96 |
| I feel sick to my stomach | 0.78 | −0.57 |
| I get an upset stomach | 1.13 | 0.35 |
| When I eat I get sick to my stomach | 1.20 | 0.17 |
| When I eat my stomach feels bad | 1.25 | 0.69 |
| My stomach hurts when I eat | 1.36 | 0.79 |
| My stomach feels heavy when I eat | 1.30 | 0.64 |
| I feel full as soon as I start to eat | 1.10 | −0.01 |
| I cannot eat some foods | 0.60 | −1.00 |
| I cannot drink some drinks | 0.90 | −0.40 |
| I am not able to eat what I want | 0.98 | −0.29 |
| I am not able to drink what I want | 1.35 | 0.64 |
| I cannot eat some foods because they make me sick | 1.33 | 0.59 |
| I cannot eat the foods that my friends eat | 0.90 | −0.64 |
| It is hard for me to swallow food | 2.16 | 3.79 |
| It hurts when I swallow | 2.70 | 6.72 |
| Food gets stuck going down | 2.45 | 5.61 |
| I get a burning feeling in my throat | 1.99 | 3.52 |
| I have pain or hurt in my chest | 1.64 | 1.58 |
| I burp a lot | 1.05 | 0.07 |
| Food comes back up into my mouth after eating | 1.94 | 2.95 |
| I feel like throwing up | 0.71 | −0.55 |
| I feel like throwing up when I eat | 1.60 | 1.77 |
| I feel like throwing up after I eat | 1.20 | 0.33 |
| I throw up | 1.45 | 0.97 |
| My stomach feels full of gas | 0.56 | −0.93 |
| My stomach feels very full | 0.44 | −1.07 |
| My stomach gets big and hard | 0.74 | −0.71 |
| I have a lot of gas | 0.45 | −1.07 |
| I pass a lot of gas | 0.48 | −1.05 |
| My stomach feels gassy | 0.61 | −0.81 |
| My stomach makes noises | 0.41 | −0.90 |
| I still feel full after I poop | 1.13 | 0.10 |
| I feel like I am not done after I poop | 0.76 | −0.60 |
| I feel like I cannot get all the poop to come out | 0.63 | −0.78 |
| It hurts when I go poop | 0.85 | −0.41 |
| My poop is hard | 0.66 | −0.67 |
| My poop is lumpy | 0.94 | −0.23 |
| I have to push hard to poop | 0.71 | −0.70 |
| My poop gets stuck when I poop | 1.08 | −0.11 |
| My bottom hurts after I go poop | 1.21 | 0.37 |
| It takes a long time for poop to come out | 0.68 | −0.78 |
| I have to work hard to make poop come out | 0.79 | −0.72 |
| I do not want to poop because it hurts | 1.65 | 1.63 |
| I spend a lot of time on the toilet going poop | 0.75 | −0.71 |
| My stomach hurts when I go poop | 1.00 | −0.27 |
| There is blood on my toilet paper after I go poop | 1.96 | 2.73 |
| There is blood in my poop | 2.17 | 3.56 |
| I need to be near the bathroom a lot | 1.41 | 0.99 |
| I have to rush to the bathroom to poop | 1.22 | 0.41 |
| I feel like I am always in the bathroom going poop | 1.75 | 1.97 |
| I wake up at night to go poop | 1.81 | 2.40 |
| My poop is watery | 1.06 | −0.06 |
| I have poop accidents in my underwear | 1.13 | 0.15 |
| I have to go poop a lot | 1.39 | 1.16 |
| I worry about going poop in my pants | 1.53 | 1.23 |
| I worry that I will not make it to the bathroom in time | 1.42 | 1.16 |
| I worry that it will hurt when I go poop | 1.34 | 0.70 |
| I worry that I will have to use the bathroom at school | 1.01 | −0.23 |
| I worry that I will poop in my pants at school | 1.90 | 2.68 |
| I worry about my stomach aches | 0.66 | −0.97 |
| I worry that my stomach will hurt in school | 0.74 | −0.74 |
| It is hard for me to take my medicines | 1.60 | 1.58 |
| I forget to take my medicines | 1.49 | 1.50 |
| It is hard for me to swallow my medicines | 1.38 | 1.04 |
| I do not like having to take my medicines all the time | 1.21 | 0.06 |
| It is hard for me to tell the doctors and nurses how I feel | 0.87 | −0.48 |
| It is hard for me to ask the doctors and nurses questions | 0.85 | −0.51 |
| It is hard for me to explain my illness to other people | 0.62 | −0.88 |
| It is hard for me to explain my illness to my friends | 0.65 | −0.93 |
| It is hard for me to talk to my parents about my illness | 1.63 | 1.73 |
Appendix B
| Variable | Children | Parents | ||||||||||
|---|---|---|---|---|---|---|---|---|---|---|---|---|
| Control Group (n = 68) | Exposed Group (n = 100) | Control Group (n = 78) | Exposed Group (n = 125) | |||||||||
| As | K | p | As | K | p | As | K | p | As | K | p | |
| Stomach pain and hurt | 1.18 | 0.76 | <0.001 | −0.16 | −0.77 | 0.03 | 1.32 | 1.66 | <0.001 | 0.08 | −0.69 | <0.001 |
| Stomach discomfort when eating | 1.64 | 2.27 | <0.001 | 0.54 | −0.66 | <0.001 | 2.99 | 10.16 | <0.001 | 0.66 | −0.24 | <0.001 |
| Food and drink limits | 1.73 | 2.29 | <0.001 | 0.30 | −1.13 | <0.001 | 2.04 | 3.21 | <0.001 | 0.51 | −0.81 | <0.001 |
| Trouble swallowing | 2.67 | 6.97 | <0.001 | 1.56 | 1.31 | <0.001 | 2.78 | 7.16 | <0.001 | 2.11 | 3.88 | <0.001 |
| Heartburn and reflux | 1.43 | 1.51 | <0.001 | 0.89 | 0.13 | <0.001 | 3.57 | 17.08 | <0.001 | 1.30 | 1.46 | <0.001 |
| Nausea and vomiting | 1.56 | 1.84 | <0.001 | 0.57 | −0.30 | <0.001 | 2.82 | 8.82 | <0.001 | 0.88 | 0.13 | <0.001 |
| Gas and bloating | 1.21 | 1.11 | <0.001 | 0.22 | −0.95 | <0.001 | 1.89 | 3.53 | <0.001 | −0.22 | −0.93 | <0.001 |
| Constipation | 1.94 | 4.56 | <0.001 | 0.57 | −0.66 | <0.001 | 2.72 | 9.77 | <0.001 | 0.31 | −0.83 | <0.001 |
| Blood in bowel movement | 2.96 | 7.29 | <0.001 | 1.39 | 0.69 | <0.001 | 4.11 | 16.14 | <0.001 | 1.46 | 0.88 | <0.001 |
| Diarrhea | 1.91 | 3.45 | <0.001 | 0.95 | 0.08 | <0.001 | 2.43 | 6.03 | <0.001 | 1.09 | 0.48 | <0.001 |
| Worry about bowel movements | 2.07 | 5.56 | <0.001 | 0.73 | −0.48 | <0.001 | 1.91 | 3.34 | <0.001 | 1.04 | 0.24 | <0.001 |
| Worry about stomach aches | 1.71 | 2.24 | <0.001 | 0.01 | −1.28 | <0.001 | 2.31 | 5.13 | <0.001 | 0.32 | −1.15 | <0.001 |
| Medicine | 2.52 | 8.10 | <0.001 | 0.73 | 0.23 | <0.001 | 2.27 | 5.47 | <0.001 | 0.50 | −0.97 | <0.001 |
| Communication | 1.75 | 3.32 | <0.001 | 0.24 | −0.82 | <0.001 | 1.82 | 3.57 | <0.001 | 0.44 | −0.72 | <0.001 |
References
- Haverman, L.; Limperg, P.F.; Young, N.L.; Grootenhuis, M.A.; Klaassen, R.J. Paediatric health-related quality of life: What is it and why should we measure it? Arch. Dis. Child. 2017, 102, 393–400. [Google Scholar] [CrossRef]
- van Tilburg, M.A.; Murphy, T.B. Quality of life paradox in gastrointestinal disorders. J. Pediatr. 2015, 166, 11–14. [Google Scholar] [CrossRef] [PubMed]
- The World Health Organization Quality of Life assessment (WHOQOL): Position paper from the World Health Organization. Soc. Sci. Med. 1995, 41, 1403–1409. [CrossRef]
- de Wit, M.; Hajos, T. Health-Related Quality of Life. In Encyclopedia of Behavioral Medicine; Gellman, M.D., Turner, J.R., Eds.; Springer: New York, NY, USA, 2013. [Google Scholar] [CrossRef]
- Ravens-Sieberer, U.; Gosch, A.; Rajmil, L.; Erhart, M.; Bruil, J.; Duer, W.; Auquier, P.; Power, M.; Abel, T.; Czemy, L.; et al. KIDSCREEN-52 quality-of-life measure for children and adolescents. Expert Rev. Pharmacoeconomics Outcomes Res. 2005, 5, 353–364. [Google Scholar] [CrossRef]
- Mizerska-Wasiak, M.; Adamczuk, D.; Cichoń-Kawa, K.; Miklaszewska, M.; Szymanik-Grzelak, H.; Pietrzyk, J.A.; Pukajło-Marczyk, A.; Zwolińska, D.; Rybi-Szumińska, A.; Wasilewska, A.; et al. Health-related quality of life in children with immunoglobulin A nephropathy—Results of a multicentre national study. Arch. Med Sci. 2021, 17, 84–91. [Google Scholar] [CrossRef]
- Rozensztrauch, A.; Śmigiel, R.; Patkowski, D.; Gerus, S.; Kłaniewska, M.; Quitmann, J.H.; Dellenmark-Blom, M. Reliability and Validity of the Polish Version of the Esophageal-Atresia-Quality-of-Life Questionnaires to Assess Condition-Specific Quality of Life in Children and Adolescents Born with Esophageal Atresia. Int. J. Environ. Res. Public Health 2022, 19, 8047. [Google Scholar] [CrossRef]
- Stelmach, I.; Podlecka, D.; Majak, P.; Jerzyńska, J.; Stelmach, R.; Janas, A.; Krakowiak, J.; Stelmach, W. Validity of the Pediatric Asthma Quality of Life Questionnaire in Polish children. Pediatr. Allergy Immunol. 2011, 22, 660–666. [Google Scholar] [CrossRef]
- Varni, J.W.; Seid, M.; Knight, T.S.; Uzark, K.; Szer, I.S. The PedsQL 4.0 Generic Core Scales: Sensitivity, responsiveness, and impact on clinical decision-making. J. Behav. Med. 2002, 25, 175–193. [Google Scholar] [CrossRef]
- Kaczmarek, M.; Trambacz-Oleszak, S. HRQoL impact of stressful life events in children beginning primary school: Results of a prospective study in Poland. Qual. Life Res. 2017, 26, 95–106. [Google Scholar] [CrossRef] [PubMed] [PubMed Central]
- Zielinska-Wieniawska, A.; Bielecki, M.; Wolanczyk, T.; Kruk, M.; Marczynska, M.; Srebnicki, T.; Brynska, A. Health-related quality of life in Polish children and adolescents with perinatal HIV infection—A short report. AIDS Care 2020, 32, 1393–1399. [Google Scholar] [CrossRef]
- Kwiatkowska, K.; Milczarek, O.; Dębicka, M.; Baliga, Z.; Maryniak, A.; Kwiatkowski, S. The health-related quality of life in children with arachnoid cysts. Clinical predictors and parent-child perspectives. J. Neurosurg. Sci. 2022, 66, 200–207. [Google Scholar] [CrossRef] [PubMed]
- Varni, J.W.; Bendo, C.B.; Shulman, R.J.; Self, M.M.; Nurko, S.; Franciosi, J.P.; Saps, M.; Saeed, S.; Zacur, G.M.; Dark, C.V.; et al. Interpretability of the PedsQL™ Gastrointestinal Symptoms Scales and Gastrointestinal Worry Scales in Pediatric Patients with Functional and Organic Gastrointestinal Diseases. J. Pediatr. Psychol. 2015, 40, 591–601. [Google Scholar] [CrossRef] [PubMed]
- Varni, J.W.; Bendo, C.B.; Denham, J.; Shulman, R.J.; Self, M.M.; Neigut, D.A.; Nurko, S.; Patel, A.S.; Franciosi, J.P.; Saps, M.; et al. PedsQL gastrointestinal symptoms module: Feasibility, reliability, and validity. J. Pediatr. Gastroenterol. Nutr. 2014, 59, 347–355. [Google Scholar] [CrossRef] [PubMed]
- U.S. Department of Health and Human Services FDA Center for Drug Evaluation and Research; U.S. Department of Health and Human Services FDA Center for Biologics Evaluation and Research; U.S. Department of Health and Human Services FDA Center for Devices and Radiological Health. Guidance for industry: Patient-reported outcome measures: Use in medical product development to support labeling claims: Draft guidance. Health Qual Life Outcomes 2006, 4, 79. [Google Scholar] [CrossRef]
- Acquadro, C.; Conway, K.; Giroudet, C.; Mear, I. Linguistic Validation Manual for Health Outcome Assessments; Mapi Institute: Seoul, Republic of Korea, 2012. [Google Scholar]
- Watkins, M.W. A Step-by-Step Guide to Exploratory Factor Analysis with SPSS; Routledge: London, UK, 2021. [Google Scholar]
- Dash, G.; Paul, J. CB-SEM vs PLS-SEM methods for research in social sciences and technology forecasting. Technol. Forecast. Soc. Chang. 2021, 173, 121092. [Google Scholar] [CrossRef]
- Fornell, C.; Larcker, D.F. Evaluating structural equation models with unobservable variables and measurement error. J. Mark. Res. 1981, 18, 39–50. [Google Scholar] [CrossRef]
- Bräutigam, M.; Abrahamsson, K.; Gatzinsky, V.; Saalman, R.; Hadi, L.; Nilsson, S.; Dellenmark-Blom, M. The Swedish PedsQL gastrointestinal symptoms scale and symptoms module showed good psychometric performance. Acta Paediatr. 2024, 113, 2564–2572. [Google Scholar] [CrossRef]
- Terwee, C.B.; Bot, S.D.; de Boer, M.R.; van der Windt, D.A.; Knol, D.L.; Dekker, J.; Bouter, L.M.; de Vet, H.C. Quality criteria were proposed for measurement properties of health status questionnaires. J. Clin. Epidemiol. 2007, 60, 34–42. [Google Scholar] [CrossRef]
- Hartman, E.E.; Pawaskar, M.; Williams, V.; McLeod, L.; Dubois, D.; Benninga, M.A.; Joseph, A. Psychometric properties of PedsQL generic core scales for children with functional constipation in the Netherlands. J. Pediatr. Gastroenterol. Nutr. 2014, 59, 739–747. [Google Scholar] [CrossRef]
- Boon, M.; Claes, I.; Havermans, T.; Fornés-Ferrer, V.; Calvo-Lerma, J.; Asseiceira, I.; Bulfamante, A.; Garriga, M.; Masip, E.; Woodcock, S.; et al. Assessing gastro-intestinal related quality of life in cystic fibrosis: Validation of PedsQL GI in children and their parents. PLoS ONE 2019, 14, e0225004. [Google Scholar] [CrossRef]
- Varni, J.W.; Kay, M.T.; Limbers, C.A.; Franciosi, J.P.; Pohl, J.F. PedsQL gastrointestinal symptoms module item development: Qualitative methods. J. Pediatr. Gastroenterol. Nutr. 2012, 54, 664–671. [Google Scholar] [CrossRef] [PubMed]
- Wild, D.; Eremenco, S.; Mear, I.; Martin, M.; Houchin, C.; Gawlicki, M.; Hareendran, A.; Wiklund, I.; Chong, L.Y.; von Maltzahn, R.; et al. Multinational trials-recommendations on the translations required, approaches to using the same language in different countries, and the approaches to support pooling the data: The ISPOR Patient-Reported Outcomes Translation and Linguistic Validation Good Research Practices Task Force report. Value Health 2009, 12, 430–440. [Google Scholar] [CrossRef]
- García, A.A. Cognitive interviews to test and refine questionnaires. Public Health Nurs. 2011, 28, 444–450. [Google Scholar] [CrossRef] [PubMed]
- eProvide. Pediatric Quality of Life InventoryTM (PedsQLTM). 2024. Available online: https://eprovide.mapi-trust.org/instruments/pediatric-quality-of-life-inventory (accessed on 9 February 2025).
- Varni, J.W.; Franciosi, J.P.; Shulman, R.J.; Saeed, S.; Nurko, S.; Neigut, D.A.; Bendo, C.B.; Patel, A.S.; Self, M.M.; Saps, M.; et al. PedsQL gastrointestinal symptoms scales and gastrointestinal worry scales in pediatric patients with inflammatory bowel disease in comparison with healthy controls. Inflamm. Bowel Dis. 2015, 21, 1115–1124. [Google Scholar] [CrossRef]
- Varni, J.W.; Bendo, C.B.; Denham, J.; Shulman, R.J.; Self, M.M.; Neigut, D.A.; Nurko, S.; Patel, A.S.; Franciosi, J.P.; Saps, M.; et al. PedsQL™ Gastrointestinal Symptoms Scales and Gastrointestinal Worry Scales in pediatric patients with functional and organic gastrointestinal diseases in comparison to healthy controls. Qual. Life Res. 2015, 24, 363–378. [Google Scholar] [CrossRef]
| Exposed | Control | p-Value | |
|---|---|---|---|
| Children | |||
| Count | 100 (59.5) | 68 (40.5) | - |
| Mean age of children | 10.8 (10.0–11.6) | 11.5 (10.6–12.4) | 0.284 |
| Child’s sex: male | 44.0 (44.0) | 35.0 (51.5) | 0.427 |
| Child’s sex: female | 56.0 (56.0) | 33.0 (48.5) | |
| Parent’s sex: male | 16.0 (16.0) | 5.0 (7.4) | 0.154 |
| Parent’s sex: female | 84.0 (84.0) | 63.0 (92.6) | |
| Education of parent: higher | 45.0 (45.0) | 35.0 (51.5) | 0.708 |
| Education of parent: secondary | 34.0 (34.0) | 22.0 (32.4) | |
| Education of parent: primary | 1.0 (1.0) | 0.0 (0.0) | |
| Education of parent: vocational | 20.0 (20.0) | 11.0 (16.2) | |
| Parents | |||
| Count | 125 (61.6) | 78 (38.4) | - |
| Mean age of children | 9.2 (8.4–10.1) | 10.5 (9.5–11.5) | 0.082 |
| Child’s sex: male | 56.0 (44.8) | 42.0 (53.8) | 0.267 |
| Child’s sex: female | 69.0 (55.2) | 36.0 (46.2) | |
| Parent’s sex: male | 18.0 (14.4) | 5.0 (6.4) | 0.129 |
| Parent’s sex: female | 107.0 (85.6) | 73.0 (93.6) | |
| Education of parent: higher | 59.0 (47.2) | 40.0 (51.3) | 0.791 |
| Education of parent: secondary | 42.0 (33.6) | 26.0 (33.3) | |
| Education of parent: primary | 1.0 (0.8) | 0.0 (0.0) | |
| Education of parent: vocational | 23.0 (18.4) | 12.0 (15.4) | |
| Factor | Item | Factor Loading | AVE | CR |
|---|---|---|---|---|
| Stomach pain and hurt | I feel pain or hurt in my stomach | 0.87 * | 0.67 | 0.93 |
| I get stomach aches | 0.87 * | |||
| My stomach hurts | 0.82 * | |||
| I wake up at night with stomach aches | 0.79 * | |||
| I feel sick to my stomach | 0.70 * | |||
| I get an upset stomach | 0.87 * | |||
| Stomach discomfort when eating | When I eat I get sick to my stomach | 0.64 * | 0.63 | 0.89 |
| When I eat my stomach feels bad | 0.84 * | |||
| My stomach hurts when I eat | 0.80 * | |||
| My stomach feels heavy when I eat | 0.87 * | |||
| I feel full as soon as I start to eat | 0.79 * | |||
| Food and drink limits | I cannot eat some foods | 0.44 * | 0.62 | 0.90 |
| I cannot drink some drinks | 0.55 * | |||
| I am not able to eat what I want | 0.62 * | |||
| I am not able to drink what I want | 0.98 * | |||
| I cannot eat some foods because they make me sick | 0.98 * | |||
| I cannot eat the foods that my friends eat | 0.95 * | |||
| Trouble swallowing | It is hard for me to swallow food | 0.84 * | 0.63 | 0.84 |
| It hurts when I swallow | 0.79 * | |||
| Food gets stuck going down | 0.76 * | |||
| Heartburn and reflux | I get a burning feeling in my throat | 0.53 * | 0.66 | 0.88 |
| I have pain or hurt in my chest | 0.95 * | |||
| I burp a lot | 0.86 * | |||
| Food comes back up into my mouth after eating | 0.85 * | |||
| Nausea and vomiting | I feel like throwing up | 0.77 * | 0.48 | 0.78 |
| I feel like throwing up when I eat | 0.62 * | |||
| I feel like throwing up after I eat | 0.68 * | |||
| I throw up | 0.69 * | |||
| Gas and bloating | My stomach feels full of gas | 0.73 * | 0.67 | 0.93 |
| My stomach feels very full | 0.84 * | |||
| My stomach gets big and hard | 0.84 * | |||
| I have a lot of gas | 0.90 * | |||
| I pass a lot of gas | 0.75 * | |||
| My stomach feels gassy | 0.79 * | |||
| My stomach makes noises | 0.88 * | |||
| Constipation | I still feel full after I poop | 0.70 * | 0.65 | 0.96 |
| I feel like I am not done after I poop | 0.81 * | |||
| I feel like I cannot get all the poop to come out | 0.84 * | |||
| It hurts when I go poop | 0.84 * | |||
| My poop is hard | 0.79 * | |||
| My poop is lumpy | 0.78 * | |||
| I have to push hard to poop | 0.87 * | |||
| My poop gets stuck when I poop | 0.84 * | |||
| My bottom hurts after I go poop | 0.74 * | |||
| It takes a long time for poop to come out | 0.86 * | |||
| I have to work hard to make poop come out | 0.87 * | |||
| I do not want to poop because it hurts | 0.69 * | |||
| I spend a lot of time on the toilet going poop | 0.82 * | |||
| My stomach hurts when I go poop | 0.79 * | |||
| Blood in bowel movement | There is blood on my toilet paper after I go poop | 0.89 * | 0.86 | 0.92 |
| There is blood in my poop | 0.96 * | |||
| Diarrhea | I need to be near the bathroom a lot | 0.85 * | 0.63 | 0.92 |
| I have to rush to the bathroom to poop | 0.86 * | |||
| I feel like I am always in the bathroom going poop | 0.82 * | |||
| I wake up at night to go poop | 0.77 * | |||
| My poop is watery | 0.77 * | |||
| I have poop accidents in my underwear | 0.64 * | |||
| I have to go poop a lot | 0.83 * | |||
| Worry about bowel movements | I worry about going poop in my pants | 0.91 * | 0.58 | 0.87 |
| I worry that I will not make it to the bathroom in time | 0.91 * | |||
| I worry that it will hurt when I go poop | 0.57 * | |||
| I worry that I will have to use the bathroom at school | 0.57 * | |||
| I worry that I will poop in my pants at school | 0.77 * | |||
| Worry about stomach aches | I worry about my stomach aches | 0.94 * | 0.90 | 0.95 |
| I worry that my stomach will hurt in school | 0.96 * | |||
| Medicine | It is hard for me to take my medicines | 0.83 * | 0.47 | 0.76 |
| I forget to take my medicines | 0.36 * | |||
| It is hard for me to swallow my medicines | 0.84 * | |||
| I do not like having to take my medicines all the time | 0.61 * | |||
| Communication | It is hard for me to tell the doctors and nurses how I feel | 0.73 * | 0.61 | 0.89 |
| It is hard for me to ask the doctors and nurses questions | 0.69 * | |||
| It is hard for me to explain my illness to other people | 0.96 * | |||
| It is hard for me to explain my illness to my friends | 0.87 * | |||
| It is hard for me to talk to my parents about my illness | 0.61 * |
| 1 | 2 | 3 | 4 | 5 | 6 | 7 | 8 | 9 | 10 | 11 | 12 | 13 | 14 | |
|---|---|---|---|---|---|---|---|---|---|---|---|---|---|---|
| 1. Stomach pain and hurt | 0.67 | |||||||||||||
| 2. Stomach discomfort when eating | 0.38 | 0.63 | ||||||||||||
| 3. Food and drink limits | 0.28 | 0.38 | 0.62 | |||||||||||
| 4. Trouble swallowing | 0.20 | 0.38 | 0.08 | 0.63 | ||||||||||
| 5. Heartburn and reflux | 0.26 | 0.63 | 0.33 | 0.34 | 0.66 | |||||||||
| 6. Nausea and vomiting | 0.27 | 0.42 | 0.18 | 0.46 | 0.43 | 0.48 | ||||||||
| 7. Gas and bloating | 0.22 | 0.40 | 0.36 | 0.16 | 0.36 | 0.24 | 0.67 | |||||||
| 8. Constipation | 0.23 | 0.28 | 0.24 | 0.21 | 0.17 | 0.22 | 0.42 | 0.65 | ||||||
| 9. Blood in bowel movement | 0.04 | 0.02 | 0.10 | 0.00 | 0.01 | 0.01 | 0.06 | 0.13 | 0.86 | |||||
| 10. Diarrhea | 0.05 | 0.11 | 0.15 | 0.02 | 0.13 | 0.02 | 0.23 | 0.09 | 0.22 | 0.63 | ||||
| 11. Worry about bowel movements | 0.04 | 0.04 | 0.09 | 0.02 | 0.04 | 0.01 | 0.19 | 0.17 | 0.18 | 0.56 | 0.58 | |||
| 12. Worry about stomach aches | 0.19 | 0.42 | 0.37 | 0.11 | 0.30 | 0.18 | 0.29 | 0.24 | 0.12 | 0.19 | 0.20 | 0.90 | ||
| 13. Medicine | 0.11 | 0.07 | 0.07 | 0.07 | 0.08 | 0.05 | 0.05 | 0.07 | 0.03 | 0.07 | 0.07 | 0.09 | 0.47 | |
| 14. Communication | 0.18 | 0.22 | 0.19 | 0.14 | 0.17 | 0.11 | 0.09 | 0.17 | 0.04 | 0.05 | 0.09 | 0.26 | 0.17 | 0.61 |
| Dependent Variable | Children | Z | p | r | |||||
|---|---|---|---|---|---|---|---|---|---|
| Control Group (n = 68) | Exposed Group (n = 100) | ||||||||
| Average Rank | Mdn | IQR | Average Rank | Mdn | IQR | ||||
| Stomach pain and hurt | 52.40 | 5.50 | 8.00 | 106.33 | 0.00 | 2.00 | −7.07 | <0.001 | 0.55 |
| Stomach discomfort when eating | 54.42 | 8.00 | 13.00 | 104.96 | 0.00 | 3.75 | −6.73 | <0.001 | 0.52 |
| Food and drink limits | 56.03 | 0.00 | 2.00 | 103.86 | 0.00 | 0.00 | −6.39 | <0.001 | 0.49 |
| Trouble swallowing | 70.26 | 3.00 | 6.00 | 94.19 | 0.50 | 2.00 | −3.66 | <0.001 | 0.28 |
| Heartburn and reflux | 66.12 | 4.50 | 7.00 | 97.00 | 0.00 | 2.75 | −4.16 | <0.001 | 0.32 |
| Nausea and vomiting | 57.66 | 12.00 | 12.50 | 102.75 | 3.00 | 7.75 | −6.06 | <0.001 | 0.47 |
| Gas and bloating | 54.60 | 17.50 | 25.50 | 104.84 | 4.00 | 11.00 | −6.58 | <0.001 | 0.51 |
| Constipation | 55.68 | 0.00 | 3.00 | 104.10 | 0.00 | 0.00 | −6.35 | <0.001 | 0.49 |
| Blood in bowel movement | 69.34 | 5.50 | 9.00 | 94.81 | 1.00 | 3.00 | −4.28 | <0.001 | 0.33 |
| Diarrhea | 59.62 | 4.00 | 9.75 | 101.42 | 0.50 | 4.00 | −5.53 | <0.001 | 0.43 |
| Worry about bowel movements | 64.32 | 4.00 | 5.75 | 98.22 | 0.00 | 2.00 | −4.54 | <0.001 | 0.35 |
| Worry about stomach aches | 59.42 | 3.50 | 6.00 | 101.56 | 0.00 | 2.00 | −5.69 | <0.001 | 0.44 |
| Medicine | 64.60 | 8.00 | 9.00 | 98.03 | 1.00 | 4.75 | −4.53 | <0.001 | 0.35 |
| Communication | 59.38 | 0.00 | 0.00 | 101.58 | 0.00 | 0.00 | −5.61 | <0.001 | 0.43 |
| Parents | |||||||||
| Control group (n = 78) | Exposed group (n = 125) | ||||||||
| Stomach pain and hurt | 59.40 | 0.00 | 1.00 | 128.58 | 5.00 | 8.50 | −8.18 | <0.001 | 0.57 |
| Stomach discomfort when eating | 64.62 | 0.00 | 2.00 | 125.32 | 7.00 | 12.00 | −7.49 | <0.001 | 0.53 |
| Food and drink limits | 68.76 | 0.00 | 0.00 | 122.74 | 0.00 | 2.00 | −6.51 | <0.001 | 0.46 |
| Trouble swallowing | 84.87 | 0.00 | 1.00 | 112.69 | 2.00 | 6.00 | −3.93 | <0.001 | 0.28 |
| Heartburn and reflux | 73.26 | 0.00 | 1.00 | 119.94 | 3.00 | 6.50 | −5.76 | <0.001 | 0.40 |
| Nausea and vomiting | 71.28 | 1.00 | 4.25 | 121.17 | 14.00 | 12.00 | −6.13 | <0.001 | 0.43 |
| Gas and bloating | 58.27 | 3.00 | 7.00 | 129.29 | 20.00 | 23.50 | −8.41 | <0.001 | 0.59 |
| Constipation | 62.37 | 0.00 | 0.00 | 126.73 | 0.00 | 2.00 | −7.61 | <0.001 | 0.53 |
| Blood in bowel movement | 80.01 | 0.00 | 2.00 | 115.72 | 5.00 | 9.00 | −5.39 | <0.001 | 0.38 |
| Diarrhea | 67.25 | 0.00 | 2.00 | 123.68 | 4.00 | 7.00 | −6.78 | <0.001 | 0.48 |
| Worry about bowel movements | 73.57 | 0.00 | 1.00 | 119.74 | 3.00 | 5.50 | −5.62 | <0.001 | 0.39 |
| Worry about stomach aches | 70.06 | 0.00 | 2.00 | 121.93 | 3.00 | 6.00 | −6.47 | <0.001 | 0.45 |
| Medicine | 80.22 | 0.00 | 4.25 | 115.59 | 7.00 | 9.00 | −4.42 | <0.001 | 0.31 |
| Communication | 71.17 | 0.00 | 0.00 | 121.24 | 0.00 | 0.00 | −6.04 | <0.001 | 0.42 |
| Parents | ||
|---|---|---|
| Children | Spearman’s rho | p |
| Stomach pain and hurt | 0.88 | <0.001 |
| Stomach discomfort when eating | 0.80 | <0.001 |
| Food and drink limits | 0.78 | <0.001 |
| Trouble swallowing | 0.68 | <0.001 |
| Heartburn and reflux | 0.70 | <0.001 |
| Nausea and vomiting | 0.87 | <0.001 |
| Gas and bloating | 0.79 | <0.001 |
| Constipation | 0.89 | <0.001 |
| Blood in bowel movement | 0.84 | <0.001 |
| Diarrhea | 0.82 | <0.001 |
| Worry about bowel movements | 0.79 | <0.001 |
| Worry about stomach aches | 0.72 | <0.001 |
| Medicine | 0.69 | <0.001 |
| Communication | 0.74 | <0.001 |
| Variable | Children | Parents | |||
|---|---|---|---|---|---|
| Control Group (n = 68) | Exposed Group (n = 100) | Control Group (n = 78) | Exposed Group (n = 125) | ||
| Stomach pain and hurt | 0.18 | 0.27 | 0.19 | 0.25 | |
| Stomach discomfort when eating | −0.12 | −0.05 | −0.11 | −0.01 | |
| Food and drink limits | −0.02 | 0.07 | 0.00 | 0.07 | |
| Trouble swallowing | −0.06 | −0.15 | 0.00 | −0.17 | |
| Heartburn and reflux | 0.12 | 0.14 | 0.02 | 0.22 | |
| Nausea and vomiting | −0.11 | −0.10 | −0.06 | −0.22 | |
| Gas and bloating | 0.10 | 0.13 | 0.05 | 0.21 | |
| Constipation | 0.00 | 0.03 | 0.01 | 0.05 | |
| Blood in bowel movement | −0.15 | 0.07 | −0.11 | 0.13 | |
| Diarrhea | 0.03 | 0.14 | 0.03 | 0.18 | |
| Worry about bowel movements | 0.01 | −0.05 | −0.01 | −0.20 | |
| Worry about stomach aches | −0.07 | −0.19 | −0.04 | 0.08 | |
| Medicine | 0.11 | 0.16 | 0.10 | 0.16 | |
| Communication | 0.07 | 0.19 | 0.08 | 0.24 | |
| Constant | −1.38 | −4.46 | −1.30 | −5.41 | |
| Classification results | Control group | 60 (88.2%) | 8 (11.8%) | 70 (89.7%) | 8 (10.3%) |
| Criterion group | 22 (22.0%) | 78 (78.0%) | 21 (16.8%) | 104 (83.2%) | |
| Cronbach’s Alpha | Children | Parents | ||
|---|---|---|---|---|
| Exposed | Control | Exposed | Control | |
| Stomach pain and hurt | 0.859 (0.853–0.864) | 0.89 (0.887–0.893) | 0.847 (0.841–0.853) | 0.89 (0.886–0.895) |
| Stomach discomfort when eating | 0.834 (0.819–0.849) | 0.715 (0.701–0.73) | 0.854 (0.844–0.865) | 0.544 (0.459–0.63) |
| Food and drink limits | 0.879 (0.865–0.893) | 0.821 (0.809–0.833) | 0.929 (0.925–0.933) | 0.792 (0.748–0.836) |
| Trouble swallowing | 0.802 (0.791–0.812) | 0.354 (0.268–0.441) | 0.831 (0.808–0.855) | 0.526 (0.466–0.587) |
| Heartburn and reflux | 0.748 (0.731–0.765) | 0.563 (0.557–0.57) | 0.78 (0.768–0.792) | 0.34 (0.21–0.471) |
| Nausea and vomiting | 0.845 (0.832–0.859) | 0.801 (0.794–0.808) | 0.863 (0.85–0.876) | 0.864 (0.855–0.873) |
| Gas and bloating | 0.891 (0.884–0.898) | 0.868 (0.862–0.873) | 0.918 (0.915–0.922) | 0.919 (0.912–0.926) |
| Constipation | 0.947 (0.942–0.953) | 0.932 (0.928–0.936) | 0.954 (0.952–0.956) | 0.937 (0.932–0.943) |
| Blood in bowel movement | 0.901 (0.878–0.924) | 0.333 (0.191–0.474) | 0.897 (0.881–0.914) | 0.070 (0.010–0.120) |
| Diarrhea | 0.911 (0.908–0.915) | 0.718 (0.678–0.758) | 0.917 (0.913–0.921) | 0.807 (0.793–0.821) |
| Worry about bowel movements | 0.852 (0.848–0.857) | 0.786 (0.758–0.813) | 0.854 (0.844–0.865) | 0.717 (0.704–0.729) |
| Worry about stomach aches | 0.959 (0.956–0.961) | 0.892 (0.885–0.9) | 0.902 (0.891–0.913) | 0.773 (0.703–0.844) |
| Medicine | 0.649 (0.63–0.668) | 0.676 (0.648–0.705) | 0.718 (0.705–0.732) | 0.848 (0.835–0.861) |
| Communication | 0.876 (0.869–0.884) | 0.783 (0.748–0.817) | 0.898 (0.889–0.906) | 0.832 (0.811–0.853) |
| All questions | 0.946 (0.94–0.952) | 0.951 (0.947–0.955) | 0.931 (0.925–0.937) | 0.953 (0.95–0.956) |
Disclaimer/Publisher’s Note: The statements, opinions and data contained in all publications are solely those of the individual author(s) and contributor(s) and not of MDPI and/or the editor(s). MDPI and/or the editor(s) disclaim responsibility for any injury to people or property resulting from any ideas, methods, instructions or products referred to in the content. |
© 2025 by the authors. Licensee MDPI, Basel, Switzerland. This article is an open access article distributed under the terms and conditions of the Creative Commons Attribution (CC BY) license (https://creativecommons.org/licenses/by/4.0/).
Share and Cite
Leszkowicz, J.; Kasprowicz-Janisz, M.; Kotarska, A.; Nazar, W.; Dettlaff-Dunowska, M.; Napora, J.; Mazurek, T.; Plata-Nazar, K.; Szlagatys-Sidorkiewicz, A. The Validity and Reliability of the Polish Version of the PedsQL™ Gastrointestinal Symptoms Module for Pediatric Patients (Aged 2–18). J. Clin. Med. 2025, 14, 1227. https://doi.org/10.3390/jcm14041227
Leszkowicz J, Kasprowicz-Janisz M, Kotarska A, Nazar W, Dettlaff-Dunowska M, Napora J, Mazurek T, Plata-Nazar K, Szlagatys-Sidorkiewicz A. The Validity and Reliability of the Polish Version of the PedsQL™ Gastrointestinal Symptoms Module for Pediatric Patients (Aged 2–18). Journal of Clinical Medicine. 2025; 14(4):1227. https://doi.org/10.3390/jcm14041227
Chicago/Turabian StyleLeszkowicz, Julia, Małgorzata Kasprowicz-Janisz, Anna Kotarska, Wojciech Nazar, Magdalena Dettlaff-Dunowska, Justyna Napora, Tomasz Mazurek, Katarzyna Plata-Nazar, and Agnieszka Szlagatys-Sidorkiewicz. 2025. "The Validity and Reliability of the Polish Version of the PedsQL™ Gastrointestinal Symptoms Module for Pediatric Patients (Aged 2–18)" Journal of Clinical Medicine 14, no. 4: 1227. https://doi.org/10.3390/jcm14041227
APA StyleLeszkowicz, J., Kasprowicz-Janisz, M., Kotarska, A., Nazar, W., Dettlaff-Dunowska, M., Napora, J., Mazurek, T., Plata-Nazar, K., & Szlagatys-Sidorkiewicz, A. (2025). The Validity and Reliability of the Polish Version of the PedsQL™ Gastrointestinal Symptoms Module for Pediatric Patients (Aged 2–18). Journal of Clinical Medicine, 14(4), 1227. https://doi.org/10.3390/jcm14041227