Article

Opportunistic Osteoporosis Assessment and Fracture Risk Determination Using Cancellous Density Measurement in Hounsfield Units of Native Lumbar Computed Tomography Images—A Comparative Study with Conventional Bone Density Evaluation

1
Division of Trauma Surgery, Department of Orthopaedics and Trauma Surgery, Medical University of Vienna, Währinger Gürtel 18-20, 1090 Vienna, Austria
2
Department of Traumatology, Hand and Reconstructive Surgery, Rostock University Medical Center, Schillingallee 35, 18057 Rostock, Germany
3
Institute for Diagnostic and Interventional Radiology/Neuroradiology, Westkuestenklinikum Heide, Academic Teaching Hospital of the Universities of Kiel, Luebeck und Hamburg, Esmarchstraße 50, 25746 Heide, Germany
*
Author to whom correspondence should be addressed.
J. Clin. Med. 2025, 14(4), 1226; https://doi.org/10.3390/jcm14041226
Submission received: 3 January 2025 / Revised: 31 January 2025 / Accepted: 9 February 2025 / Published: 13 February 2025
(This article belongs to the Section Orthopedics)

Abstract

:
Background/Objectives: Osteoporosis is a global problem that will increase as the population increases and ages, requiring prevention, early detection, and appropriate treatment. An increasing loss in bone mineral density (BMD) is the hallmark of osteoporosis, leading to an increased risk for insufficiency fractures. We aimed to investigate and analyze the applicability of native lumbar spine computed tomography (CT) scans for the evaluation of bone density compared with standard bone density measurements with quantitative computed tomography (QCT) and computed tomography X-ray absorptiometry of the hip (CTXA). Methods: Patients who were referred to our institution for diagnostic investigations and underwent CT imaging of the lumbar spine, as well as standard osteoporosis assessments including QCT and CTXA, were included in the study, resulting in a total of 240 patients (mean age: 65.9 years, range: 24–91). An ANOVA test was used to compare patient groups without a fracture, with one fracture, with more than one fracture, and with additional sacral fractures. An ROC analysis was performed to assess the predictive power of fracture risk estimation considering HU, QCT, and CTXA values. Results: At least one fracture was detected in 42.9% of these patients. For the lumbar spine, the median HU was 89.9 (range 67.9–126.9) and the median BMD was 73.7 (range 57.1–104.2) mg/cm3. With a correlation coefficient of 0.98 (p < 0.001), the HU values obtained from native lumbar CT scans can be calculated using the following formula: BMDspine = 0.84 + (0.81 × HU). With HU values < 80 and a BMD of the lumbar spine < 66 mg/cm3, a significantly increased number of osteoporotic vertebral fractures were found in the mid-thoracic, thoracolumbar, and sacral regions with an effect size of 0.89. In 32 patients (13.3%), additional sacral fractures were found; these patients showed the lowest density values with a median HU value of 31.8 (12.7–58.2). An ROC analysis of HU revealed a 93% sensitivity for the coincidence of a vertebral fracture. There was no significant difference compared with the AUC of QCT (p = 0.395) for concomitant vertebral body fractures. CTXA values also allowed for risk assessment but showed a significantly lower AUC. We found a negative correlation of BMD with age and a positive correlation of BMD with body mass index. Conclusions: Cancellous density measurements in HU values can be effectively converted into quantitative BMD values in mg/cm3, enabling a reliable assessment of osteoporosis severity and fracture risk prediction. Further quantitative density evaluation of the hip does not add value to fracture risk assessment for the axial skeleton. Based on this study’s findings, using HU values in native CT of the lumbar spine alone offers a viable, opportunistic approach towards fracture risk evaluation of the spine.

1. Introduction

An increasing loss in bone mineral density (BMD) with subsequent degradation of the microarchitecture leads to osteoporosis and insufficiency fractures of the axial skeleton [1]. Every year, there are >1.4 million cases of clinically conspicuous osteoporotic vertebral fractures (OVFs) worldwide [2]. In terms of epidemiology, OVFs are the most common osteoporotic fractures, occurring in 30–50% of the population over the age of 50 [3]. Patients who have suffered an OVF have an up to five times higher risk of suffering another vertebral fracture within the next year [4]. In the long term, these fractures minimize quality of life and increase mortality [5,6].
Risk factors for OVFs include prior fragility fractures, advanced age, female sex, vitamin D deficiency, rheumatoid arthritis, corticosteroid treatment, immobilization, low body mass index (BMI), excessive alcohol consumption, nicotine abuse, and other secondary causes of osteoporosis [4,5,6,7,8,9,10,11,12,13]. The distribution of fractures in the axial skeleton shows a peak frequency in the mid-thoracic and thoracolumbar region [14], whereby the curvatures of the spine in the sagittal plane are of biomechanical significance [15]. Even with manifest osteoporosis, insufficiency fractures in the cervical section are rarely found due to their distinct microarchitecture and relatively high density; a fracture threshold value does not appear to be undercut here [16]. On the other hand, with increasing severity of osteoporosis, more insufficiency fractures are found in the sacral section [17]. Dual-energy X-ray absorptiometry (DEXA) was considered the gold standard for determining bone density and identifying osteoporosis [18], whereby a T-score of lower than −2.5 is defined as osteoporosis [19]. Alternatively, quantitative computed tomography (QCT) can also be used to determine the BMD while measuring the cancellous bone in the lumbar spine; here, a BMD < 80 mg/cm3 is defined as osteoporosis [20,21]. With computed tomography X-ray absorptiometry of the hip (CTXA), DEXA-equivalent values can be reliably determined [22].
The extent to which it is possible to estimate the severity of osteoporosis and the fracture risk in the spine by determining density in Hounsfield units (HU) should be examined in comparison with the QCT and CTXA hip data.

2. Materials and Methods

2.1. Study Design

This study includes a retrospectively examined patient population.

2.2. Patient Population

There were a total of 240 patients with an ⌀-age of 65.9 (min.: 24; max.: 91) years and a body mass index (BMI) of 26.7 kg/m2 (min.: 17.6; max.: 60.6), including 40 men with an ⌀-age of 68.5 (min.: 42; max.: 84) years and a BMI of 24.9 kg/m2 (min.: 17.6; max.: 33.8) and 200 women with an ⌀-age of 65.3 (min.: 24; max.: 91) years and a BMI of 27.1 kg/m2 (min.: 17.7; max.: 60.6), with the question of presence of osteoporosis (Table 1). The patients were assigned from outpatient clinics for bariatric surgery, gynecology, geriatrics, neurosurgery, orthopedics, and traumatology.

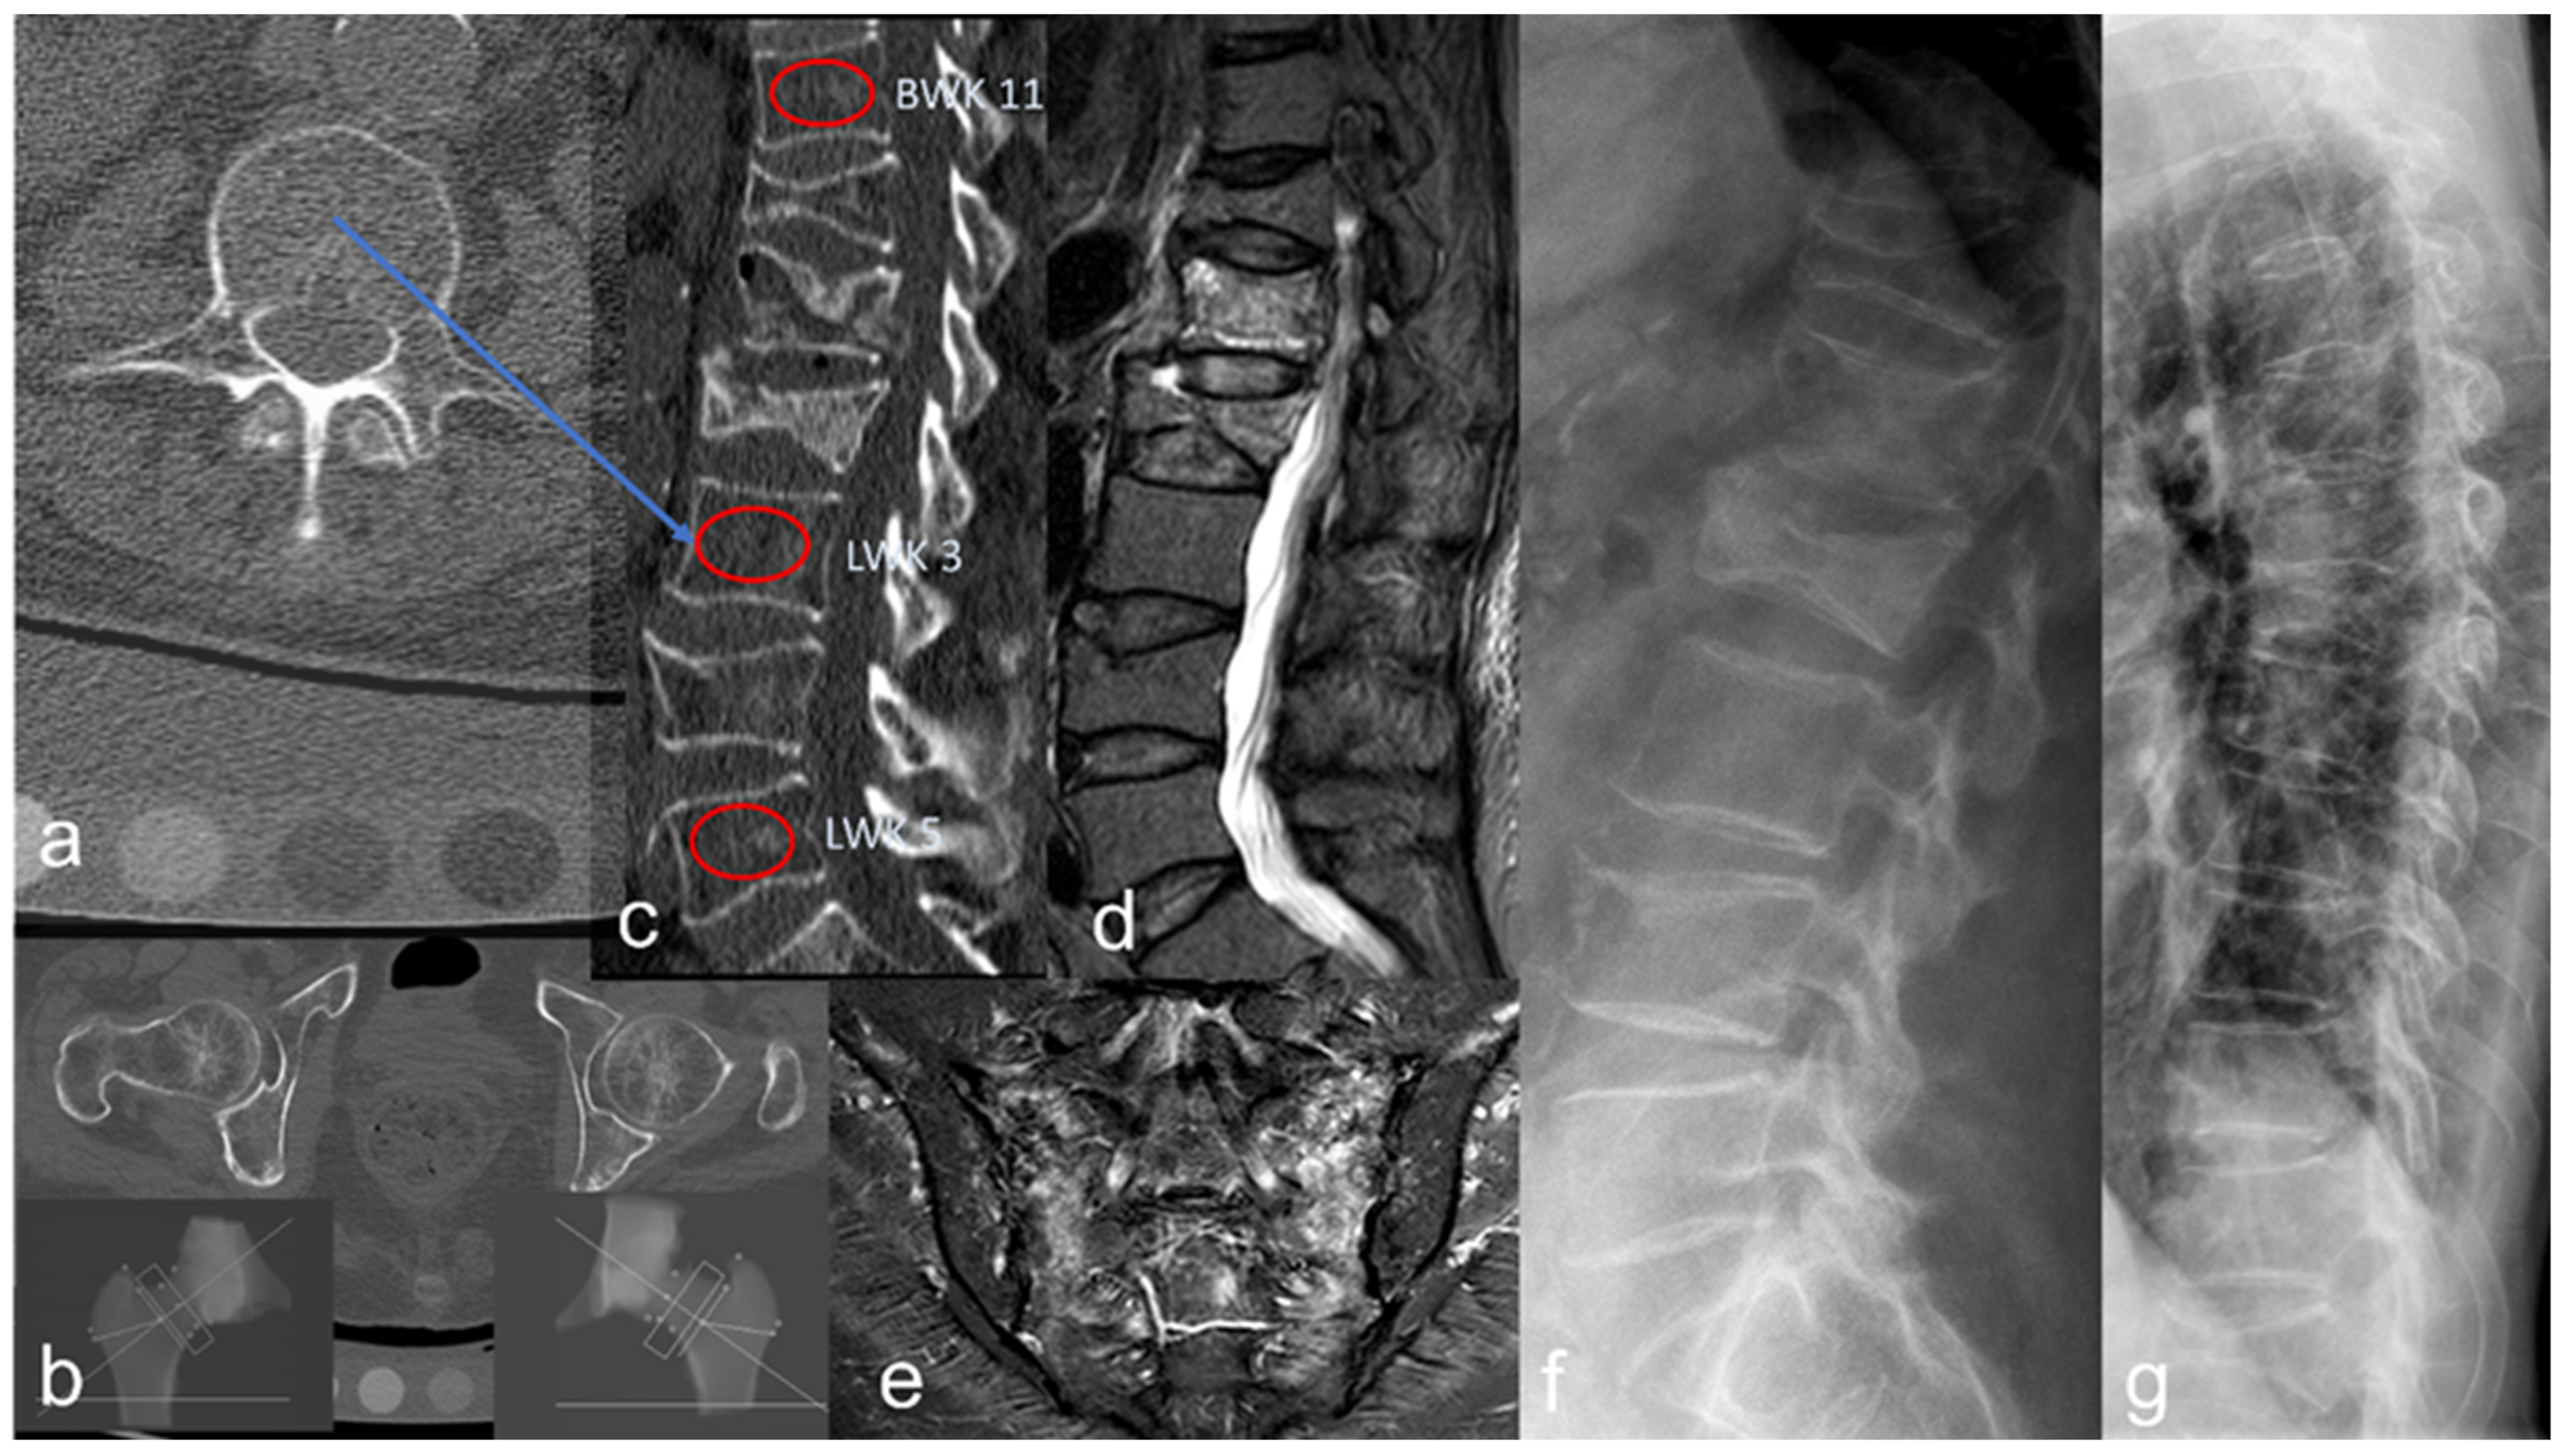
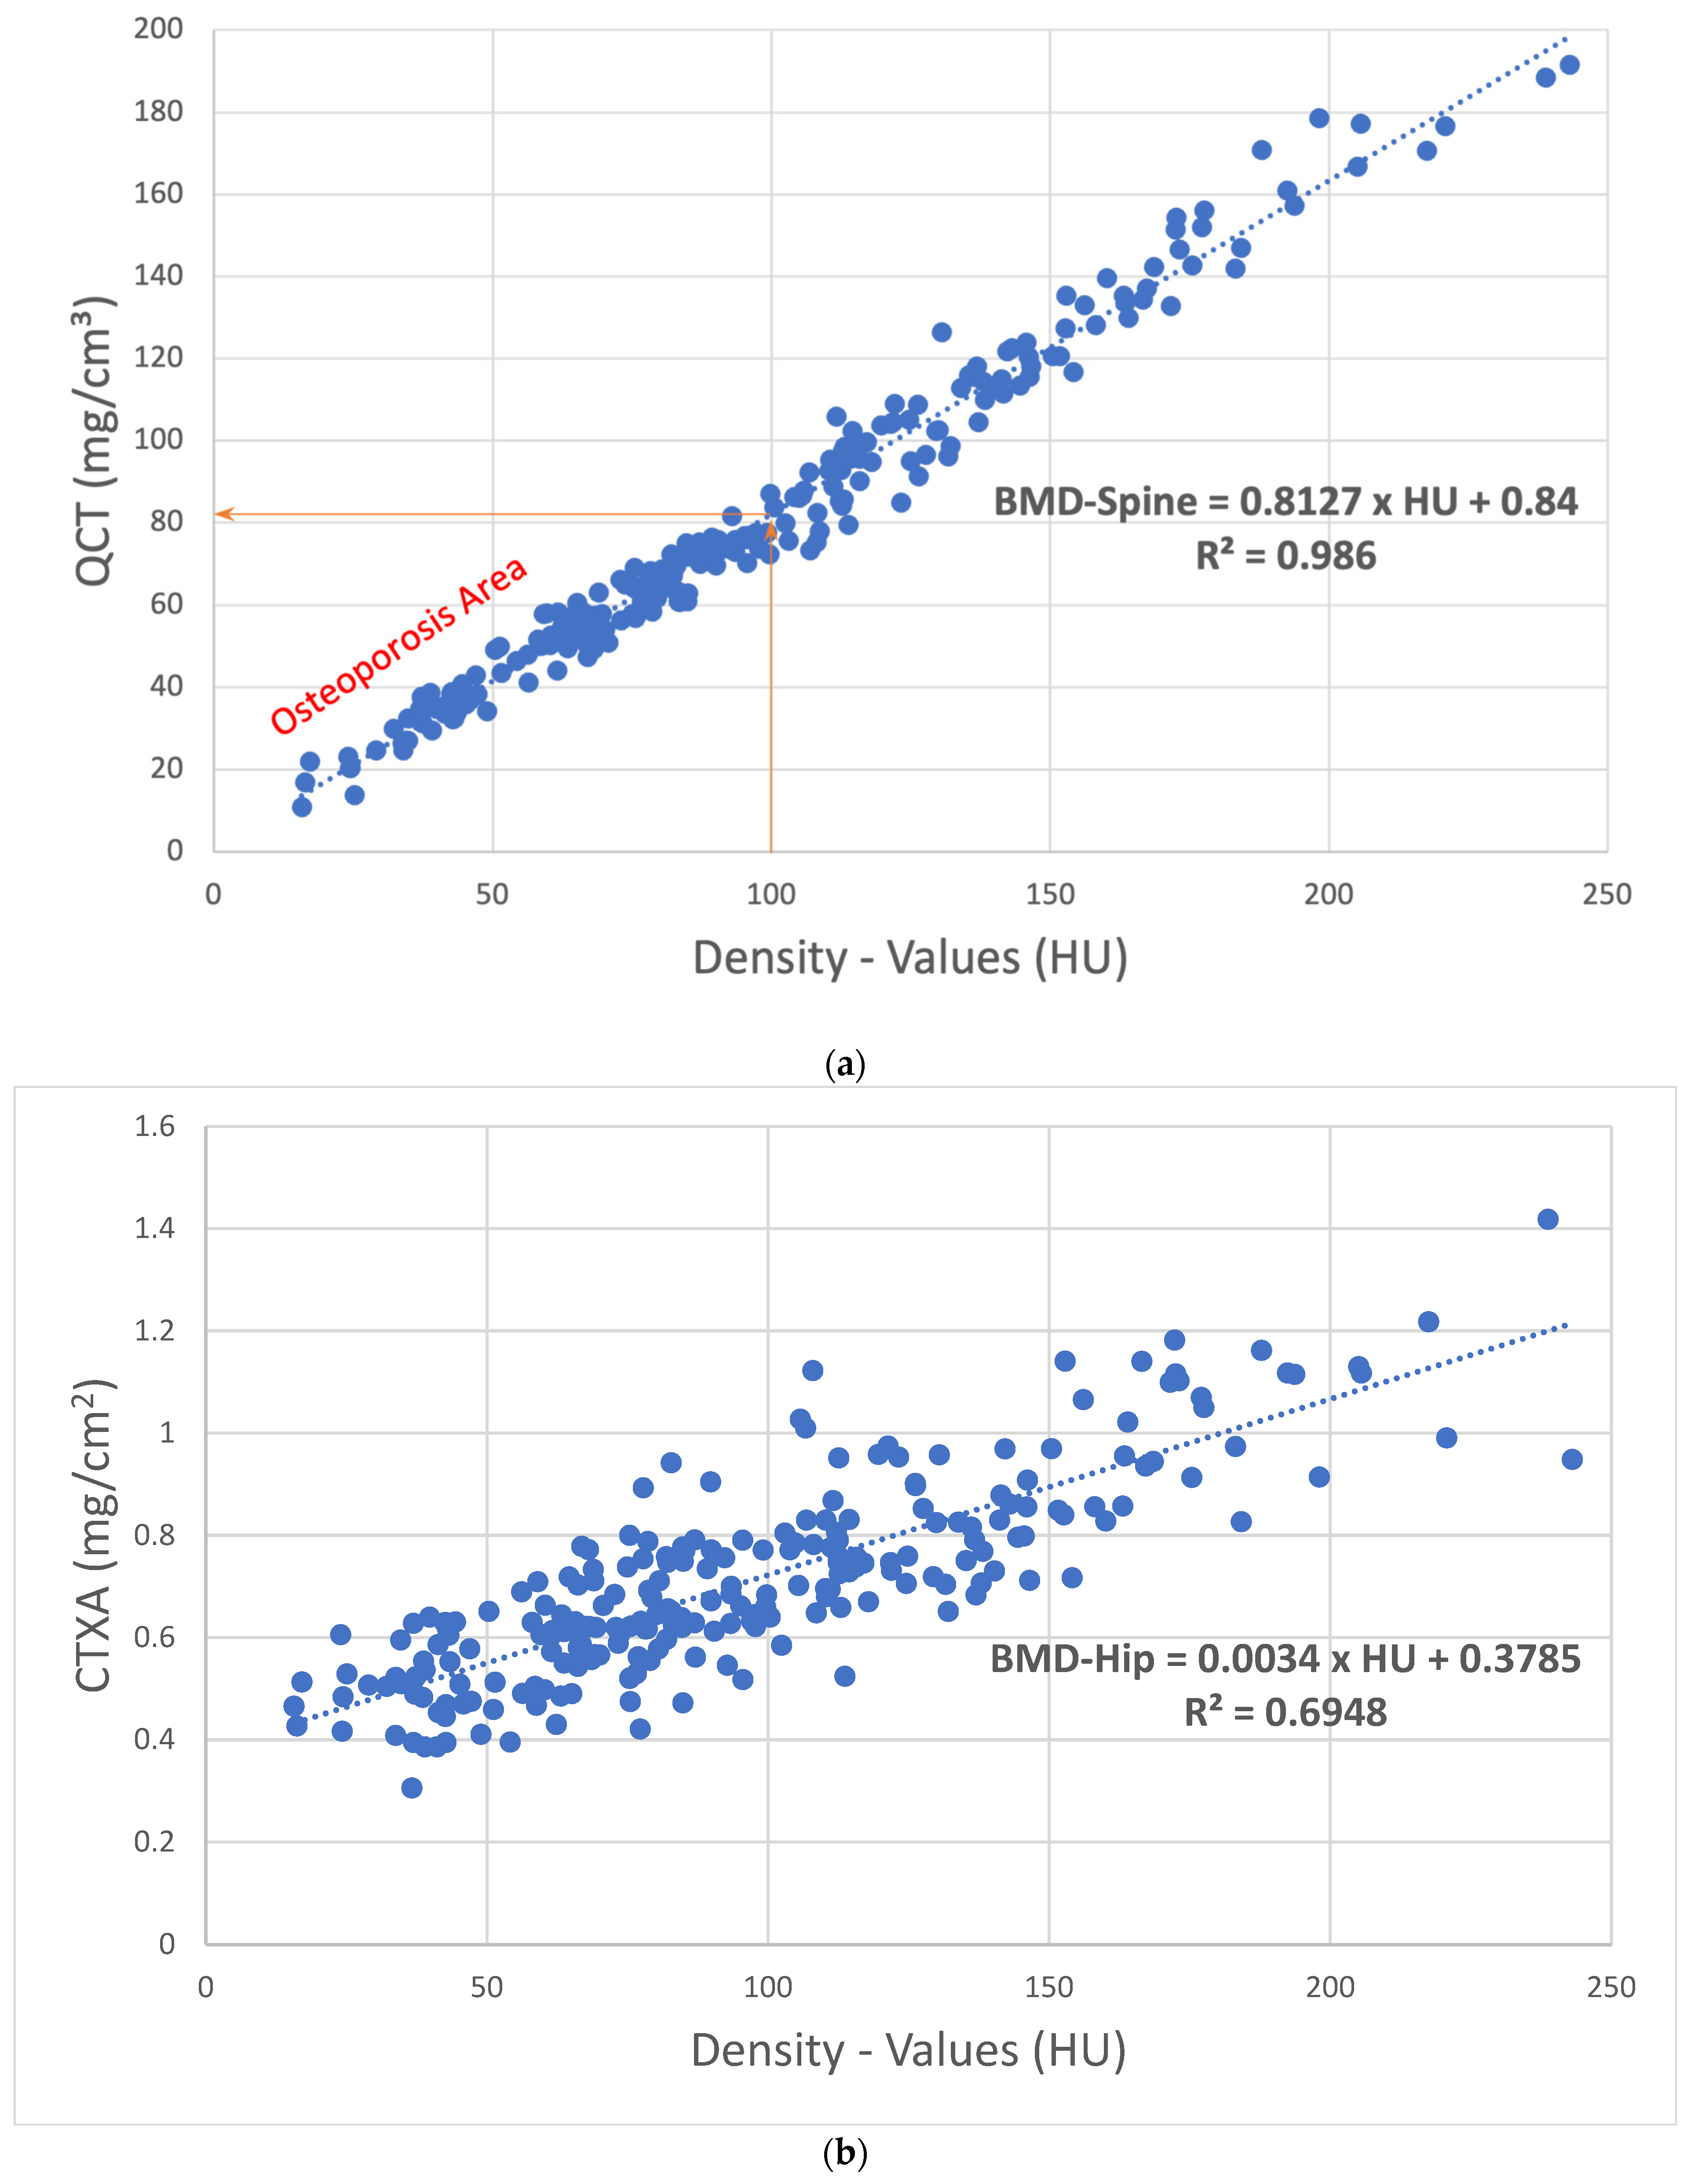
2.3. Bone Density Analysis

The BMD was determined in mg/cm3 using QCT (GE-Revolution EVO/64 line CT and Mindways Software: 4.2.3, 3D Volumetric QCT Spine, Austin, TX, USA) in the vertebral bodies L 1, L 2, and L 3. After anonymization, an additional measurement of the cancellous bone density in HU was performed in the same vertebral bodies (720 vertebral bodies in total), in each case using an ellipsoid ROI manually positioned in the mid-vertebral cancellous space in the sagittally reformed CT segment, with a layer thickness of 2 mm and a window setting of C = 400/W = 1600 (Figure 1). In the presence of a pronounced degenerative vertebral body deformity, fracture, endospondylophyte, or hemangioma at the level of L 1, L 2, or L 3, an adjacent vertebral body was used for QCT and HU determination.
In addition, a BMD determination of the hip in mg/cm2 was performed using CTXA (Mindways software, CTXA, which uses the volumetric CT data set, Austin, TX, USA), and the corresponding T-score values were also included.
Mindways software is used worldwide and has the advantage where BMD can be evaluated independently of the CT type and specific company software.

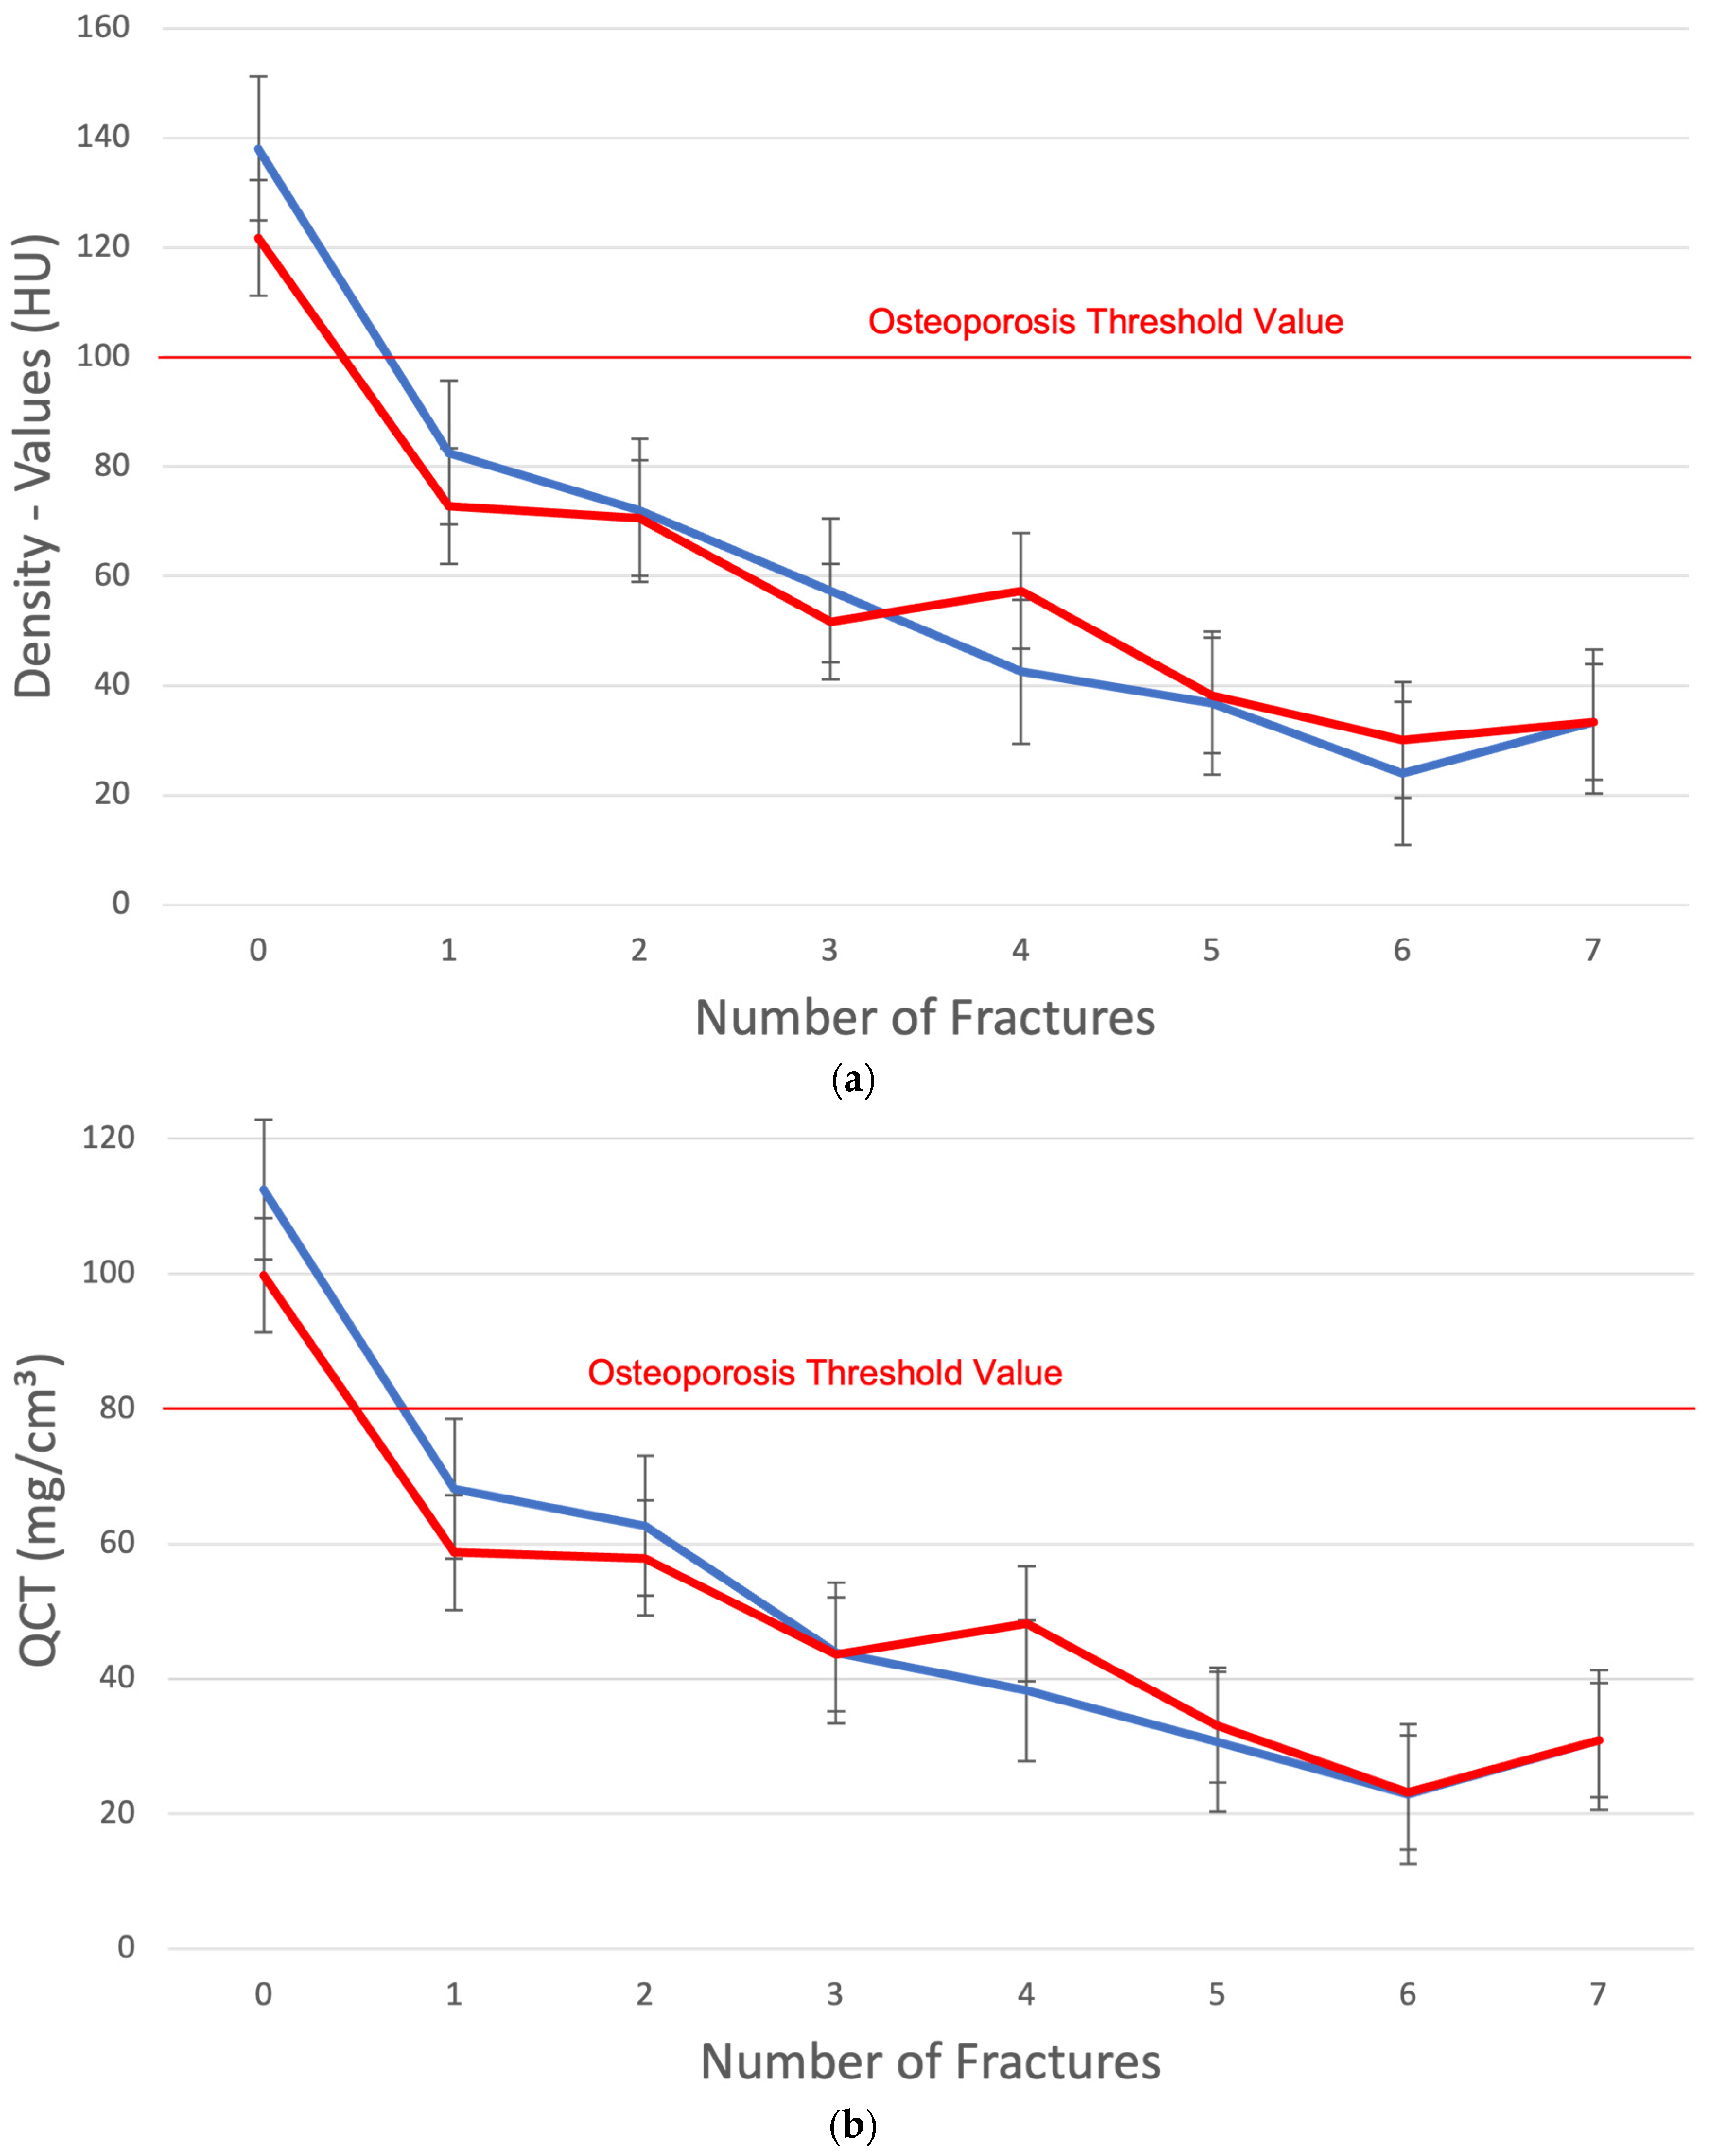
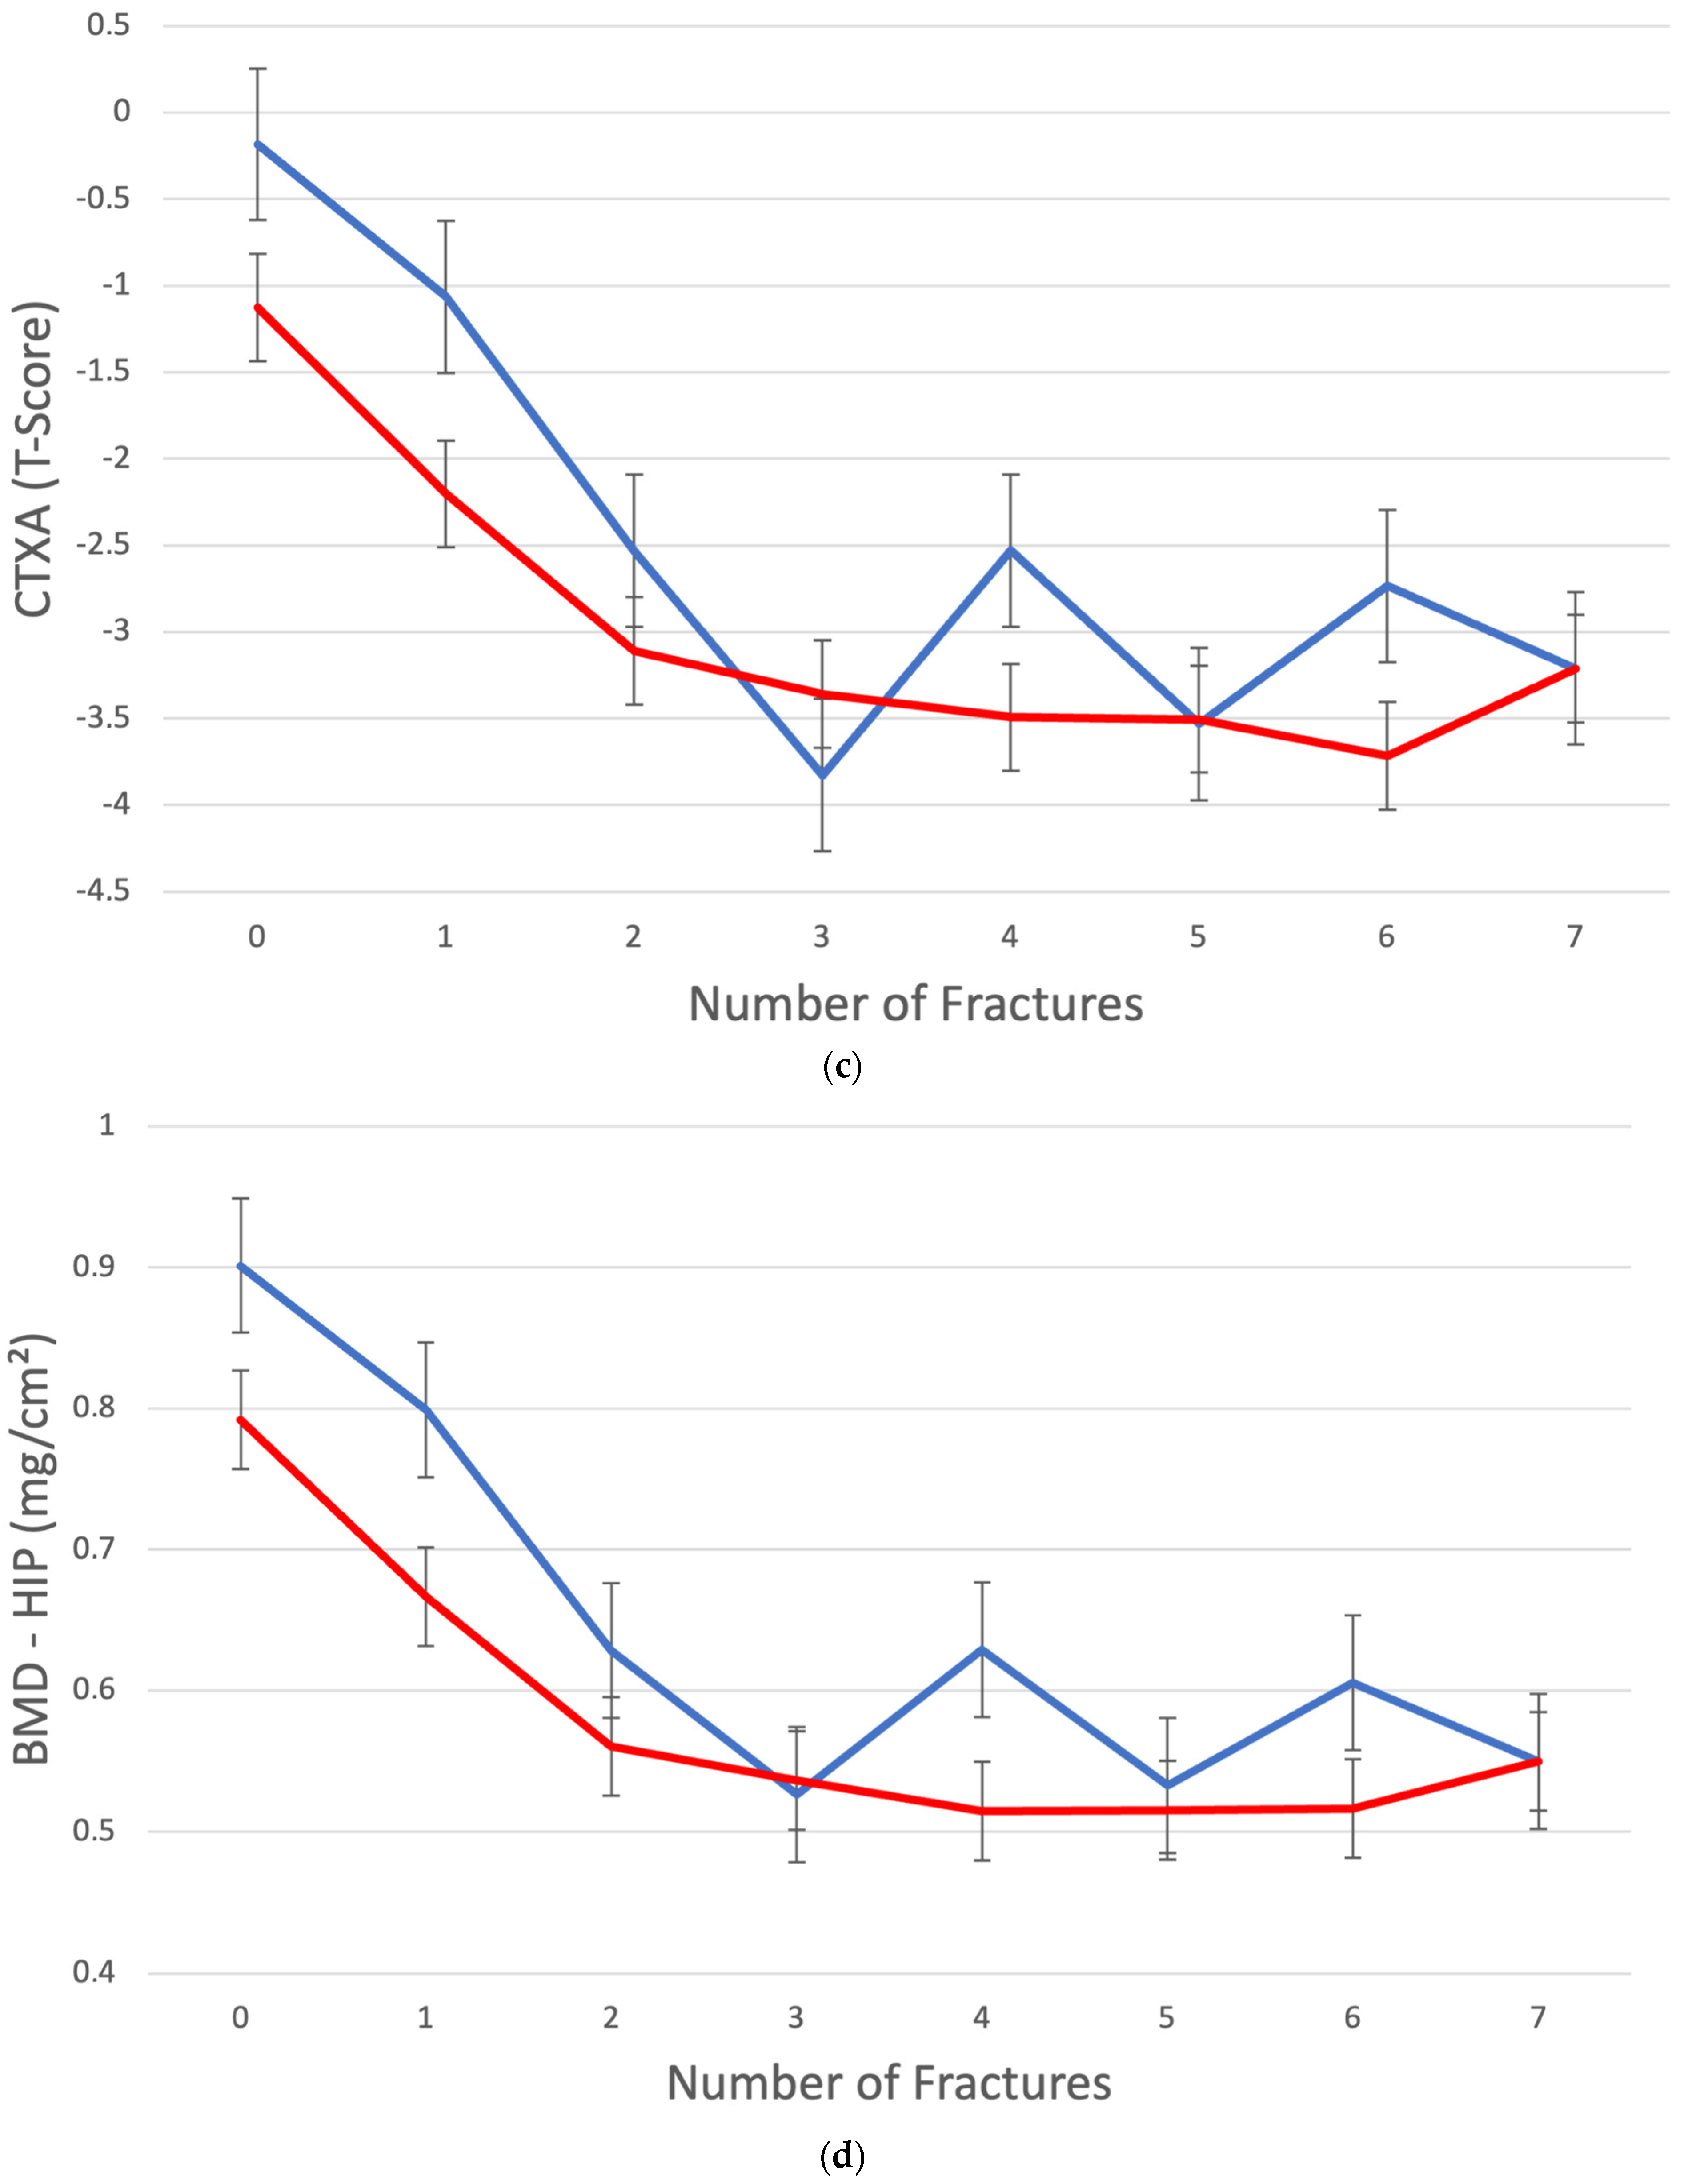
2.4. Fracture Detection

In additional lateral radiographs of the thoracic spine (ThS) and lumbar spine (LuS), vertebral fractures were detected and graded according to Genant et al. [23]. This method considers the extent of vertebral height loss, with mild severity having an anterior, middle, or posterior height reduction of 20–25% (G1); moderate severity of 25–40% (G2) and severe severity of >40% (G3) compared with the adjacent vertebrae. In the case of clinically suspected insufficiency fractures in the sacrum, MRI segmented images performed at the same time were also evaluated.

2.5. Statistics

The collected data were analyzed using the statistical software package SPSS, version 23.0 (SPSS Inc., Armonk, NY, USA). For parametric tests, the quantitative characteristics were described as the mean (M), standard deviation (SD), and number (n) of available observations; they were presented using the interval mean ± standard deviation (M ± SD). For non-parametric tests, they were presented as the median with first and third quartiles (Q1–Q3). To describe a correlation between two variables, the Spearman correlation coefficient was calculated (r). A regression analysis was used to determine the QCT value (BMD-spine) and CTXA value (BMD-hip) using a generalized estimating equation. In addition, the correlation coefficients of HU values and QCT values were compared with the CTXA values. An ANOVA test was used to compare the patient groups without a fracture, with one fracture, with more than one fracture, and with additional sacral fractures. An ROC analysis was used to assess the predictive power with respect to fracture risk estimation, taking into account the HU, QCT, and CTXA values. For the determination of sensitivity and specificity, the confidence interval was set at 95%. All p-values are the result of two-sided statistical tests; in principle, p < 0.05 is considered significant. At the same time, the effect sizes were calculated according to Cohen, and values < 0.5 were assumed to be small, between 0.5 and 0.8 as a medium effect, and >0.8 as a large effect.

3. Results

The median HU was 89.9 (67.9–126.9) and median BMD was 73.7 (57.1–104.2) mg/cm3. With a correlation of R2 = 0.98 (p < 0.001), the HU values can be calculated using the following formula: BMD-spine = 0.84 + (0.81 × HU) can be converted to quantitative values in mg/cm3 (Figure 2a). Cancellous density values < 100 HU fit as a threshold for incipient osteoporosis (Figure 2a). With HU values < 79.8 and a BMD of the lumbar spine < 65.5 mg/cm3, significantly increased sintering fractures were found in the mid-thoracic, thoracolumbar, and sacral regions with an effect size of 0.89. At least one sintering fracture was found in 103/240 patients, whereby no fracture was detected in cranial of thoracic vertebral body (T) 5. In 32/103 patients, additional sacral insufficiency fractures were found; these patients showed the lowest density values with a median HU value of 31.8 (12.7–58.2) but did not differ significantly from the other patients with more than one fracture.
For CTXA, a correlation with the HU values of the lumbar spine of R2 = 0.69 (p = 0.238) was shown, whereby the HU values can be converted into quantitative values in mg/cm2 using the following formula: BMD-hip = 0.38 + (0.0034 × HU) can be converted into quantitative values in mg/cm2 (Figure 2b).
The mean values in HU show a clear decrease as a function of increasing fractures, with a fracture threshold value at <80 HU in men and <70 HU in women (Figure 3a). This corresponds with a fracture threshold < 65 mg/cm3 in men and <58 mg/cm3 in women in the QCT (Figure 3b) and with T-score values of the hip measurement <−1 in men and <−2.2 in women (Figure 3c). With more than one fracture, the HU is below 70 (Figure 3a), the QCT values are below 60 mg/cm3 (Figure 3b), the T-score values are less than −2.5 (Figure 3c), and the CTXA values are less than 0.7 mg/cm2 (Figure 3d).
Osteoporosis begins at a density of <100 HU; below <75 HU, the fracture threshold begins, and <60 HU fractures are significantly (p < 0.05) obligatory. Above 100 HU, there are no fractures in our patients (Figure 4). In the group without and with one fracture, there are individual overlaps in the density values, whereby the median values differ significantly with p < 0.05. In comparison with the group with more than one fracture, the difference becomes even clearer with p < 0.001. Patients with sacral fractures show the lowest cancellous density values, but there is no significant difference to the group with more than one fracture and without sacral fractures (Figure 4).
The fracture distribution along the spine is shown in Figure 5.
There is a direct correlation between density values in HU and the respective BMI; patients with a low BMI tend to have a low bone density (Figure 6a). An inverse correlation is found between HU density values and patient age, with older patients showing significantly (p < 0.001) the lowest density values (Figure 6b).
An overview of the patients and characterization of the total sample is shown in Table 1.
Using an ROC analysis, it can be shown that the significance for the risk of the occurrence of OVFs using HU values is very high at >93%, and there is no significant difference to QCT with p = 0.395. The CTXA values also allow for a risk assessment but show a significantly lower AUC (Figure 7).

4. Discussion

The cancellous density measurements in HU values can be converted into quantitative BMD values in mg/cm3 due to the high significant correlation, which allows for a good estimation of demineralization and severity of osteoporosis. The studies by Buenger et al. [24] also support this, whereby a high correlation was found between the HU from native CT sectional images and QCT values in 369 patients with a similar average age as our patients. In an in vitro study on 22 older body donors, Schröder et al. [25] found a comparable correlation. The different conversion formulas from the three studies are listed in Table 2; percentage differences in the conversions from HU to QCT values in mg/cm3 are shown for 100 HU as an example. A downward deviation of 9.9% in Schröder et al. [25], compared with their own collective, is likely due to an existing fat error [20,26], so that an overestimation of demineralization was found in the older body donors with manifest osteoporosis. If, in individual cases, diagnosis by HU determination is not possible with certainty, this could be corrected by an additional dual-energy quantitative computed tomography (DEQCT) [20,27]. Density determination in routine contrast-enhanced CT examinations is feasible. However, intravenous contrast agents can cause mean density increases of 8 to 30% [28,29,30], which must be considered when assessing osteopenia or osteoporosis. Buenger et al. [31] found a high correlation (r = 0.894, p < 0.001) between cancellous density values in HU measured in contrast-enhanced CT sections and previously or subsequently obtained QCT values in mg/cm3, which is considered in a practicable conversion formula (QCT values = 0.71 × HU + 13.82). No significant difference is to be expected in the cancellous density determination (HU) with experienced examiners, which was verified in an in vitro [25] and in vivo study [32]. The ROIs used should be standardized in shape and size.
Overall, low BMI (Figure 6a) [25], increasing age (Figure 6b) [25,33], and increasing fracture numbers show a significant decrease in bone density values (Figure 4) [34]. Regarding the discrimination of patients with and without OVF, Zou et al. [34] found results comparable with ours. The cancellous density < 70 HU is likely to be an OVF. According to BMD-spine = 0.84 + (0.81 × HU), 70 HU results in 57.5 mg/cm3, which is in good agreement with an earlier QCT evaluation, where 60 mg/cm3 is given as the fracture threshold [1]. Furthermore, 100 HU corresponds to 81.8 mg/cm3, which fits well with the established quantitative osteoporosis threshold of 80 mg/cm3 [20,21]. Lee et al. [35] found a cut-off value for existing osteoporosis of <110 HU at the level of L 1 in 94.5% of cases on sagittally reformed CT sections of routine contrast-enhanced CT examinations. Pickhardt et al. [36] found a threshold value for osteoporosis of < 110 HU with a specificity of 90% when measuring HU in the axial cross-sectional image. The cancellous axial HU values tend to be slightly higher than the sagittal values by approximately 2.6–6.2% [34], although an earlier study found no differences between measurements in the axial, sagittal, and coronal planes [37]. Kim et al. [38] found cut-off values of 110 HU in the coronal plane, 112 HU in the axial plane, and 112 HU in the sagittal plane. With comparable correlations with QCT and DEXA values as well as the estimation of fracture risk, there are no overall differences in the validation. However, it must be critically questioned whether a generalized bone loss can be inferred from the measurement of only one vertebral body [28,35]. Accordingly, Scheyerer et al. [39] considered the assessment of HU on at least three different lumbar vertebral bodies to be important. In our opinion, it is less important which lumbar vertebrae is measured, but rather that it is free of degenerative, post-traumatic, osteolytic, or postoperative changes. Cancellous density measurement across the entire axial skeleton is generally appropriate, though different threshold values must be considered for the cervical, thoracic, lumbar, and sacral regions [40,41]. In the craniocaudal direction, this shows a decrease in density values along the spine with or without osteoporosis [40,41,42,43]. The fracture distribution of our patients (Figure 5) shows a comparable distribution with other in vivo and in vitro studies [14,40]. The lowest cancellous density values as an expression of severe osteoporosis are found in the lumbar spine with concomitant sacral insufficiency fractures. On the other hand, these fractures are a clear indicator of osteoporosis [44].
Quantitative density determination of the hip (CTXA) does not provide any additional benefits for the risk assessment of OVFs and is significantly inferior to the cancellous density determination in HU and QCT in the lumbar spine in terms of sensitivity and specificity (Figure 7).

4.1. Further Clinical Significance of HU Density Determination

Choi et al. [45] found that DEXA measurements with degenerative spinal changes tended to give density values that were too high, although density determination using HU tends to reflect the actual situation. CT-HU values can be used here as a supplementary method to correct spinal osteoporosis not diagnosed by DEXA [46,47].
HU thresholds can be helpful for the risk assessment of mechanical complications after spinal deformity surgery in adults [48,49]. The determination of HU in the spine also has an influence on the assessment of complications after spinal surgery. Screw loosening can be more accurately predicted using HU values compared with other methods [50,51]. Overall, it was demonstrated that measuring cancellous bone density in HU with CT scans represents a promising alternative to DEXA measurement and, in terms of accuracy for osteoporosis diagnostics, appears to be partially superior [52].
In patients undergoing percutaneous balloon kyphoplasty treatment for OVFs, low HU values are a predictor of subsequent fractures [53]. The increase in bone density after osteoanabolic therapy can also be reliably monitored using HU measurements [54].

4.2. Strengths and Weaknesses

The strength of the study is that the wide range of patient ages, BMI values, and presence of patients with and without manifest osteoporosis suggest a wide range of HU values and thus reliable correlations. The calculated fracture risk applies only to additional vertebral fractures and does not include fractures in other parts of the skeleton. To ensure comparable values across different institutions, HU measurements should be conducted under standardized conditions (a possible CT tube voltage of 120 keV, CT slice thickness of 2 mm, window setting of C = 400/W = 1600 and ROI comparable in shape and size). An automatic contour-finding program, which could be implemented technically without great effort, would be helpful in terms of accuracy for recording the cancellous space. Factors such as patient age, osteoporosis severity, BMI, and sex likely influence the conversion formula and should be accounted for when comparing with other studies (Table 2) [24,25]. Ideally, the findings from our retrospective study should be validated through a prospective, randomized, multicenter follow-up study.

5. Conclusions

Based on the results of this study, an opportunistic evaluation using only HU values in the native CT of the lumbar spine to assess osteoporosis and determine the risk of OVFs appears to be valid. Based on the literature data, this is also approximately possible in contrast-enhanced CT examinations. An additional QCT/DEQCT or DEXA of the lumbar spine can clarify the definitive diagnosis in borderline cases but no longer appears necessary in most cases if a CT scan has been performed, avoiding further radiation exposure and additional costs [52,55].

Author Contributions

Conceptualization, R.A.; methodology, J.R.A.; software, G.S.; validation, T.H.; formal analysis, G.S.; data curation, R.A., J.R.A., and G.S.; writing—original draft preparation, J.R.A.; writing—review and editing, J.R.A. and T.H.; supervision, R.A.; project administration, J.R.A. All authors have read and agreed to the published version of the manuscript.

Funding

This research received no external funding.

Institutional Review Board Statement

This study was conducted in accordance with the Declaration of Helsinki and was approved by the Institutional Ethics Committee of the medical faculty of the Christian-Albrecht University of Kiel with the approval number D 471/24, approval date: 28 March 2024.

Informed Consent Statement

Written informed consent has been obtained from the patients to publish this paper.

Data Availability Statement

The raw data supporting the conclusions of this article will be made available by the authors on reasonable request.

Conflicts of Interest

The authors declare no conflicts of interest.

Abbreviations

The following abbreviations are used in this manuscript:
AUCArea under the curve
BMDBone mineral density
BMIBody mass index
CTComputed tomography
CTXAComputed tomography X-ray absorptiometry
DEQCTDual-energy quantitative computed tomography
DEXADual-energy X-ray absorptiometry
HUHounsfield Units
LuSLumbar spine
LLumbar vertebral body
mg/cm2Milligram/Square centimeter
mg/cm3Milligram/Cubic centimeter
OVFOsteoporotic vertebral fractures
QCTQuantitative computed tomography
PatPatient
ROCsReceiver operating characteristics
ROIRegion of interest
ThSThoracic spine
TThoracic vertebral body

References

  1. Andresen, R.; Radmer, S.; Banzer, D. Bone Mineral Density and Spongiosa Architecture in Correlation to Vertebral Body Insufficiency Fractures. Acta Radiol. 1998, 39, 538–542. [Google Scholar] [CrossRef] [PubMed]
  2. Johnell, O.; Kanis, J.A. An Estimate of the Worldwide Prevalence and Disability Associated with Osteoporotic Fractures. Osteoporos. Int. 2006, 17, 1726–1733. [Google Scholar] [CrossRef]
  3. Sozen, T.; Ozisik, L.; Calik Basaran, N. An Overview and Management of Osteoporosis. Eur. J. Rheumatol. 2017, 4, 46–56. [Google Scholar] [CrossRef] [PubMed]
  4. Lindsay, R. Risk of New Vertebral Fracture in the Year Following a Fracture. JAMA 2001, 285, 320. [Google Scholar] [CrossRef] [PubMed]
  5. Oleksik, A.; Lips, P.; Dawson, A.; Minshall, M.E.; Shen, W.; Cooper, C.; Kanis, J. Health-Related Quality of Life in Postmenopausal Women With Low BMD With or Without Prevalent Vertebral Fractures. J. Bone Miner. Res. 2000, 15, 1384–1392. [Google Scholar] [CrossRef] [PubMed]
  6. Son, H.J.; Park, S.-J.; Kim, J.-K.; Park, J.-S. Mortality Risk after the First Occurrence of Osteoporotic Vertebral Compression Fractures in the General Population: A Nationwide Cohort Study. PLoS ONE 2023, 18, e0291561. [Google Scholar] [CrossRef] [PubMed]
  7. Felsenberg, D.; Silman, A.; Lunt, M.; Armbrecht, G.; Ismail, A.; Finn, J.; Cockerill, W.; Banzer, D.; Benevolenskaya, L.; Bhalla, A.; et al. Incidence of Vertebral Fracture in Europe: Results from the European Prospective Osteoporosis Study (EPOS). J. Bone Miner. Res. 2002, 17, 716–724. [Google Scholar] [CrossRef] [PubMed]
  8. Li, H.; Sun, T.; Han, D.; Gong, W.; Mao, W.; Gan, X.; Shu, D.; Zhou, Q.; Xu, L.; Hou, L.; et al. Risk Factors of Osteoporosis in Elderly Inpatients: A Cross-Sectional Single-Centre Study. Front. Aging 2023, 4, 1126172. [Google Scholar] [CrossRef]
  9. Lang, S.; Walter, N.; Freigang, V.; Neumann, C.; Loibl, M.; Alt, V.; Rupp, M. Increased Incidence of Vertebral Fractures in German Adults from 2009 to 2019 and the Analysis of Secondary Diagnoses, Treatment, Costs, and in-Hospital Mortality. Sci. Rep. 2023, 13, 6984. [Google Scholar] [CrossRef] [PubMed]
  10. Maier, G.S.; Seeger, J.B.; Horas, K.; Roth, K.E.; Kurth, A.A.; Maus, U. The Prevalence of Vitamin D Deficiency in Patients with Vertebral Fragility Fractures. Bone Jt. J. 2015, 97-B, 89–93. [Google Scholar] [CrossRef] [PubMed]
  11. Zhang, L.; Chun, C.; Yang, Y.; Liu, B.; Zhu, Y.; Chen, R.; Rong, L. Vitamin D Deficiency/Insufficiency Is Associated with Risk of Osteoporotic Thoracolumbar Junction Vertebral Fractures. Med. Sci. Monit. 2019, 25, 8260–8268. [Google Scholar] [CrossRef] [PubMed]
  12. Tong, J.; Xu, S.; Zong, H.; Pan, M.; Teng, Y.; Xu, J. Prevalence and Risk Factors Associated with Vertebral Osteoporotic Fractures in Patients with Rheumatoid Arthritis. Clin. Rheumatol. 2020, 39, 357–364. [Google Scholar] [CrossRef] [PubMed]
  13. Pisani, P.; Renna, M.D.; Conversano, F.; Casciaro, E.; Di Paola, M.; Quarta, E.; Muratore, M.; Casciaro, S. Major Osteoporotic Fragility Fractures: Risk Factor Updates and Societal Impact. World J. Orthop. 2016, 7, 171. [Google Scholar] [CrossRef] [PubMed]
  14. Möller, G.; Andresen, R.; Banzer, D. Shape model-based semi-automatic morphometric assessment of vertebral deformities in clinical practice: Results of a multi-centre medical practice evaluation pilot study in Germany. Osteologie 2011, 20, 239–247. [Google Scholar] [CrossRef]
  15. Christiansen, B.A.; Bouxsein, M.L. Biomechanics of Vertebral Fractures and the Vertebral Fracture Cascade. Curr. Osteoporos. Rep. 2010, 8, 198–204. [Google Scholar] [CrossRef] [PubMed]
  16. Schröder, G.; Hiepe, L.; Moritz, M.; Vivell, L.-M.; Schulze, M.; Martin, H.; Götz, A.; Andresen, J.R.; Kullen, C.-M.; Andresen, R.; et al. Warum sich in der Halswirbelsäule auch bei Osteoporose nur selten Insuffizienzfrakturen finden. Z. Für Orthop. Unfallchirurgie 2022, 160, 657–669. [Google Scholar] [CrossRef]
  17. Andresen, J.R.; Radmer, S.; Andresen, R.; Prokop, A.; Schröder, G.; Nissen, U.; Schober, H.-C. Comparative Outcome of Different Treatment Options for Fragility Fractures of the Sacrum. BMC Musculoskelet. Disord. 2022, 23, 1106. [Google Scholar] [CrossRef] [PubMed]
  18. Damilakis, J.; Maris, T.G.; Karantanas, A.H. An Update on the Assessment of Osteoporosis Using Radiologic Techniques. Eur. Radiol. 2007, 17, 1591–1602. [Google Scholar] [CrossRef] [PubMed]
  19. Dachverband Osteologie e.V. S3-Leitlinie Prophylaxe, Diagnostik Und Therapie Der Osteoporose Bei Postmenopausalen Frauen Und Bei Männern Ab Dem 50. Lebensjahr; Dachverband Osteologie e.V.: Essen, Germany, 2023. [Google Scholar]
  20. Felsenberg, D.; Gowin, W. Knochendichtemessung Mit Zwei-Spektren-Methoden. Radiologie 1999, 39, 186–193. [Google Scholar] [CrossRef]
  21. Engelke, K.; Adams, J.E.; Armbrecht, G.; Augat, P.; Bogado, C.E.; Bouxsein, M.L.; Felsenberg, D.; Ito, M.; Prevrhal, S.; Hans, D.B.; et al. Clinical Use of Quantitative Computed Tomography and Peripheral Quantitative Computed Tomography in the Management of Osteoporosis in Adults: The 2007 ISCD Official Positions. J. Clin. Densitom. 2008, 11, 123–162. [Google Scholar] [CrossRef]
  22. Cann, C.E.; Adams, J.E.; Brown, J.K.; Brett, A.D. CTXA Hip—An Extension of Classical DXA Measurements Using Quantitative CT. PLoS ONE 2014, 9, e91904. [Google Scholar] [CrossRef]
  23. Genant, H.K.; Wu, C.Y.; Van Kuijk, C.; Nevitt, M.C. Vertebral Fracture Assessment Using a Semiquantitative Technique. J. Bone Miner. Res. 1993, 8, 1137–1148. [Google Scholar] [CrossRef]
  24. Buenger, F.; Eckardt, N.; Sakr, Y.; Senft, C.; Schwarz, F. Correlation of Bone Density Values of Quantitative Computed Tomography and Hounsfield Units Measured in Native Computed Tomography in 902 Vertebral Bodies. World Neurosurg. 2021, 151, e599–e606. [Google Scholar] [CrossRef] [PubMed]
  25. Schröder, G.; Andresen, J.R.; Hiepe, L.; Schulze, M.; Kullen, C.M.; Kopetsch, C.; Burmeister, J.; Schober, H.-C.; Andresen, R. Interobserver Variability in the Determination of Bone Mineral Density in Hounsfield Units from Differently Configured Fields of Measurement in the Cancellous Bone of Vertebral Bodies from Elderly Body Donors. J. Orthop. 2024, 49, 48–55. [Google Scholar] [CrossRef] [PubMed]
  26. Andresen, R.; Radmer, S.; Banzer, D.; Felsenberg, D.; Wolf, K.-J. Quantitative Knochenmineralgehaltsbestimmung (QCT)—Systemvergleich baugleicher Computertomographen. RöFo 1994, 160, 260–265. [Google Scholar] [CrossRef] [PubMed]
  27. Glüer, C.-C.; Reiser, U.J.; Davis, C.A.; Rutt, B.K.; Genant, H.K. Vertebral Mineral Determination by Quantitative Computed Tomography (QCT): Accuracy of Single and Dual Energy Measurements. J. Comput. Assist. Tomogr. 1988, 12, 242–258. [Google Scholar] [CrossRef]
  28. Pickhardt, P.J.; Lauder, T.; Pooler, B.D.; Muñoz Del Rio, A.; Rosas, H.; Bruce, R.J.; Binkley, N. Effect of IV Contrast on Lumbar Trabecular Attenuation at Routine Abdominal CT: Correlation with DXA and Implications for Opportunistic Osteoporosis Screening. Osteoporos. Int. 2016, 27, 147–152. [Google Scholar] [CrossRef]
  29. Bauer, J.S.; Henning, T.D.; Müeller, D.; Lu, Y.; Majumdar, S.; Link, T.M. Volumetric Quantitative CT of the Spine and Hip Derived from Contrast-Enhanced MDCT: Conversion Factors. Am. J. Roentgenol. 2007, 188, 1294–1301. [Google Scholar] [CrossRef] [PubMed]
  30. Baum, T.; Müller, D.; Dobritz, M.; Rummeny, E.J.; Link, T.M.; Bauer, J.S. BMD Measurements of the Spine Derived from Sagittal Reformations of Contrast-Enhanced MDCT without Dedicated Software. Eur. J. Radiol. 2011, 80, e140–e145. [Google Scholar] [CrossRef]
  31. Buenger, F.; Sakr, Y.; Eckardt, N.; Senft, C.; Schwarz, F. Correlation of Quantitative Computed Tomography Derived Bone Density Values with Hounsfield Units of a Contrast Medium Computed Tomography in 98 Thoraco-Lumbar Vertebral Bodies. Arch. Orthop. Trauma Surg. 2021, 142, 3335–3340. [Google Scholar] [CrossRef] [PubMed]
  32. Ullrich, B.W.; Schwarz, F.; McLean, A.L.; Mendel, T.; Kaden, I.; Hein, E.; Lattauschke, A.; Beyer, J.; Hofmann, G.O.; Klauke, F.; et al. Inter-Rater Reliability of Hounsfield Units as a Measure of Bone Density: Applications in the Treatment of Thoracolumbar Fractures. World Neurosurg. 2022, 158, e711–e716. [Google Scholar] [CrossRef]
  33. Lee, S.; Chung, C.K.; Oh, S.H.; Park, S.B. Correlation between Bone Mineral Density Measured by Dual-Energy X-Ray Absorptiometry and Hounsfield Units Measured by Diagnostic CT in Lumbar Spine. J. Korean Neurosurg. Soc. 2013, 54, 384. [Google Scholar] [CrossRef] [PubMed]
  34. Zou, D.; Ye, K.; Tian, Y.; Li, W.; Zhou, F.; Zhang, Z.; Lu, Z.; Xu, Z. Characteristics of Vertebral CT Hounsfield Units in Elderly Patients with Acute Vertebral Fragility Fractures. Eur. Spine J. 2020, 29, 1092–1097. [Google Scholar] [CrossRef] [PubMed]
  35. Lee, S.J.; Binkley, N.; Lubner, M.G.; Bruce, R.J.; Ziemlewicz, T.J.; Pickhardt, P.J. Opportunistic Screening for Osteoporosis Using the Sagittal Reconstruction from Routine Abdominal CT for Combined Assessment of Vertebral Fractures and Density. Osteoporos. Int. 2016, 27, 1131–1136. [Google Scholar] [CrossRef]
  36. Pickhardt, P.J.; Pooler, B.D.; Lauder, T.; Del Rio, A.M.; Bruce, R.J.; Binkley, N. Opportunistic Screening for Osteoporosis Using Abdominal Computed Tomography Scans Obtained for Other Indications. Ann. Intern. Med. 2013, 158, 588. [Google Scholar] [CrossRef] [PubMed]
  37. Marinova, M.; Edon, B.; Wolter, K.; Katsimbari, B.; Schild, H.H.; Strunk, H.M. Use of Routine Thoracic and Abdominal Computed Tomography Scans for Assessing Bone Mineral Density and Detecting Osteoporosis. Curr. Med. Res. Opin. 2015, 31, 1871–1881. [Google Scholar] [CrossRef]
  38. Kim, Y.; Kim, C.; Lee, E.; Lee, J.W. Coronal Plane in Opportunistic Screening of Osteoporosis Using Computed Tomography: Comparison with Axial and Sagittal Planes. Skelet. Radiol. 2024, 53, 1103–1109. [Google Scholar] [CrossRef]
  39. Scheyerer, M.J.; Ullrich, B.; Osterhoff, G.; Spiegl, U.A.; Schnake, K.J.; Arbeitsgruppe Osteoporotische Frakturen der Sektion Wirbelsäule der Deutschen Gesellschaft für Orthopädie und Unfallchirurgie. „Hounsfield units“ als Maß für die Knochendichte—Anwendungsmöglichkeiten in der Wirbelsäulenchirurgie. Unfallchirurg 2019, 122, 654–661. [Google Scholar] [CrossRef] [PubMed]
  40. Schröder, G.; Flachsmeyer, D.; Kullen, C.M.; Andresen, J.R.; Schulze, M.; Hiepe, L.; Schober, H.-C.; Andresen, R. Insuffizienzfrakturen der Wirbelsäule in Abhängigkeit von der spongiösen Knochendichte: Eine in-vitro-Studie. Orthopädie 2022, 51, 547–555. [Google Scholar] [CrossRef] [PubMed]
  41. Vanier, A.T.; Colantonio, D.; Saxena, S.K.; Rodkey, D.; Wagner, S. Computed Tomography of the Chest as a Screening Tool for Low Bone Mineral Density. Mil. Med. 2023, 188, 665–669. [Google Scholar] [CrossRef] [PubMed]
  42. Schröder, G.; Reichel, M.; Spiegel, S.; Schulze, M.; Götz, A.; Bugaichuk, S.; Andresen, J.R.; Kullen, C.M.; Andresen, R.; Schober, H.-C. Breaking Strength and Bone Microarchitecture in Osteoporosis: A Biomechanical Approximation Based on Load Tests in 104 Human Vertebrae from the Cervical, Thoracic, and Lumbar Spines of 13 Body Donors. J. Orthop. Surg. 2022, 17, 228. [Google Scholar] [CrossRef] [PubMed]
  43. Simion, G.; Eckardt, N.; Ullrich, B.W.; Senft, C.; Schwarz, F. Bone Density of the Cervical, Thoracic and Lumbar Spine Measured Using Hounsfield Units of Computed Tomography—Results of 4350 Vertebras. BMC Musculoskelet. Disord. 2024, 25, 200. [Google Scholar] [CrossRef]
  44. Rommens, P.M.; Drees, P.; Thomczyk, S.; Betz, U.; Wagner, D.; Hofmann, A. Die Fragilitätsfraktur des Beckens ist eine Indikatorfraktur der Osteoporose. Osteologie 2018, 27, 144–153. [Google Scholar] [CrossRef]
  45. Choi, M.K.; Kim, S.M.; Lim, J.K. Diagnostic Efficacy of Hounsfield Units in Spine CT for the Assessment of Real Bone Mineral Density of Degenerative Spine: Correlation Study between T-Scores Determined by DEXA Scan and Hounsfield Units from CT. Acta Neurochir. 2016, 158, 1421–1427. [Google Scholar] [CrossRef] [PubMed]
  46. Zaidi, Q.; Danisa, O.A.; Cheng, W. Measurement Techniques and Utility of Hounsfield Unit Values for Assessment of Bone Quality Prior to Spinal Instrumentation: A Review of Current Literature. Spine 2019, 44, E239–E244. [Google Scholar] [CrossRef]
  47. Zou, D.; Li, W.; Deng, C.; Du, G.; Xu, N. The Use of CT Hounsfield Unit Values to Identify the Undiagnosed Spinal Osteoporosis in Patients with Lumbar Degenerative Diseases. Eur. Spine J. 2019, 28, 1758–1766. [Google Scholar] [CrossRef] [PubMed]
  48. Chanbour, H.; Steinle, A.M.; Chen, J.W.; Waddell, W.H.; Vickery, J.; LaBarge, M.E.; Longo, M.; Gardocki, R.J.; Abtahi, A.M.; Stephens, B.F.; et al. The Importance of Hounsfield Units in Adult Spinal Deformity Surgery: Finding an Optimal Threshold to Minimize the Risk of Mechanical Complications. J. Spine Surg. 2023, 9, 149–158. [Google Scholar] [CrossRef]
  49. Yoshie, N.; Maruo, K.; Arizumi, F.; Kishima, K.; Kusukawa, T.; Tachibana, T. The Relationship between the Hounsfield Units Value of the Upper Instrumented Vertebra and the Severity of Proximal Junctional Fracture after Adult Spinal Deformity Surgery. Medicina 2023, 59, 1086. [Google Scholar] [CrossRef]
  50. Li, J.; Zhang, Z.; Xie, T.; Song, Z.; Song, Y.; Zeng, J. The Preoperative Hounsfield Unit Value at the Position of the Future Screw Insertion Is a Better Predictor of Screw Loosening than Other Methods. Eur. Radiol. 2022, 33, 1526–1536. [Google Scholar] [CrossRef] [PubMed]
  51. Shu, L.; Muheremu, A.; Ji, Y.; Zhang, R.; Liu, W. Prediction of Lumbar Pedicle Screw Loosening Using Hounsfield Units inComputed Tomography. Curr. Med. Imaging Rev. 2023, 20, e260423216204. [Google Scholar] [CrossRef]
  52. Deshpande, N.; Hadi, M.S.; Lillard, J.C.; Passias, P.G.; Linzey, J.R.; Saadeh, Y.S.; LaBagnara, M.; Park, P. Alternatives to DEXA for the Assessment of Bone Density: A Systematic Review of the Literature and Future Recommendations. J. Neurosurg. Spine 2023, 38, 436–445. [Google Scholar] [CrossRef] [PubMed]
  53. Ye, K.; Zou, D.; Zhou, F.; Li, W.; Tian, Y. Low Vertebral CT Hounsfield Units: A Risk Factor for New Osteoporotic Vertebral Fractures after the Treatment of Percutaneous Kyphoplasty. Arch. Osteoporos. 2022, 17, 137. [Google Scholar] [CrossRef] [PubMed]
  54. Chung, A.; Robinson, J.; Gendelberg, D.; Jimenez, J.; Anand, A.; Rao, A.; Khandehroo, B.; Khandehroo, B.; Kahwaty, S.; Anand, N. Do Peri-Operative Parathyroid Hormone (PTH) Analogues Improve Bone Density and Decrease Mechanical Complications in Spinal Deformity Correction?—A Minimum 2-Year Radiological Study Measuring Hounsfield Units. Eur. Spine J. 2023, 32, 3651–3658. [Google Scholar] [CrossRef]
  55. Alharthy, A. Assessment of Trabecular Bone Hounsfield Units in the Lumbar Spine for Osteoporosis Evaluation in Individuals Aged 65 and above: A Review. Osteoporos. Int. 2024. [Google Scholar] [CrossRef] [PubMed]
Figure 1. (a) Mid-vertebral axial CT segment with underlying reference body for lumbar osteodensitometry. (b) Axial and coronal CT segment from CTXA. (c) Sagittal mid-axial lumbar spine CT reconstruction with ellipsoid ROI drawn in the non-fractured vertebral bodies T 11, L 3, and L 5. OVFs are found at the level of T 12, L 1, L 2, and L 3. (d) The sagittal T2-weighted, fat-suppressed MRI segmented image shows clear signal enhancement, which is an expression of edema in the fresh sintering of the OVFs of L 1 and L 2. (e) Coronal MRI segmented image (STIR sequence) showing a bilateral fresh sacral fracture. (f,g) Lateral X-ray image of the lumbar spine and thoracic spine to detect the OVF.
Jcm 14 01226 g001
Figure 2. (a) Correlation of the cancellous density values in HU with the lumbar QCT values in mg/cm3. At 100 HU, the resulting BMD is 81.84 mg/cm3, which approximately corresponds to the defined osteoporosis limit [22], so that density values < 100 HU are in an osteoporotic range. (b) Correlation of the cancellous lumbar density values in HU with the CTXA values in mg/cm2.
Jcm 14 01226 g002
Figure 3. (a) Correlation between the cancellous lumbar density values in HU and the number of OVFs. The red line represents women, and the blue line represents men. There are no OVFs above the osteoporosis threshold of 100 HU. (b) The correlation between the lumbar QCT values in mg/cm3 and the number of OVFs. There are no OVFs above the osteoporosis threshold value of 80 mg/cm3. The red line represents women, and the blue line represents men. (c) Number of OVFs in relation to the CTXA (T-score). The red line represents women, and the blue line represents men. (d) Number of OVFs in relation to the CTXA (mg/cm2). The red line represents women, and the blue line represents men.
Jcm 14 01226 g003aJcm 14 01226 g003b
Figure 4. (a) The mean values of the density measurement in HU show a significant difference (p < 0.001) between patients without and with at least one OVF. Patients with sacral fractures have the lowest bone density. There are no fractures above the osteoporosis threshold value of 100 HU. (b) The mean values of the QCT values show a significant difference (p < 0.001) between patients without and with at least one OVF. Patients with sacral fractures have the lowest bone density. There are no fractures above the osteoporosis threshold value of 80 mg/cm3. (c) The mean values of CTXA in mg/cm2 show decreasing values with increasing number of OVFs.
Jcm 14 01226 g004aJcm 14 01226 g004b
Figure 5. Distribution of OVFs along the spine. There are no fractures cranial of T 5. An accumulation of OVFs is found in the middle thoracic spine, thoracolumbar, and sacral regions.
Jcm 14 01226 g005
Figure 6. (a) Correlation of HU values and BMI. Patients with low BMI values have low density values (HU). (b) Correlation of HU values with patient age. Patients of advanced age have low density values (HU).
Jcm 14 01226 g006
Figure 7. The ROCs curve analysis could not detect the AUC Hounsfield Units to be different from AUC lumbar CT (p = 0.395). Both the AUC of hip curves (CTXA in mg/cm2 and hip CT in T-Score) are comparable as well. A cut-off value of Hounsfield Units to optimally classify patients with and without fractures was determined by the maximal Youden index. Patients with ≤80 HU are assumed to have fractures (sensitivity = 0.89; specificity = 0.93). These diagnostic measures are comparable with those of lumbar QCT (sensitivity = 0.92; specificity = 0.92; cut-off ≤ 66 mg/cm3).
Jcm 14 01226 g007
Table 1. Patient description by sex, age, BMI, and number of OVFs. OVFs were detected and graded according to Genant et al. [23]. This considers the extent of vertebral height loss, with mild severity having an anterior, middle, or posterior height reduction of 20–25% (G1); moderate severity of 25–40% (G2); and severe severity of >40% (G3) compared with the adjacent vertebrae.
Characterization of the Total Sample
Patients (n = 240)Men (n = 40)Women (n = 200)
Age
(in years)
⌀ 65.9⌀ 68.5⌀ 65.3
BMI
(kg/m2)
⌀ 26.7⌀ 24.9⌀ 27.1
Fracturestotal: 293
G1: 128
G2: 111
G3: 22
Sacrum: 32
total: 36
G1: 19
G2: 13
G3: 1
Sacrum: 3
total: 257
G1: 109
G2: 98
G3: 21
Sacrum: 29
Table 2. Comparison of own results with two methodologically comparable studies. With high correlation, the HU values can be converted into quantitative values (mg/cm3) in all studies. At a threshold value of 100 HU, deviating quantitative values can be seen, which are caused by different patient collectives. The older the patient collective, the more pronounced a possible fat error becomes, which could be corrected by a DEQCT in a borderline case [20,26].
Conversion Values of Different Studies
Study GroupAverage Age
(in Years)
Conversion Formula from HU in mg/cm3Absolute Value and Percentage Deviation at 100 HU Compared with Own Results
Own results65.9QCT-Value
=0.84 + (0.81 × HU)
81.8 mg/cm3
Buenger et al., 2021 [24]66.98QCT-Value
=17.8 + (0.7 × HU)
87.8 mg/cm3
about 7.3% higher
Schröder et al., 2023 [25]81.1QCT-Value
=13.7 + (0.6 × HU)
73.7 mg/cm3
about 9.9% lower
Disclaimer/Publisher’s Note: The statements, opinions and data contained in all publications are solely those of the individual author(s) and contributor(s) and not of MDPI and/or the editor(s). MDPI and/or the editor(s) disclaim responsibility for any injury to people or property resulting from any ideas, methods, instructions or products referred to in the content.

