
Normal Values for Speckle-Tracking Echocardiography in Children: A Review, Update, and Guide for Clinical Use of Speckle-Tracking Echocardiography in Pediatric Patients

 ,
,  ,
,  ,
, 
Abstract
1. Introduction
2. Literature Search Criteria
3. Results
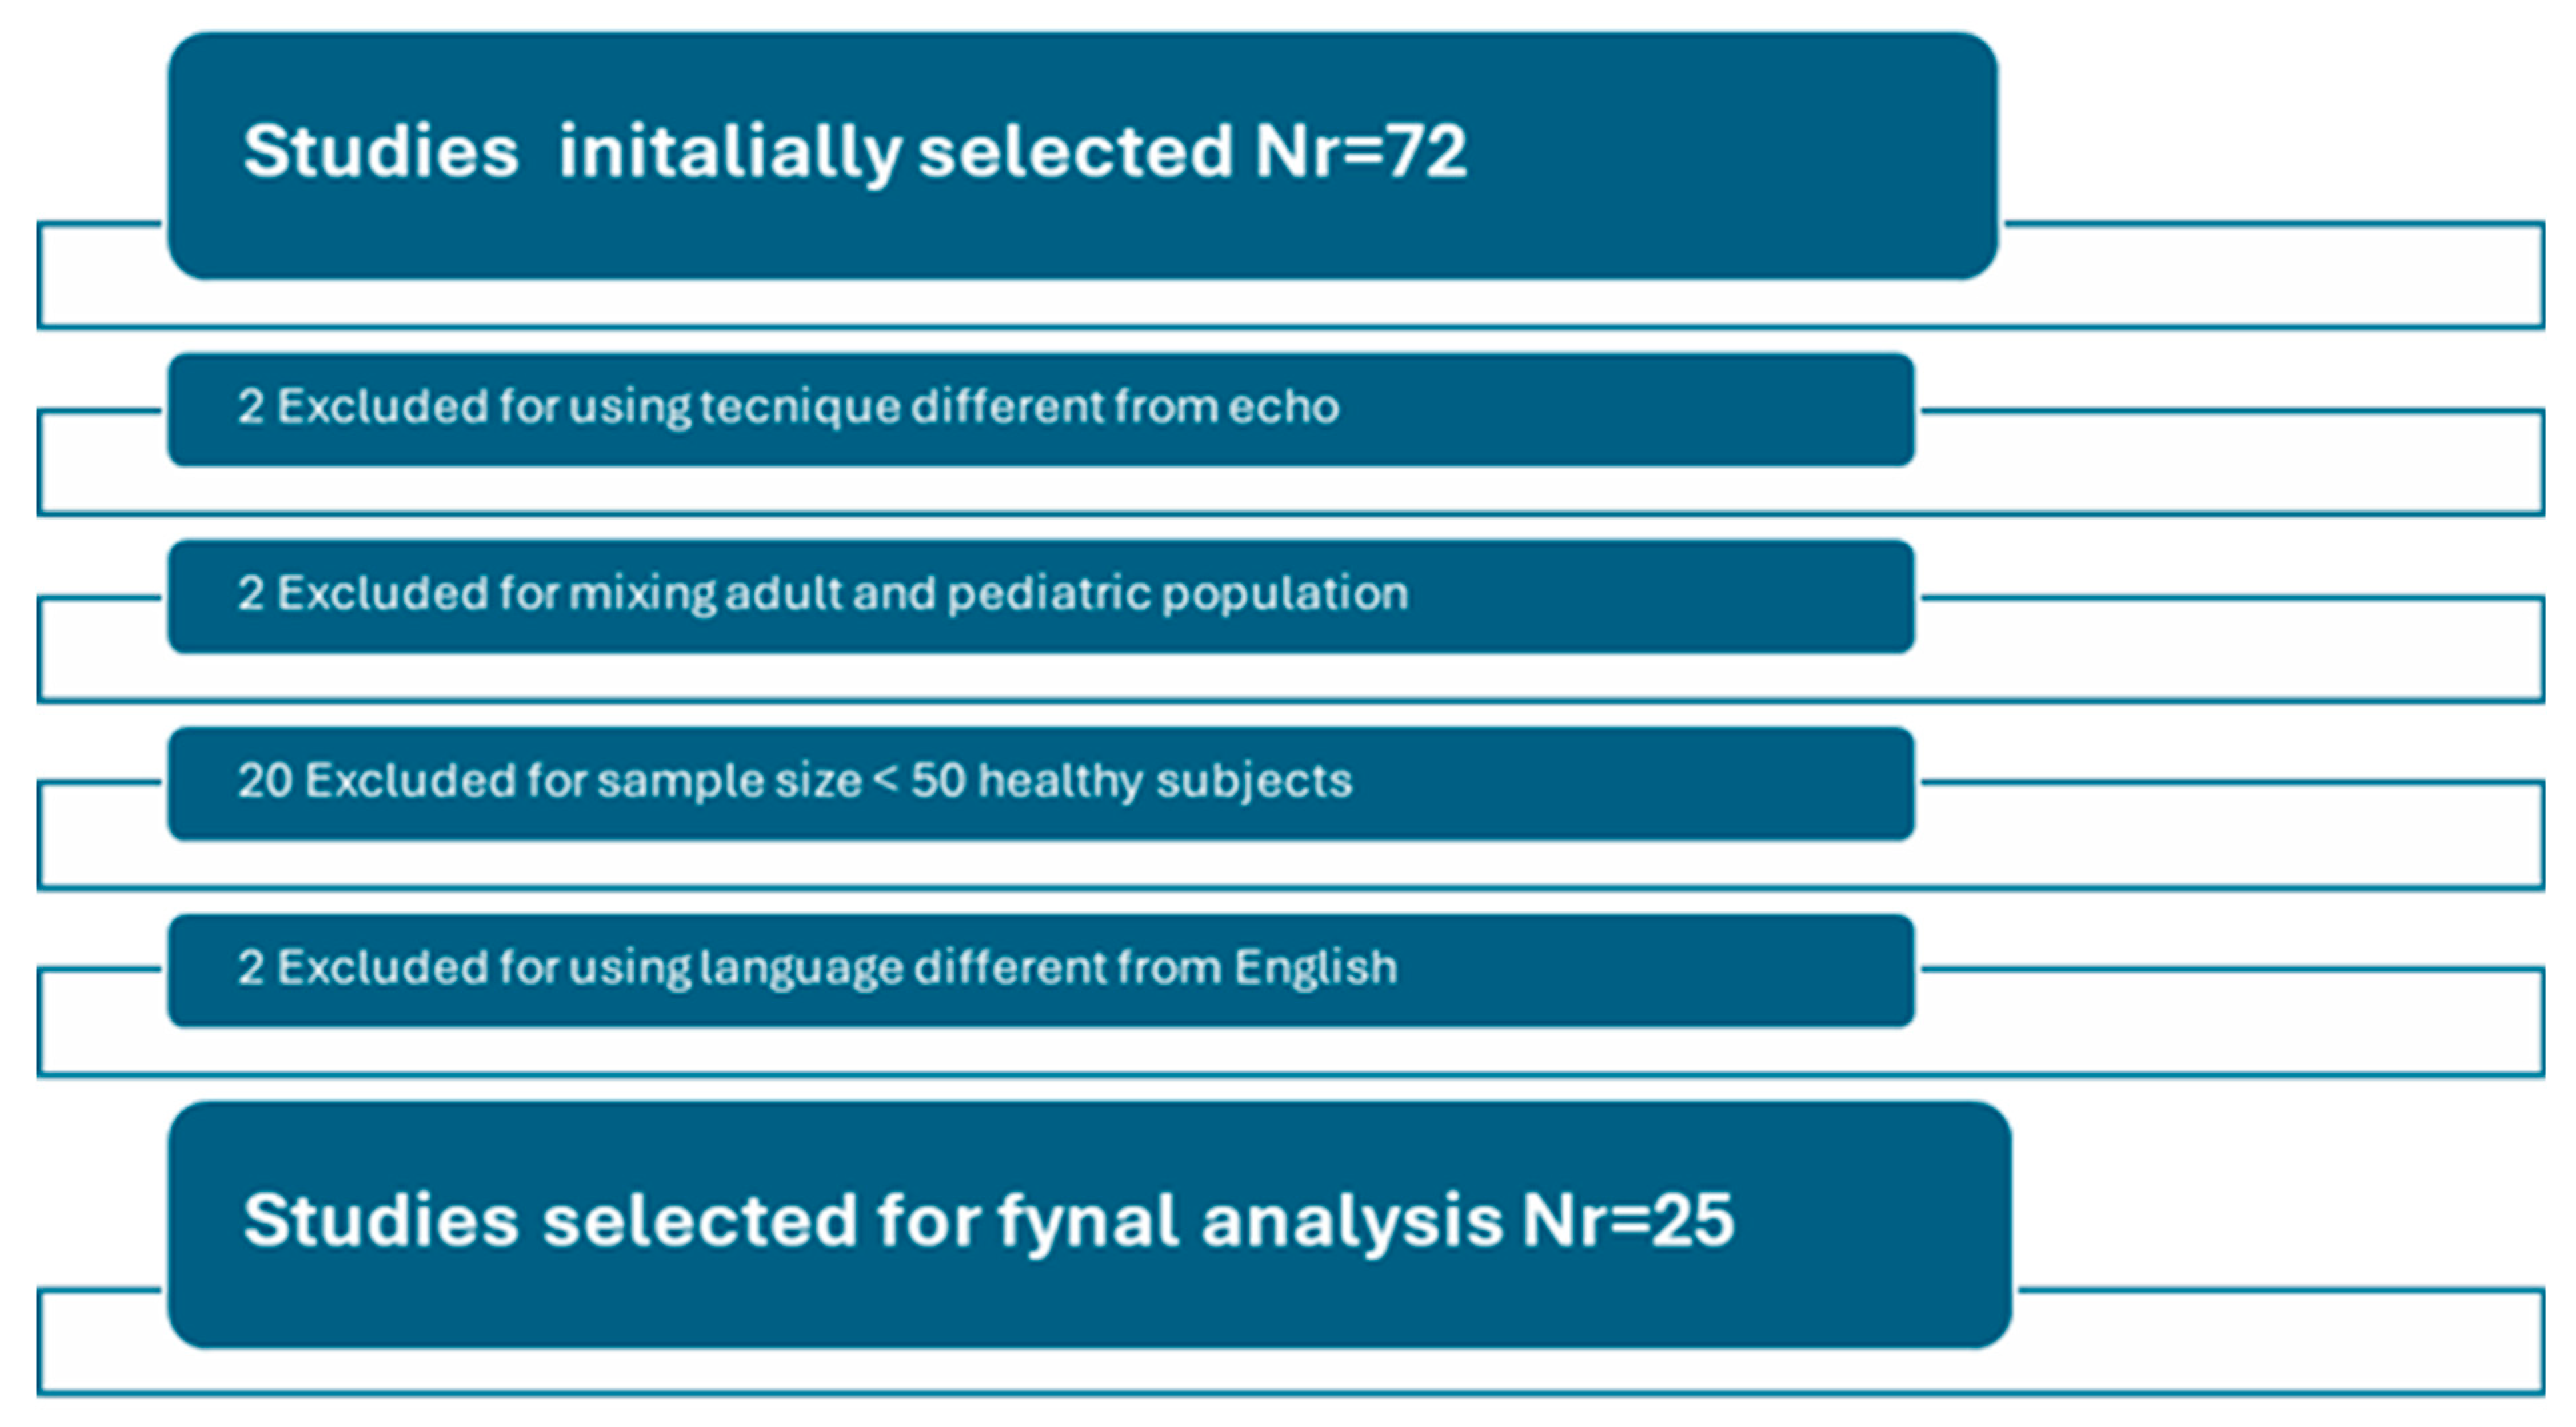
3.1. Search Results
Physics and Basic Principles of STE
3.2. Ventricular Strain
3.2.1. Relationship of Strain Parameters with Age and Body Size Parameters
3.2.2. Gender
3.2.3. Data Normalization and Expression
3.2.4. Comparison Among Vendors
- Inter-vendor variability
- Inter- and intra-sonographer variability
4. Atrial Strain
4.1. Maturational Variation
4.2. Comparison Between P- and R-Gating and Ventricular-Specific and Atrial-Specific Software
5. Discussion
5.1. Strengths and Limitations
5.2. Practical Applications and Future Directions
6. Conclusions
Author Contributions
Funding
Institutional Review Board Statement
Informed Consent Statement
Data Availability Statement
Conflicts of Interest
References
- Acheampong, B.; Parra, D.; Havens, C.; Jantzen, D.; Godown, J.; Soslow, J. Vendor independent myocardial strain values in children. Echocardiography 2023, 40, 30–36. [Google Scholar] [CrossRef] [PubMed]
- Adar, A.; Ghelani, S.J.; Sleeper, L.A.; Lu, M.; Marcus, E.; Ferraro, A.M.; Colan, S.D.; Banka, P.; Powell, A.J.; Harrild, D.M. Normal Values for Left Ventricular Strain and Synchrony in Children Based on Speckle Tracking Echocardiography. Am. J. Cardiol. 2019, 123, 1546–1554. [Google Scholar] [CrossRef] [PubMed]
- Jimbo, S.; Noto, N.; Okuma, H.; Kato, M.; Komori, A.; Ayusawa, M.; Morioka, I. Normal reference values for left atrial strains and strain rates in school children assessed using two-dimensional speckle-tracking echocardiography. Heart Vessel. 2020, 35, 1270–1280. [Google Scholar] [CrossRef] [PubMed]
- Harrington, J.K.; Ferraro, A.M.; Colan, S.D.; Sleeper, L.A.; Lu, M.; Adar, A.; Powell, A.J.; Levy, P.T.; Harrild, D.M. Normal Left Ventricular Systolic and Diastolic Strain Rate Values in Children Derived from Two-Dimensional Speckle-Tracking Echocardiography. J. Am. Soc. Echocardiogr. 2021, 34, 1303–1315.e3. [Google Scholar] [CrossRef] [PubMed]
- Kotby, A.A.; Ebrahim, S.O.S.; Al-Fahham, M.M. Reference centiles for left ventricular longitudinal global and regional systolic strain by automated functional imaging in healthy Egyptian children. Cardiol. Young 2023, 33, 26–34. [Google Scholar] [CrossRef]
- Davarpasand, T.; Jalali, A.; Mohseni-Badalabadi, R.; Toofaninejad, N.; Hali, R.; Fallah, F.; Seilani, P.; Hosseinsabet, A. Normal ranges of left atrial phasic strains and strain rates by 2D speckle-tracking echocardiography in pediatrics: A systematic review and meta-analysis. Sci. Rep. 2024, 14, 25888. [Google Scholar] [CrossRef]
- Koopman, L.P.; Rebel, B.; Gnanam, D.; Menting, M.E.; Helbing, W.A.; Boersma, E. Reference values for two-dimensional myocardial strain echocardiography of the left ventricle in healthy children. Cardiol. Young 2019, 29, 325–337. [Google Scholar] [CrossRef]
- Zhang, L.; Gao, J.; Xie, M.; Yin, P.; Liu, W.; Li, Y.; Klas, B.; Sun, J.; Balluz, R.; Ge, S. Left ventricular three-dimensional global systolic strain by real-time three-dimensional speckle-tracking in children: Feasibility, reproducibility, maturational changes, and normal ranges. J. Am. Soc. Echocardiogr. 2013, 26, 853–859. [Google Scholar] [CrossRef]
- Kamel, H.; Elsayegh, A.T.; Nazmi, H.; Attia, H.M. Assessment of left ventricular systolic function using two- and three-dimensional speckle tracking echocardiography among healthy preschool-age pediatric children. Egypt. Heart J. 2022, 74, 21. [Google Scholar] [CrossRef]
- Aristizábal-Duque, C.H.; Fernández Cabeza, J.; Blancas Sánchez, I.M.; Delgado Ortega, M.; Aparicio Martinez, P.; Romero-Saldaña, M.; Fonseca Del Pozo, F.J.; Pan, M.; Ruiz Ortiz, M.; Mesa-Rubio, M.D. The Assessment of Myocardial Longitudinal Strain in a Paediatric Spanish Population Using a New Software Analysis. J. Clin. Med. 2022, 11, 3272. [Google Scholar] [CrossRef]
- Cantinotti, M.; Kutty, S.; Giordano, R.; Assanta, N.; Murzi, B.; Crocetti, M.; Marotta, M.; Iervasi, G. Review and status report of pediatric left ventricular systolic strain and strain rate nomograms. Heart Fail. Rev. 2015, 20, 601–612. [Google Scholar] [CrossRef]
- Marcus, K.A.; Janousek, J.; Barends, M.E.; Weijers, G.; de Korte, C.L.; Kapusta, L. Synchronicity of systolic deformation in healthy pediatric and young adult subjects: A two-dimensional strain echocardiography study. Am. J. Physiol. Heart Circ. Physiol. 2012, 302, H196–H205. [Google Scholar] [CrossRef]
- Marcus, K.A.; Mavinkurve-Groothuis, A.M.; Barends, M.; van Dijk, A.; Feuth, T.; de Korte, C.; Kapusta, L. References values for myocardial two-dimensional strain echocardiography in a healthy pediatric and young adult cohort. J. Am. Soc. Echocardiogr. 2011, 24, 625–636. [Google Scholar] [CrossRef]
- Klitsie, L.M.; Roest, A.A.; van der Hulst, A.E.; Stijnen, T.; Blom, N.A. Ten Harkel AD Assessment of intraventricular time differences in healthy children using two-dimensional speckle tracking echocardiography. J. Am. Soc. Echocardiogr. 2013, 26, 629–639. [Google Scholar] [CrossRef]
- Dallaire, F.; Slorach, C.; Bradley, T.; Hui, W.; Sarkola, T.; Friedberg, M.K.; Jaeggi, E.; Dragulescu, A.; Mahmud, F.H.; Daneman, D.; et al. Pediatric Reference Values and Z Score Equations for Left Ventricular Systolic Strain Measured by Two-Dimensional Speckle-Tracking Echocardiography. J. Am. Soc. Echocardiogr. 2016, 29, 786–793.e8. [Google Scholar] [CrossRef]
- Cantinotti, M.; Scalese, M.; Giordano, R.; Franchi, E.; Assanta, N.; Marotta, M.; Viacava, C.; Molinaro, S.; Iervasi, G.; Santoro, G.; et al. Normative Data for Left and Right Ventricular Systolic Strain in Healthy Caucasian Italian Children by Two-Dimensional Speckle-Tracking Echocardiography. J. Am. Soc. Echocardiogr. 2018, 31, 712–720. [Google Scholar] [CrossRef]
- Levy, P.T.; Sanchez Mejia, A.A.; Machefsky, A.; Fowler, S.; Holland, M.R.; Singh, G.K. Normal ranges of right ventricular systolic and diastolic strain measures in children: A systematic review and meta-analysis. J. Am. Soc. Echocardiogr. 2014, 27, 549–560, e3. [Google Scholar] [CrossRef]
- Marchese, P.; Scalese, M.; Giordano, R.; Assanta, N.; Franchi, E.; Koestenberger, M.; Ravaglioli, A.; Kutty, S.; Cantinotti, M. Pediatric ranges of normality for 2D speckle-tracking echocardiography atrial strain: Differences between p- and r-gating and among new (Atrial Designed) and conventional (Ventricular Specific) software’s. Echocardiography 2021, 38, 2025–2031. [Google Scholar] [CrossRef]
- Cantinotti, M.; Scalese, M.; Giordano, R.; Franchi, E.; Assanta, N.; Molinaro, S.; Iervasi, G.; Santoro, G.; Koestenberger, M.; Kutty, S. Left and right atrial strain in healthy caucasian children by two-dimensional speckle tracking echocardiography. J. Am. Soc. Echocardiogr. 2019, 32, 165–168.e3. [Google Scholar] [CrossRef]
- Ghelani, S.J.; Brown, D.W.; Kuebler, J.D.; Perrin, D.; Shakti, D.; Williams, D.N.; Marx, G.R.; Colan, S.D.; Geva, T.; Harrild, D.M. Left atrial volumes and strain in healthy children measured by three-dimensional echocardiography: Normal values and maturational changes. J. Am. Soc. Echocardiogr. 2018, 31, 187–193. [Google Scholar] [CrossRef]
- Kutty, S.; Padiyath, A.; Li, L.; Peng, Q.; Rangamani, S.; Schuster, A.; Danford, D.A. Functional Maturation of left and right atrial systolic and diastolic performance in infants, children, and adolescents. J. Am. Soc. Echocardiogr. 2013, 26, 398–409. [Google Scholar] [CrossRef]
- Available online: https://zscore.chboston.org/ (accessed on 10 October 2024).
- Available online: https://apkcombo.app/babynorm/org.mpsoftware.ParametersFree (accessed on 10 October 2024).
- Available online: www.parameterz.com/ (accessed on 10 October 2024).
- Available online: https://www.pediatricheartnetwork.org/z-scores-calculator/ (accessed on 10 October 2024).
- Ramlogan, S.; Aly, D.; France, R.; Schmidt, S.; Hinzman, J.; Sherman, A.; Goudar, S.P.; Forsha, D. Reproducibility and Intervendor Agreement of Left Ventricular Global Systolic Strain in Children Using a Layer-Specific Analysis. J. Am. Soc. Echocardiogr. 2020, 33, 110–119. [Google Scholar] [CrossRef]
- Romanowicz, J.; Ferraro, A.M.; Harrington, J.K.; Sleeper, L.A.; Adar, A.; Levy, P.T.; Powell, A.J.; Harrild, D.M. Pediatric Normal Values and Z Score Equations for Left and Right Ventricular Strain by Two-Dimensional Speckle-Tracking Echocardiography Derived from a Large Cohort of Healthy Children. J. Am. Soc. Echocardiogr. 2023, 36, 310–323. [Google Scholar] [CrossRef]
- Amedro, P.; Bredy, C.; Guillaumont, S.; De La Villeon, G.; Gamon, L.; Lavastre, K.; Meli, A.C.; Richard, S.; Cazorla, O.; Lacampagne, A.; et al. Speckle tracking echocardiography in healthy children: Comparison between the QLAB by Philips and the EchoPAC by General Electric. Int. J. Cardiovasc. Imaging 2019, 35, 799–809. [Google Scholar] [CrossRef]
- Ferraro, A.M.; Adar, A.; Ghelani, S.J.; Sleeper, L.A.; Levy, P.T.; Rathod, R.H.; Marx, G.R.; Harrild, D.M. Speckle tracking echocardiographically based analysis of ventricular strain in children: An intervendor comparison. Cardiovasc. Ultrasound 2020, 18, 15. [Google Scholar] [CrossRef]
- Available online: https://www.prisma-statement.org/ (accessed on 10 October 2024).
- Gherbesi, E.; Gianstefani, S.; Angeli, F.; Ryabenko, K.; Bergamaschi, L.; Armillotta, M.; Guerra, E.; Tuttolomondo, D.; Gaibazzi, N.; Squeri, A.; et al. Myocardial strain of the left ventricle by speckle tracking echocardiography: From physics to clinical practice. Echocardiography 2024, 41, e15753. [Google Scholar] [CrossRef]
- Hoit, B.D. Strain and strain rate echocardiography and coronary artery disease. Circ. Cardiovasc. Imaging 2011, 4, 179–190. [Google Scholar] [CrossRef]
- Negishi, K.; Negishi, T.; Kurosawa, K.; Hristova, K.; Popescu, B.A.; Vinereanu, D.; Yuda, S.; Marwick, T.H. Practical guidance in echocardiographic assessment of global longitudinal strain. JACC Cardiovasc. Imaging. 2015, 8, 489–492. [Google Scholar] [CrossRef]
- Palmer, C.; Truong, V.T.; Klas, B.; Wolking, S.; Ornella, A.; Young, M.; Ngo, T.N.M.; Tretter, J.T.; Nagueh, S.F.; Mazur, W. Left and right atrial speckle tracking:comparison of three methods of time reference gating. Echocardiography 2020, 37, 1021–1029. [Google Scholar] [CrossRef]
- Badano, L.P.; Kolias, T.J.; Muraru, D.; Abraham, T.P.; Aurigemma, G.; Edvardsen, T.; D’Hooge, J.; Donal, E.; Fraser, A.G.; Marwick, T.; et al. Standardization of left atrial, right ventricular, and right atrial deformation imaging using two-dimensional speckle tracking echocardiography: A consensus document of theEACVI/ASE/Industry Task Force to standardize deformation imaging. Eur. Heart J.-Cardiovasc. Imaging 2018, 19, 591–600. [Google Scholar] [CrossRef]
- Voigt, J.U.; Pedrizzetti, G.; Lysyansky, P.; Marwick, T.H.; Houle, H.; Baumann, R.; Pedri, S.; Ito, Y.; Abe, Y.; Metz, S.; et al. Definitions for a common standard for 2D speckle tracking echocardiography: Consensus document of the EACVI/ASE/Industry Task Force to standardize deformation imaging. J. Am. Soc. Echocardiogr. 2015, 28, 183–193. [Google Scholar] [CrossRef] [PubMed]
- Santens, B.; Van De Bruaene, A.; De Meester, P.; D’Alto, M.; Reddy, S.; Bernstein, D.; Koestenberger, M.; Hansmann, G.; Budts, W. Diagnosis and treatment of right ventricular dysfunction in congenital heart disease. Cardiovasc. Diagn. Ther. 2020, 10, 1625–1645. [Google Scholar] [CrossRef] [PubMed]
- Dorobantu, D.M.; Amir, N.H.; Wadey, C.A.; Sharma, C.; Stuart, A.G.; Williams, C.A.; Pieles, G.E. The Role of Speckle-Tracking Echocardiography in Predicting Mortality and Morbidity in Patients With Congenital Heart Disease: A Systematic Review and Meta-analysis. J. Am. Soc. Echocardiogr. 2024, 37, 216–225. [Google Scholar] [CrossRef]
- Baroutidou, A.; Ntiloudi, D.; Kasinos, N.; Nyktari, E.; Giannakoulas, G. Multi-modality imaging of the systemic right ventricle in congenital heart disease. Echocardiography 2024, 41, e15749. [Google Scholar] [CrossRef]
- Pelaia, G.; Concolino, D.; Sabatino, J. Left Atrial Strain in Cardiomyopathies and Congenital Heart Disease: A Call for Its Integration into Clinical Practice. J. Clin. Med. 2023, 12, 5084. [Google Scholar] [CrossRef]

| Author | Population | Measures | Software | Data Norm | Data Expression |
|---|---|---|---|---|---|
| Adar A 2019 USA [2] | n = 312 3 days–20.5 years | LV LS, CS, and synchrony | Echo: Philips Epiq Software: QLAB v.10.5 (Philips) | Age groups | Mean, SD |
| Harrington JK 2021 USA [4] | n = 577 1–18 years | LV SR | Echo: Philips Software: QLAB Version 5 (Philips) | Age | Z-scores |
| Koopman LP 2019 The Netherlands [7] | n = 103 Mean 10.8 years IQR 7.3–14.3 years | LV LS, CS | Echo: Philips IE33 Software: QLAB 9.0 (Philips) | Age groups | Mean, SD Percentiles |
| Romanowicz J 2023 USA [27] | n = 1032 <21 years old | LV and RV LS, LV CS | Echo: Philips Epiq Software: Autostrain, QLab 10.5 10.8 | Age | Mean, SD Z-scores |
| Kamel H 2022 Egypt [9] | n = 200 3.832 ± 1.522 years Range 0.1–5.9 years | LV GLS, GCS, GRS 2D and 3D | Echo: Vivid E9 (GE) Software: EchoPAC V113 (GE) | Age groups | Mean, SD |
| Kotby AA 2023, Egypt [5] | n = 250 1–16 years | LV LS | Echo: GE Software: EchoPAC v206 | Age groups | Mean, SD |
| Aristizábal-Duque CH 2022 Spain [10] | n = 156 6–17 years | LVGLS, RVGLS, RV free wall LS, LA | Echo: Philips IE33 Software: 13.0 of Qlab 13 (Philips) ° | Age groups, BSA | Mean, SD |
| Klistisic L, 2013 The Netherlands [14] | n = 183 0–19 years | LV LS, CS, RS | Echo: Vivid 7 GE Software: EchoPAC GE v206 | Age groups | Mean, SD |
| Marcus K, 2011 USA [13] | n = 144 0–19 years | LV LS, CS, RS | Echo: Vivid 7 GE Software: EchoPAC GE v206 | Age groups | Mean, SD |
| Zhang L, 2013 China [8] | n = 226 0–18 years | LV 3D STE LS, CS, RS | Echo: Philips IE33 Software: Tomtec 4D Cardio-View 3.0 | Age groups | Mean, SD |
| Cantinotti M, 2018 Italy [16] | n = 721 31 days–18 years | LV, LS, CS RV LS | Echo: Epiq/IE33 (Philips) Software: QLAB 9 Philips | Age groups, gender | Mean, SD |
| Dallaire F, 2016 Canada [15] | n = 233 1–18 years | LV LS, CS | Echo: Vivid 7 GE Software: EchoPAC GE 7 | BSA | Z-scores |
| Acheampong B, 2023 USA [1] | n = 142 0–18 years | LV LS, CS, RS | Echo: Philips and Siemens Software: Cardiac Performance Analysis version 3.0 * | Age groups | Percentiles |
| Author | Population | Measures | Software | Data Norm | Data Expression |
|---|---|---|---|---|---|
| Cantinotti M, Italy [18,19] | n = 836 31 days–18 years | 2D LA and RA strain | Echo: Epiq/IE33 (Philips) Software: QLAB) and QLAB 10 ° (Philips) | Age groups | Mean, SD |
| Ghelani S, 2013 USA [20] | n = 196 4 days–20.9 years | 3D LA volumes and strain | Echo: Philips IE33 Software: 4D LV Analysis, Tomtec 3.1 | Age | Z-scores |
| Kutty S 2013, USA [21] | n = 153 3–20 years | 2D LA and RA strain | Echo: GE Vivid 7, Software: EchoPAC Bt11 GE | Age groups | Mean, SD |
| Jimbo S 2020 Japan [3] | n = 112 (median 12.0 years; range 6–16 years) | 2D LA strain and SR | Echo: NR Software: Tomtec 2D CPA 1.2.2 | Age groups | Z-scores |
| Aristizábal-Duque CH 2022 Spain [10] | n = 156 6–17 years | LA | Echo: Philips IE33 Software: 13.0 of QLAB 13 (Philips) ° | Age groups, BSA | Mean, SD |
| Neonates | Infants | 1–5 Years | 5–10 Years | 10–14 Years | 14–18 Years | 18–21 Years | |
|---|---|---|---|---|---|---|---|
| Romanowicz J [27] LV GLS | |||||||
| QLAB 8 | −22 ± 3 | −23 ± 1 | −23 ± 2 | −23 ± 3 | −22 ± 3 | −21 ± 3 | −21 ± 4 |
| Autostrain | −21 ± 1 | −23 ± 3 | −25 ± 3 | −25 ± 3 | −24 ± 2 | −22 ± 3 | −23 ± 3 |
| LV GCS QLAB 8 | −27 ± 4 | −29 ± 4 | −32 ± 4 | −31 ± 3 | −30 ± 4 | −30 ± 4 | −29 ± 4 |
| Kamel H [9] GE EchoPAC | <1 year | >1≤2 years | >2≤3 years | >3≤4 years | >4≤5 years | >5≤6 years | |
| LV GLS 2D | −23.3 ± 7.3 | −24.5 ± 1.1 | −23.5 ± 0.5 | −22.3 ± 0.7 | −21.1 ± 0.7 | −19.9 ± 0.9 | |
| LV GCS 2D | −18.9 ± 0.9 | −19.1 ± 0.7 | −19.4 ± 1.3 | −18.7 ± 1.2 | −18.9 ± 0.9 | −19.0 ± 1.58 | |
| LV GRS 2D | 48.4 ± 2.7 | 44.5 ± 1.1 | 43.4 ± 0.8 | 42.4 ± 0.8 | 41.3 ± 0.8 | 40.0 ± 1.1 | |
| LV GLS 3D | −22.8 ± 2.8 | −20.9 ± 0.8 | −20.1 ± 0.8 | 19.2 ± 0.9 | |||
| LV GCS 3D | −14.6 ± 1.6 | −14 ± 2.2 | −13.7 ± 1.8 | −13.9 ± 2.4 | −13.9 ± 2.1 | ||
| LV GRS 3D | 50.4 ± 4.5 | 47.7 ± 2.1 | 46.8 ± 1.1 | 45.6 ± 1.5 | 47.21 ± 2.3 | ||
| Aristizábal-Duque [10] QLAB 13 | 6–9 years | 10–12 years | 12–17 years | ||||
| LV GLS | −27.3 ± 2.1 | −26.2 ± 2.7 | −23.3 ± 2.25 | ||||
| Klistisic L [14] | <1 year | 1–4 years | 5–9 years | 10–14 years | 15–19 years | ||
| LV GLS GE EchoPAC | −20.6 ± 3.1 | −23.6 ± 1.5 | −23.1 ± 2.2 | −21.8 ± 2.1 | −20.8 ± 1.8 | ||
| Zhang L [8] 3DSTE Philips/Tomtec | <1 year | 1–5 years | 5–9 years | 9–13 years | 13–18 years | ||
| GLS | −17.3 ± 2.3 | −17.3 ± 2.6 | −17.6 ± 2.2 | −18.7 ± 1.7 | −16.6 ± 2.8 | ||
| GCS | −16.8 ± 2.7 | −17.1 ± 3.2 | −17.6 ± 3.4 | −18.8 ± 3.3 | −16.3 ± 4.1 | ||
| GRS | 61.56 ± 18.8 | 60.3 ± 13.4 | 59.5 ± 13.3 | 64.6 ± 8.4 | 56.6 ± 14.9 | ||
| GS | −29.7 ± 4.5 | −30.1 ± 3.5 | −30.2 ± 3.6 | −31.5 ± 2.6 | −28.9 ± 4.5 | ||
| Cantinotti M [16] QLAB 8 | 31 days–24 months | 2–5 years | 5–11 years | 11–18 years | |||
| GLS | −26.0 ± 2.3 | −25.0 ± 2.2 | −24.7 ± 2.3 | −24.0 ± 2.3 | |||
| GCS | −24.6 ± 4.2 | −23.3 ± 4.3 | −24.5 ± 4.5 | −25.4 ± 4.2 | |||
| Romanowicz J [27] | Neonates | Infants | 1–5 Years | 5–10 Years | 10–14 Years | 14–18 Years | 18–21 Years |
|---|---|---|---|---|---|---|---|
| RV GLS | |||||||
| QLAB 8 | −24 ± 3 | −28 ± 5 | −30 ± 4 | −28 ± 4 | −27 ± 5 | −26 ± 3 | −27 ± 5 |
| Autostrain | −22 ± 2 | −24 ± 4 | −28 ± 3 | −26 ± 3 | −25 ± 4 | −23 ± 3 | −23 ± 4 |
| RV free wall | |||||||
| Autostrain | −25 ± 2 | −29 ± 5 | −32 ± 5 | −30 ± 4 | −29 ± 5 | −27 ± 4 | −27 ± 4 |
| Aristizábal-Duque [10] QLAB 13 | 6–9 years | 10–12 years | 12–17 years | ||||
| RV GLS | 28.7 ± 3.2 | 26.4 ± 4.2 | 24.9 ± 3.7 | ||||
| RV free wall | 32.6 ± 3.7 | 29.8 ± 4.3 | 28.3 ± 4.1 | ||||
| Cantinotti M [16] | 31 days to 24 months | 2–5 years | 5–11 years | 11–18 years | |||
| RVGLS | −25.4 ± 3.9 | −25.9 ± 4.0 | −25.8 ± 4.7 | −25.0 ± 4.1 |
| Author | Population | Measure | Software |
|---|---|---|---|
| Amedro P 2019 France [28] | Nr = 156 healthy 1 month–16.8 years. | LV and RV | GE (EchoPAC version 112) and Philips (QLAB 10) |
| Ramlogan S, 2019 USA [26] | 38 healthy 15 cardiomyopathies 1–18 years | LV LS, CS | GE EchoPAC and TomTec software 2D CPA 1.2.2, and TomTec at compressed rate |
| Romanowicz J 2023 USA [27] | Nr = 1032 healthy <21 years old | LV and RV LS, LV CS | Autostrain QLAB 8 and QLAB 5 |
| Ferraro A, 2020 USA [29] | Nr = 108 Group 1: healthy Group 2: ventricular paced rhythm Group 3: flattened IVS | LV LS, CS | QLAB (versions 10.5 and 10.8) Philips and TomTec |
| Aristizábal-Duque CH 2022 Spain [10] QLAB 13 | 6–9 yrs | 10–12 yrs | 10–17 yrs | |||
|---|---|---|---|---|---|---|
| LASr | 60.2 ± 9.4 | 57.6 ± 12.3 | 54.8 ± 9.5 | |||
| LAScd | 47.3 ± 8.9 | 43.9 ± 10.4 | 42.7 ± 8.9 | |||
| LASct | 13 ± 5.4 | 13.7 ± 5.6 | 12 ± 5.3 | |||
| Cantinotti M [18,19] QLAB Atrial Software Version 5 | 31 d to 24 mths | 2–5 yrs | 5–11 yrs | 11–18 yrs | ||
| RR LASr | 49.3 ± 15.0 | 54.2 ± 16.4 | 53.2 ± 15.7 | 50.5 ± 16.5 | ||
| PP LASr | 41.3 ± 10.9 | 47.4 ± 13.6 | 46.2 ± 13.2 | 44.4 ± 13.2 | ||
| RR LAScd | 31.5 ± 11.3 | 40.0 ± 14.0 | 39.5 ± 14.3 | 37.5 ± 13.5 | ||
| PP LAScd | 26.8 ± 9.7 | 35.2 ± 12.5 | 34.9 ± 12.9 | 33.4 ± 12.0 | ||
| RR LASct | 18.2 ± 9.4 | 14.3 ± 6.7 | 14.1 ± 6.2 | 13.2 ± 7.1 | ||
| PP LASct | 14.9 ± 6.3 | 12.2 ± 4.9 | 12.2 ± 4.7 | 11.4 ± 5.6 | ||
| RR RASr | 45.3 ± 16.4 | 49.1 ± 16.2 | 47.9 ± 17.2 | 48.0 ± 16.5 | ||
| PP RASr | 37.4 ± 11.8 | 41.5 ± 13.0 | 41.1 ± 13.8 | 41.5 ± 13.4 | ||
| RR RAScd | 25.2 ± 11.0 | 31.6 ± 13.9 | 32.2 ± 14.1 | 33.2 ± 13.3 | ||
| PP RAScd | 21.2 ± 10.4 | 27.3 ± 12.9 | 28.1 ± 12.7 | 29.0 ± 11.5 | ||
| RR RASct | 21.0 ± 11.4 | 17.9 ± 8.2 | 16.1 ± 8.2 | 15.4 ± 7.2 | ||
| PP RASct | 16.8 ± 7.7 | 14.8 ± 5.9 | 13.5 ± 6.1 | 13.1 ± 5.6 | ||
| QLAB Ventricular Software Version 5 | ||||||
| RR LASr conv meth | 52.2 ± 9.3 | 55.1 ± 9.9 | 58.2 ± 10.2 | 57.2 ± 10.5 | ||
| RR LASct conv meth | 14.6 ± 6.5 | 12.2 ± 6.0 | 14.1 ± 7.2 | 15.1 ± 7.1 | ||
| RR RASr conv met | 46.1 ± 8.9 | 48.5 ± 10.5 | 50.9 ± 10.8 | 51.4 ± 10.7 | ||
| RR RASct conv meth | 11.7 ± 6.1 | 11.6 ± 5.7 | 11.9 ± 6.3 | 12.9 ± 5.4 | ||
Disclaimer/Publisher’s Note: The statements, opinions and data contained in all publications are solely those of the individual author(s) and contributor(s) and not of MDPI and/or the editor(s). MDPI and/or the editor(s) disclaim responsibility for any injury to people or property resulting from any ideas, methods, instructions or products referred to in the content. |
© 2025 by the authors. Licensee MDPI, Basel, Switzerland. This article is an open access article distributed under the terms and conditions of the Creative Commons Attribution (CC BY) license (https://creativecommons.org/licenses/by/4.0/).
Share and Cite
Cantinotti, M.; Capponi, G.; Marchese, P.; Franchi, E.; Santoro, G.; Assanta, N.; Gowda, K.; Kutty, S.; Giordano, R. Normal Values for Speckle-Tracking Echocardiography in Children: A Review, Update, and Guide for Clinical Use of Speckle-Tracking Echocardiography in Pediatric Patients. J. Clin. Med. 2025, 14, 1090. https://doi.org/10.3390/jcm14041090
Cantinotti M, Capponi G, Marchese P, Franchi E, Santoro G, Assanta N, Gowda K, Kutty S, Giordano R. Normal Values for Speckle-Tracking Echocardiography in Children: A Review, Update, and Guide for Clinical Use of Speckle-Tracking Echocardiography in Pediatric Patients. Journal of Clinical Medicine. 2025; 14(4):1090. https://doi.org/10.3390/jcm14041090
Chicago/Turabian StyleCantinotti, Massimiliano, Guglielmo Capponi, Pietro Marchese, Eliana Franchi, Giuseppe Santoro, Nadia Assanta, Kritika Gowda, Shelby Kutty, and Raffaele Giordano. 2025. "Normal Values for Speckle-Tracking Echocardiography in Children: A Review, Update, and Guide for Clinical Use of Speckle-Tracking Echocardiography in Pediatric Patients" Journal of Clinical Medicine 14, no. 4: 1090. https://doi.org/10.3390/jcm14041090
APA StyleCantinotti, M., Capponi, G., Marchese, P., Franchi, E., Santoro, G., Assanta, N., Gowda, K., Kutty, S., & Giordano, R. (2025). Normal Values for Speckle-Tracking Echocardiography in Children: A Review, Update, and Guide for Clinical Use of Speckle-Tracking Echocardiography in Pediatric Patients. Journal of Clinical Medicine, 14(4), 1090. https://doi.org/10.3390/jcm14041090