Abstract
Background/Objectives: Exercise capacity and patient prognosis are heavily influenced by comorbidities. However, the specific impact of individual comorbid conditions on objective measures of exercise performance remains insufficiently characterized. The study aimed to identify predictors of reduced physical capacity in patients qualified for cardiac rehabilitation. Methods: A single-center retrospective analysis was conducted on 518 patients qualified for cardiac rehabilitation. After excluding 51 post-cardiac surgery patients, cardiopulmonary exercise testing data from 425 patients (316 men, median age 63 years) were analyzed. Comorbidities data, peak oxygen uptake (peak VO2), and the ventilation-to-carbon dioxide output slope (VE/VCO2 slope) were evaluated. Results: A significantly reduced exercise capacity (peak VO2 < 70% of the predicted value) was observed in 29.4% of patients, while an increased VE/VCO2 slope (≥36) was noted in 20.8% of patients. Univariate logistic regression identified sex, heart failure, valvular disease, peripheral artery disease, diabetes mellitus (T2DM), chronic kidney disease (CKD), Charlson Comorbidity Index (CCI), left ventricular ejection fraction <50%, diastolic dysfunction, and anemia as predictors of both reduced peak VO2 and a steeper VE/VCO2 slope. Multivariate regression analysis further identified T2DM and CKD as independent predictors of reduced peak VO2, while sex, CKD, and CCI were independent predictors of a steeper VE/VCO2 slope. Conclusions: Among patients qualified for cardiac rehabilitation, patient’s sex, T2DM, CKD, and the CCI emerged as key predictors of reduced exercise capacity. Reduced peak VO2 was more commonly observed in men, while women more frequently exhibited a steeper VE/VCO2 slope, indicating potential sex-related physiological mechanisms influencing exercise performance.
1. Introduction
Reduced exercise capacity is a common manifestation of cardiovascular diseases and other conditions, such as obesity or diabetes, which can potentially influence cardiovascular performance. The patient’s prognosis and exercise capacity are determined by the presence and nature of concomitant conditions [1], with the prognosis considerably worsened by a sedentary lifestyle and little exercise [2]. The effect of multimorbidity on survival rate is commonly assessed with the Charlson Comorbidity Index (CCI) [3], which has proved its prognostic usefulness in patients with such conditions as coronary artery disease (CAD) [4] and pulmonary embolism [5], and those with a history of myocardial infarction [6].
Exercise capacity is determined both by cardiovascular function and the synergy of the respiratory system, skeletal muscles, oxygen-transporting mechanisms, and metabolic processes [7]. A cardiopulmonary exercise test (CPET) helps objectively assess the patient’s exercise capacity by measuring peak oxygen consumption (peak VO2), identifying the causes of dyspnea and limited exercise tolerance, and providing parameters of proven prognostic value, such as ventilation-to-carbon dioxide output slope (VE/VCO2 slope). Peak VO2 is an established indicator of physical exercise capacity and a predictor of mortality [8], whereas VE/VCO2 slope, which is a marker of ineffective ventilation, is considered to be primarily a prognostic parameter [9,10,11,12,13]. In patients with CAD, a peak VO2 below 12 mL/min/kg for females and 15 mL/min/kg for males was shown to be associated with the highest annual all-cause mortality [8]. The VE/VCO2 slope, on the other hand, was demonstrated to be associated with the prognosis in patients with heart failure (HF) or pulmonary hypertension. Studies showed various VE/VCO2 slope thresholds (>34, >36, ≥39.3) for increased mortality or risk of hospitalization (≥32.9) in patients with HF [9,10,14]. Peak VO2 is a predictor of both the absolute risk of death and the percentage changes in mortality dependent on the age, weight, height, and sex [8]. Conversely, an absolute VE/VCO2 slope is interpreted irrespective of other variables [9,10,11,12,13].
There have been no comprehensive data on the association between peak VO2 and VE/VCO2 slope on one hand and the burden of comorbidities on the other in patients undergoing eligibility evaluation for cardiac rehabilitation. Existing protocols often do not sufficiently consider the impact of comorbidities and sex-related physiological differences on exercise capacity. The challenge remains to design for patients with comorbidities, e.g., diabetes mellitus [14], chronic kidney disease (CKD) [15], or atrial fibrillation [16]. Identifying predictors of reduced exercise capacity (expressed in the form of abnormal prognostic indicators) may be of significance in optimizing cardiac rehabilitation as a form of a holistic, comprehensive approach. Therefore, this has become the purpose of our study.
2. Materials and Methods
2.1. Study Population
A single-center retrospective analysis was conducted on the patients found eligible for cardiac rehabilitation between February 2022 and March 2024. We analyzed a data registry of 518 patients and excluded 42 patients who did not undergo CPET, irrespective of the reason, and 51 patients after cardiothoracic surgery due to an acute, temporary condition after surgery, e.g., pleural effusion or restricted breathing due to pain in the sternum. The study population selected in this manner was stratified by exercise capacity and VE/VCO2. The subgroup with good exercise capacity (n = 298) had peak VO2 ≥ 70% of the predicted value, and another, with significantly reduced exercise capacity (n = 124), had peak VO2 < 70% of the predicted value. The VE/VCO2 slope of ≥ 36 identified patients with ineffective ventilation (n = 87), in contrast to those with a normal index of ventilatory response to exercise (VE/VCO2 slope < 36, n = 331).
2.2. Clinical Parameters
Our analysis included data from medical records, such as history of comorbidities, symptoms (including reduced exercise tolerance, dyspnea severity classified with the New York Heart Association (NYHA) classification, and chest pain classified with the Canadian Cardiovascular Society angina scoring system), and medications. The patients’ resting blood pressure, resting heart rate, height, and body weight were measured, and the body mass index (BMI) was calculated. Peripheral venous blood samples were tested for routine parameters (hemoglobin, creatinine, urea, serum lipid, and blood glucose levels). Anemia was defined as hemoglobin levels below 12 g/dL [17]. Estimated glomerular filtration rate (eGFR) was calculated with the Cockcroft–Gault formula. The CKD was defined as having at least a 3-month history of low eGFR (<60 mL/min/1.73 m2) or an earlier diagnosis.
The CCI was calculated with the use of a CCI calculator [18].
The data on the left ventricular (LV) ejection fraction, LV diastolic dysfunction, and valvular heart disease were obtained from the results of previous inpatient echocardiography (which took place prior to cardiac rehabilitation eligibility assessment, during percutaneous coronary intervention eligibility assessment, or during decompensated HF). Significant valvular disease was considered at least moderate aortic, mitral, or tricuspid insufficiency or stenosis.
2.3. Cardiopulmonary Exercise Test
The CPET was conducted with the use of an Ergoselect cycle ergometer (Geratherm Respiratory GmbH; Bitz, Germany) according to an individualized ramp protocol, in which the target load (calculated with the Wasserman formula [19]) was planned to be reached at minute 10 of exercise. The patient maintained a pedaling cadence of 60–65 revolutions per minute. The test was stopped at the onset of symptoms (fatigue, angina, dyspnea) or at the patient’s request. Continuous analysis of respiratory gases (oxygen and carbon dioxide), preceded by gas calibration prior to each test, was conducted with a CORTEX system (Biophysik GmbH; Leipzig, Germany). Patient monitoring during the CPET included continuous 12-lead electrocardiography and automated blood pressure and oxygen saturation measurements during the 1.5-minute rest period just before the test, during exercise, and during the subsequent 6-minute active rest period. Peak VO2 (mL/kg/min) was defined as the mean of the highest 30-second VO2 values obtained during exercise. The predictive value of peak VO2 was calculated with the Hansen formula [20]. For the purpose of our study, a peak VO2 of ≥70% of the predicted value was defined as good exercise capacity (combining the categories of normal exercise capacity of ≥85% of predicted and mildly reduced exercise capacity of ≥70% of predicted), whereas a peak VO2 of <70% of the predicted value was considered to indicate significant (moderate to severe) reduction in exercise tolerance [21]. The VE/VCO2 slope was calculated with linear regression between VE and VCO2 in the period between the first minute of exercise and the end of the isocapnic buffering phase (the second anaerobic threshold) [19]. A VE/VCO2 slope of ≥36 was considered to be significantly elevated. All patients had provided their written consent to undergo a CPET.
2.4. Six-Minute Walk Test
A 6-minute walk test (6MWT) was conducted in accordance with the 2002 guidelines of the American Thoracic Society [22]. The patients were instructed to walk as quickly as they could along a 30 m corridor marked every 5 m. We analyzed the results of the second 6MWT, performed 2–3 days after CPET. The total distance covered during 6 min (6MWTd) was rounded to 2 m. The obtained absolute values were expressed as a proportion of the predicted 6MWTd values, calculated individually for each patient based on the reference equations introduced by Enright [23].
2.5. Statistical Analysis
Statistical analysis was performed using Statistica software, version 12.0 (TIBCO Software Inc., Palo Alto, CA, USA). After normality inspection (Shapiro–Wilk test), the quantitative variables were presented as medians and interquartile ranges (IQRs), while categorical variables were presented as numbers and percentages. Differences between subgroups stratified by exercise capacity (peak VO2 <70% vs. ≥70% of predicted) and ventilatory efficiency (VE/VCO2 slope ≥36 vs. <36) were assessed using the Mann–Whitney U test for continuous variables and the chi2 test for categorical variables.
Univariate logistic regression models were used to identify variables associated with significantly reduced peak VO2 and elevated VE/VCO2 slope. The most representative variables with a p-value < 0.100 in univariate analyses were considered for multivariate models. Collinearity diagnostics (VIF, variance inflation factors) were performed for all candidate variables before entering them into multivariate models. Multivariate logistic regression was performed to determine independent predictors of both reduced peak VO2 and steeper VE/VCO2 slope. The results were expressed as odds ratios (ORs) with 95% confidence intervals (CIs). A two-tailed p-value < 0.05 was considered statistically significant.
3. Results
3.1. Baseline Characteristics
Exercise capacity was assessed with the CPET in 425 patients (including 316 men), whose median age was 63 years (56–70 years). The most common comorbidities were CAD (98.1%), including status post percutaneous coronary intervention (PCI, 97.4%), non-ST-elevation myocardial infarction (47.8%), and ST-elevation myocardial infarction (24.7%)—Figure 1.
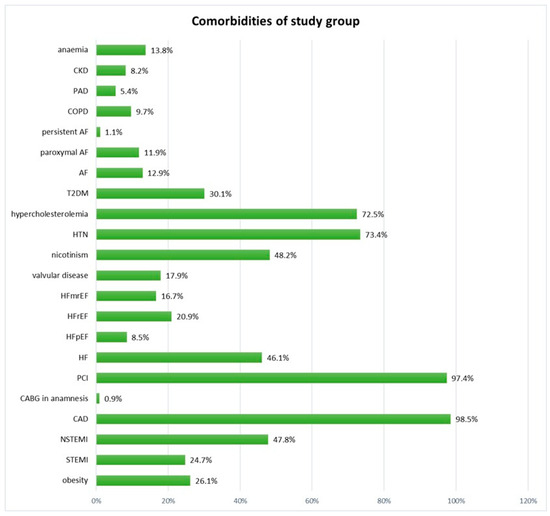
Figure 1.
Comorbidities in the study group. Figure Legend: AF—atrial fibrillation; CAD—coronary artery disease; CABG—coronary artery bypass grafting; CKD—chronic kidney disease; COPD—chronic obstructive pulmonary disease; T2DM—type 2 diabetes mellitus; HF—heart failure; HFmrEF—heart failure with mid-range ejection fraction; HFpEF—heart failure with preserved ejection fraction; HFrEF—heart failure with reduced ejection fraction; HTN—hypertension; NSTEMI—non-ST-elevation myocardial infarction; PAD—peripheral artery disease; PCI—percutaneous coronary intervention; STEMI—ST-elevation myocardial infarction.
The median peak VO2 was 17 (14–22) mL/min/kg, which constituted 78% (67–89%) of the predicted value. The median VE/VCO2 slope was 31.2 (27.6–35.3). A total of 281 patients (66.6%) had peak VO2 ≥ 85% of predicted value. The median (Q1–Q3) predictive value of 6MWT distance was higher than the median predictive value of VO2 (99.8% vs. 78%, respectively). On the other hand, fewer patients had a 6MWT ≥ 100% (208) than had a VO2 > 85% (281). A significantly reduced exercise capacity was observed in 29.4% of patients, while an increased VE/VCO2 slope was noted in 20.8%—Table 1.

Table 1.
Baseline characteristics of the study group.
The median 6MWT distance was 555 m (488–611 m), 99.8% of predicted, with 208 patients (50.4%) achieving a 6MWT distance above the predicted values—Table 1.
3.2. Comparison Between Patients with and Without an Increased VE/VCO2 Slope and Between Patients with and Without Significantly Reduced Peak VO2
In comparison with patients with a VE/VCO2 slope of <36, the subgroup with a higher VE/VCO2 slope comprised a greater proportion of males (p = 0.007), presented lower systolic pressure (p = 0.015), higher resting heart rate (p < 0.0001), lower LV ejection fraction (p < 0.0001), lower hemoglobin level (p = 0.002), lower eGFR (p = 0.0002), and higher CCI (p < 0.0001). A higher proportion of patients with a steeper VE/VCO2 slope reported more severe dyspnea (higher NYHA class, p < 0.0001), HF (p < 0.0001), LV ejection fraction < 50% (p < 0.0001), LV diastolic dysfunction (p < 0.0001), CKD (p < 0.0001), valvular disease (p < 0.0001), T2DM (p < 0.0001), anemia (p = 0.003), and peripheral artery disease (PAD, p = 0.003)—Table 2.
Table 2.
Comparison between the subgroups: VE/VCO2 slope < 36 vs. VE/VCO2 slope ≥ 36 and between the subgroups: peak VO2 ≥ 70% of predicted vs. peak VO2 < 70% of predicted.
In comparison with patients with a peak VO2 ≥ 70%, the subgroup with VO2 of < 70% comprised a greater proportion of males (p = 0.014), presented lower systolic pressure (p = 0.008), lower LV ejection fraction (p < 0.0001), lower hemoglobin level (p = 0.042), lower eGFR (p = 0.0003), and higher CCI (p = 0.0004). A higher proportion of patients with a steeper VE/VCO2 slope reported more severe dyspnea (higher NYHA class, p = 0.019), HF (p < 0.0001), LVEF < 50% (p < 0.0001), LV diastolic dysfunction (p = 0.002), CKD (p < 0.0001), valvular disease (p < 0.0001), T2DM (p = 0.0008), anemia (p = 0.019), and peripheral artery disease (PAD, p = 0.003)—Table 2.
Significantly reduced exercise capacity (peak VO2 < 70%) was detected in 20.2% of women in comparison with 32.6% of men (p = 0.0014), and a VE/VCO2 slope ≥ 36 was detected in 29.9% of women in comparison with 17.7% of males (p = 0.007). It indicates that women present more frequently with impaired ventilation, while less frequently with poor exercise capacity.
3.3. Predictors of Increased VE/VCO2 Slope
The risk of a steeper VE/VCO2 slope was nearly three times higher in women than in men (1/0.36 = 2.8). Another independent predictor was CKD (OR = 3.6) and the CCI score (OR = 1.5 times per point)—Table 3, Figure 2. A univariate logistic regression analysis also identified other factors as predictors of a steeper VE/VCO2 slope: HF, valvular disease, PAD, T2DM, LV ejection fraction <50%, LV diastolic dysfunction, and anemia.
Table 3.
Predictors of VE/VCO2 slope ≥36 and peak VO2 <70% of predicted value (logistic regression).
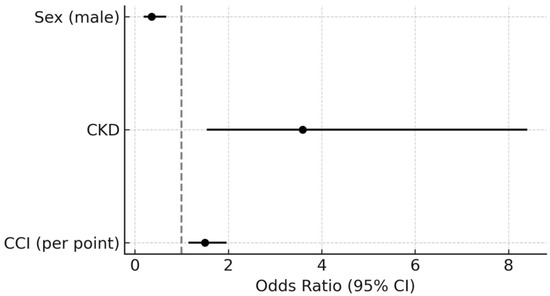
Figure 2.
Independent predictors of VE/VCO2 slope ≥36.
3.4. Predictors of Significantly Reduced Peak VO2
A univariate logistic regression analysis identified the following variables as predictors of reduced peak VO2: HF, valvular disease, PAD, T2DM, history of CKD, CCI score, LV ejection fraction <50%, LV diastolic dysfunction, and anemia—Table 3. A multivariate logistic regression analysis showed T2DM (OR = 2.3) and CKD (OR = 3.2) to be independent predictors of low peak VO2—Figure 3.
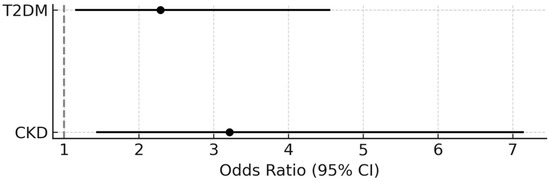
Figure 3.
Independent predictors of peak VO2 < 70% of predicted value.
4. Discussion
In this single-center cohort of patients qualified for cardiac rehabilitation, we found that nearly one-third of individuals exhibited significantly reduced exercise capacity, while over one-fifth presented with abnormal ventilatory efficiency. Importantly, impaired exercise performance, as reflected by reduced peak VO2 and elevated VE/VCO2 slope, was associated with a cluster of comorbidities, including heart failure, diabetes mellitus, chronic kidney disease, and anemia, as well as a high burden of comorbidity quantified by the CCI. Notably, while men were more likely to exhibit reduced peak VO2, women more frequently presented with ventilatory inefficiency, suggesting sex-related physiological differences in cardiopulmonary adaptation.
Our study group of patients eligible for cardiac rehabilitation comprised mostly patients with CAD (98.5%), nearly half of whom had been diagnosed with HF (46.1%). Over half of our study population (52.9%) reported exercise intolerance. As the reported symptoms were being verified via CPET, nearly one-third (29.4%) of patients exhibited substantially (moderately or severely) reduced exercise capacity, with an increased VE/VCO2 slope (ventilatory class ≥ 2) in one-fifth (20.8%) of patients. Several studies have shown correlations of distance 6MWT with peak VO2 in CPET [24]. On the other hand, the discrepancy in the number of patients who achieve >100% and the median predictive value of 6MWT and VO2 emphasizes that these tests cannot be treated interchangeably. Given the high burden of cardiac disease, frequent presence of exercise intolerance, and the objective verification by CPET, this cohort represented a clinically relevant and appropriate population for evaluating the determinants of reduced functional capacity.
4.1. Exercise Capacity Parameters and Sex
Patients’ sex was a predictor of low peak VO2 and high VE/VCO2 slope values in univariate analysis and of high VE/VCO2 slope values also in multivariate analysis. Importantly, the distribution of sex differed between these two subgroups, with reduced peak VO2 more commonly observed in men and an elevated VE/VCO2 slope more frequently seen in women. This is consistent with previous reports, which indicated a relationship between the VE/VCO2 slope and both sex and age in a population of healthy individuals [25,26,27] and in individuals with HF [26,28]. It was demonstrated that the VE/VCO2 slope was steeper by approximately 2 degrees in healthy women than in healthy men [26,28].
The VE/VCO2 slope is an expression of both cardiovascular and respiratory function [28,29] and it illustrates ventilatory efficiency [28]. The slope becomes steeper when minute ventilation increases disproportionately to the amount of exhaled CO2, for instance, in situations where there is a diffusion barrier for CO2 in the form of pulmonary congestion or in cases of hyperventilation. Women have been reported to exhibit better exercise capacity than men despite having a steeper VE/VCO2 slope, a finding that did not necessarily correlate with poorer prognosis [30,31,32]. We hypothesize that in women, the steeper VE/VCO2 slope is associated with hyperventilation, for example, triggered by emotions or anxiety. In men, the VE/VCO2 slope reflects the cause of reduced peak VO2. Further research in this area is necessary.
It is worth noting that low peak VO2 values may coexist with an elevated VE/VCO2 slope, which was demonstrated in earlier reports [33,34]. In our study, the features related to low peak VO2 and a steep VE/VCO2 slope were comparable: more pronounced dyspnea (NYHA class II and III), higher prevalence of heart failure, LV systolic and diastolic dysfunction, chronic kidney disease, type 2 diabetes mellitus, anemia, peripheral artery disease, and valvular heart disease, as well as elevated comorbidity burden reflected by higher CCI scores. Also, consistent with other expert reports [35], we demonstrated that patients with a steeper VE/VCO2 slope have a higher resting heart rate.
4.2. Comorbidities Burden as a Determinant of Exercise Capacity and Ventilation
The group of patients evaluated in our study was characterized by high rates of multimorbidity, with the median CCI score of four points, which yields an estimated 10-year survival of 53% [18]. The higher the CCI score, the greater the risk of developing LV systolic and diastolic dysfunction and HF and, consequently, low exercise capacity and a steeper VE/VCO2 slope.
Martens et al. reported a relationship between an elevated VE/VCO2 slope with low peak VO2 and comorbidity in people with HF [1]. Those authors also observed different prognostic effects of peak VO2 and VE/VCO2 slope depending on the type of comorbidities. The highest mortality was reported in a subgroup with low peak VO2 (13.9 ± 4.1 mL/min/kg) and the steepest VE/VCO2 slope (35.8 ± 9.3), whereas no correlation with mortality was observed in patients with both a non-elevated VE/VCO2 slope (34.1 ± 8.8) and the lowest peak VO2 (13.3 ± 4.01 mL/min/kg) [1].
Common comorbidities affecting cardiovascular patients (e.g., obesity, T2DM, and CKD) damage internal organs, including the heart and blood vessels. In our cohort, patients with a low peak VO2 and an elevated VE/VCO2 slope had higher rates of low eGFR, CKD, PAD, low hemoglobin levels, and anemia. A steeper VE/VCO2 slope was shown to be more likely in patients with concomitant anemia, which—although not directly associated with LV systolic or diastolic dysfunction—has been documented to be relevant in patients with HF [35].
Left ventricular diastolic dysfunction and at least moderate valvular disease (mitral or tricuspid insufficiency) were predictors of both a peak VO2 of <70% of predicted and a VE/VCO2 slope of ≥36. The relationship between either LV diastolic dysfunction [36,37] or mitral insufficiency [38] and a steeper VE/VCO2 slope has been attributed to lower cardiac output and increased pulmonary artery wedge pressure on exertion, which adversely affected exercise capacity and peak VO2. Exercise-exacerbated LV diastolic dysfunction is of great clinical significance in HF with preserved ejection fraction manifesting with ventilatory insufficiency, not demonstrated in assessments at rest [35].
We also observed T2DM to be an independent risk factor for significantly lowered peak VO2 (OR 2.29; 95% CI 1.15–4.56; p = 0.018). This may be caused by, i.e., myocardial systolic dysfunction or impaired oxygen extraction by skeletal muscles [33,34]. Moreover, as reported previously, patients with T2DM and reduced exercise capacity (peak VO2 < 80%) present a lower increase in global longitudinal strain (GLS) assessed echocardiographically during exercise (1.9 ± 2.5% vs. 5.9 ± 4.1%, p = 0.004) [39].
Although different position statements allow for planning cardiac rehabilitation training based on different parameters [40], our results indicate the usefulness of CPET assessment, especially in patients with T2DM, CKD, and multimorbidity. Designing training using methods other than CPET oxygen thresholds may lead diabetic patients to exercise at too high an intensity, promoting adverse effects [14]. A different chronotropic response in patients with atrial fibrillation also indicates that CPET is more useful than heart rate assessment [16]. Reduced peak VO2 and a steeper VE/VCO2 slope associated with metabolic abnormalities and overhydration in CKD also highlight challenges in developing cardiac rehabilitation training. The best results in improving performance in CKD were obtained by conducting CR based on the second oxygen threshold also [15].
4.3. Limitations
Our study was retrospective in nature, and the analysis was based on data from a single center. Moreover, echocardiography assessments were performed at various labs by cardiologists of varied experience levels, who did not follow a homogeneous examination protocol. Some of the evaluated records were incomplete; however, this was so rare that the risk of it affecting the results of this study is relatively low. Due to the lack of data, it was impossible to assign three patients to the comparative analysis according to peak VO2 and seven patients to the analysis according to VE/VCO2 slope.
We observed no differences between the peak VO2 and VE/VCO2 slope subgroups in terms of either age or the rates of obesity, CAD, hypertension, atrial fibrillation, or COPD. This discrepancy in comparison with previous reports [1,32] may be due to a small sample size in our study, pre-CPET use of bronchodilators in some patients, and a relatively low proportion of patients with obesity (median BMI 27.5 kg/m2).
5. Conclusions
Among patients qualified for cardiac rehabilitation, patient’s sex, T2DM, CKD, and the CCI score emerged as key predictors of reduced exercise capacity. Reduced peak VO2 was more frequently observed in men, whereas an elevated VE/VCO2 slope was more prevalent in women, suggesting potential sex-specific physiological responses. These findings underscore the need for exercise assessment by CPET in all patients in order to design the best tailored rehabilitation approach, taking into account specific clinical profiles and functional limitations.
Author Contributions
Conceptualization, M.K., P.K., and K.P.; methodology, M.K. and P.K.; software, M.K.; validation, P.K.; formal analysis, M.K. and P.K.; investigation, M.K.; resources, M.K.; data curation, M.K. and M.B.; writing—original draft preparation, M.K.; writing—review and editing, M.K., P.K., M.B., and K.P.; visualization, M.K.; supervision, P.K.; project administration, M.K.; funding acquisition, P.K. All authors have read and agreed to the published version of the manuscript.
Funding
The study was funded by the Ministry of Science and Higher Education/Military Institute of Medicine, National Research Institute, Warsaw, Poland (scientific grant no. 674/WIM).
Institutional Review Board Statement
The study was conducted in accordance with the Declaration of Helsinki and approved by the Ethics Committee of the Military Institute of Medicine—National Research Institute (Resolution 32/24 from 19 June 2024).
Informed Consent Statement
Patient consent was waived due to retrospective analysis.
Data Availability Statement
The datasets presented in this article are not readily available because the data is covered by traditional medical confidentiality. Requests to access the datasets should be directed to the Military Institute of Medicine—National Research Institute.
Acknowledgments
I would like to thank all members of the rehabilitation department team for their professional care of patients.
Conflicts of Interest
The authors declare no conflicts of interest.
Abbreviations
The following abbreviations are used in this manuscript:
| 6MWT | 6-minute walk test |
| 6MWTd | distance covered during 6-minute walk test |
| BMI | body mass index |
| CAD | coronary artery disease |
| CCI | Charlson Comorbidity Index |
| CI | confidence interval |
| CKD | Chronic kidney disease |
| CPET | cardiopulmonary exercise test |
| eGFR | estimated glomerular filtration rate |
| GLS | global longitudinal strain |
| HF | heart failure |
| IQR | interquartile range |
| LV | left ventricular |
| NYHA | New York Heart Association |
| OR | odds ratio |
| PAD | peripheral artery disease |
| PCI | percutaneous coronary intervention |
| T2DM | type 2 diabetes mellitus |
| VE/VCO2 | slope ventilation-to-carbon dioxide output slope |
| VO2 | oxygen consumption |
References
- Martens, P.; Augusto, S.N.; Finet, J.E., Jr.; Tang, W.H.W. Distinct Impact of Noncardiac Comorbidities on Exercise Capacity and Functional Status in Chronic Heart Failure. JACC Heart Fail. 2023, 11, 1365–1376. [Google Scholar] [CrossRef] [PubMed]
- Lee, D.C.; Lavie, C.J.; Sui, X.; Blair, S.N. Running and Mortality: Is More Actually Worse? Mayo Clin. Proc. 2016, 91, 534–536. [Google Scholar] [CrossRef] [PubMed]
- Hautamäki, M.; Lyytikäinen, L.P.; Mahdiani, S.; Eskola, M.; Lehtimäki, T.; Nikus, K.; Antila, K.; Oksala, N.; Hernesniemi, J. The association between charlson comorbidity index and mortality in acute coronary syndrome—The MADDEC study. Scand. Cardiovasc. J. 2020, 54, 146–152. [Google Scholar] [CrossRef]
- Karabağ, T.; Altuntaş, E.; Kalaycı, B.; Şahin, B.; Somuncu, M.U.; Çakır, M.O. The relationship of Charlson comorbidity index with stent restenosis and extent of coronary artery disease. Interv. Med. Appl. Sci. 2018, 10, 70–75. [Google Scholar] [CrossRef]
- Ho, T.A.; Lio, K.U.; Patel, P.; Wang, Y.; Arshad, H.; Li, S.; Rali, P. Comorbidity profiles and pulmonary embolism risk assessment: Leveraging the Charlson Comorbidity Index for improved prognostication in a national data set. Pulm. Circ. 2024, 14, e70010. [Google Scholar] [CrossRef]
- Lin, H.; Xi, Y.B.; Yang, Z.C.; Tong, Z.J.; Jiang, G.; Gao, J.; Kang, B.; Ma, Y.; Zhang, W.; Wang, Z.H. Optimizing Prediction of In-Hospital Mortality in Elderly Patients with Acute Myocardial Infarction: A Nomogram Approach Using the Age-Adjusted Charlson Comorbidity Index Score. J. Am. Heart Assoc. 2024, 13, e032589. [Google Scholar] [CrossRef]
- Górski, J. Fizjologiczne Podstawy Wysiłku Fizycznego; PWN: Warsaw, Poland, 2023. [Google Scholar]
- Keteyian, S.J.; Brawner, C.A.; Savage, P.D.; Ehrman, J.K.; Schairer, J.; Divine, G.; Aldred, H.; Ophaug, K.; Ades, P.A. Peak aerobic capacity predicts prognosis in patients with coronary heart disease. Am. Heart J. 2008, 156, 292–300. [Google Scholar] [CrossRef]
- Guazzi, M.; Arena, R.; Halle, M.; Piepoli, M.F.; Myers, J.; Lavie, C.J. 2016 Focused Update: Clinical Recommendations for Cardiopulmonary Exercise Testing Data Assessment in Specific Patient Populations. Circulation 2016, 133, e694–e711. [Google Scholar] [CrossRef]
- Francis, D.P.; Shamim, W.; Davies, L.C.; Piepoli, M.F.; Ponikowski, P.; Anker, S.D.; Coats, A.J. Cardiopulmonary exercise testing for prognosis in chronic heart failure: Continuous and independent prognostic value from VE/VCO2slope and peak VO2. Eur. Heart J. 2000, 21, 154–161. [Google Scholar] [CrossRef] [PubMed]
- Wagner, J.; Agostoni, P.; Arena, R.; Belardinelli, R.; Dumitrescu, D.; Hager, A.; Myers, J.; Rauramaa, R.; Riley, M.; Takken, T.; et al. The Role of Gas Exchange Variables in Cardiopulmonary Exercise Testing for Risk Stratification and Management of Heart Failure with Reduced Ejection Fraction. Am. Heart J. 2018, 202, 116–126. [Google Scholar] [CrossRef]
- Shen, Y.; Zhang, X.; Ma, W.; Song, H.; Gong, Z.; Wang, Q.; Che, L.; Xu, W.; Jiang, J.; Xu, J.; et al. VE/VCO2 slope and its prognostic value in patients with chronic heart failure. Exp. Ther. Med. 2015, 9, 1407–1412. [Google Scholar] [CrossRef]
- Malhotra, R.; Bakken, K.; D’Elia, E.; Lewis, G.D. Cardiopulmonary Exercise Testing in Heart Failure. JACC Heart Fail. 2016, 4, 607–616. [Google Scholar] [CrossRef] [PubMed]
- Kosinski, C.; Besson, C.; Amati, F. Exercise Testing in Individuals with Diabetes, Practical Considerations for Exercise Physiologists. Front. Physiol. 2019, 10, 1257. [Google Scholar] [CrossRef]
- Hayden, C.M.; Begue, G.; Gamboa, J.L.; Baar, K.; Roshanravan, B. Review of Exercise Interventions to Improve Clinical Outcomes in Nondialysis CKD. Kidney Int. Rep. 2024, 9, 3097–3115. [Google Scholar] [CrossRef]
- Cersosimo, A.; Longo Elia, R.; Condello, F.; Colombo, F.; Pierucci, N.; Arabia, G.; Matteucci, A.; Metra, M.; Adamo, M.; Vizzardi, E.; et al. Cardiac rehabilitation in patients with atrial fibrillation. Minerva Cardiol. Angiol. 2025. [Google Scholar] [CrossRef]
- Available online: https://www.who.int/publications/i/item/9789240088542 (accessed on 8 February 2025).
- Available online: https://www.mdcalc.com/calc/3917/charlson-comorbidity-index-cci#evidence (accessed on 8 February 2025).
- Wasserman, K.; Hansen, J.E.; Sue, D.Y.; Stringer, W.W.; Whipp, B.J. Clinical exercise testing. Principles of exercise testing and interpretation including pathophysiology and clinical applications. Med. Sci. Sports. Exerc. 2005, 37, 1249. [Google Scholar]
- Hansen, J.E.; Sue, D.Y.; Wasserman, K. Predicted values for clinical exercise testing. Am. Rev. Respir. Dis. 1984, 129, S49–S55. [Google Scholar] [CrossRef] [PubMed]
- Glaab, T.; Taube, C. Practical guide to cardiopulmonary exercise testing in adults. Respir. Res. 2022, 23, 9. [Google Scholar] [CrossRef]
- ATS Committee on Proficiency Standards for Clinical Pulmonary Function Laboratories. ATS statement: Guidelines for the six-minute walk test. Am. J. Respir. Crit. Care Med. 2002, 166, 111–117. [Google Scholar] [CrossRef]
- Enright, P.L.; Sherrill, D.L. Reference equations for the six-minute walk in healthy adults. Am. J. Respir. Crit. Care Med. 1998, 158, 1384–1387, Erratum in Am. J. Respir. Crit. Care Med. 2020, 201, 393. [Google Scholar] [CrossRef]
- Giannitsi, S.; Bougiakli, M.; Bechlioulis, A.; Kotsia, A.; Michalis, L.K.; Naka, K.K. 6-minute walking test: A useful tool in the management of heart failure patients. Ther. Adv. Cardiovasc. Dis. 2019, 13, 1753944719870084. [Google Scholar] [CrossRef] [PubMed] [PubMed Central]
- Salvioni, E.; Corrà, U.; Piepoli, M.; Rovai, S.; Correale, M.; Paolillo, S.; Pasquali, M.; Magrì, D.; Vitale, G.; MECKI Score Research Group; et al. Gender and age normalization and ventilation efficiency during exercise in heart failure with reduced ejection fraction. ESC Heart Fail. 2020, 7, 371–380. [Google Scholar] [CrossRef]
- Neder, J.A.; Nery, L.E.; Peres, C.; Whipp, B.J. Reference values for dynamic responses to incremental cycle ergometry in males and females aged 20 to 80. Am. J. Respir. Crit. Care Med. 2001, 164, 1481–1486. [Google Scholar] [CrossRef]
- Sun, X.G.; Hansen, J.E.; Garatachea, N.; Storer, T.W.; Wasserman, K. Ventilatory efficiency during exercise in healthy subjects. Am. J. Respir. Crit. Care Med. 2002, 166, 1443–1448. [Google Scholar] [CrossRef] [PubMed]
- Arena, R.; Myers, J.; Hsu, L.; Peberdy, M.A.; Pinkstaff, S.; Bensimhon, D.; Chase, P.; Vicenzi, M.; Guazzi, M. The minute ventilation/carbon dioxide production slope is prognostically superior to the oxygen uptake efficiency slope. J. Card. Fail. 2007, 13, 462–469. [Google Scholar] [CrossRef] [PubMed]
- Phillips, D.B.; Collins, S.É.; Stickland, M.K. Measurement and Interpretation of Exercise Ventilatory Efficiency. Front. Physiol. 2020, 11, 659. [Google Scholar] [CrossRef]
- Corrà, U.; Agostoni, P.; Giordano, A.; Cattadori, G.; Battaia, E.; La Gioia, R.; Scardovi, A.B.; Emdin, M.; Metra, M.; MECKI Score Research Group; et al. Sex Profile and Risk Assessment with Cardiopulmonary Exercise Testing in Heart Failure: Propensity Score Matching for Sex Selection Bias. Can. J. Cardiol. 2016, 32, 754–759. [Google Scholar] [CrossRef]
- Hsich, E.; Chadalavada, S.; Krishnaswamy, G.; Starling, R.C.; Pothier, C.E.; Blackstone, E.H.; Lauer, M.S. Long-term prognostic value of peak oxygen consumption in women versus men with heart failure and severely impaired left ventricular systolic function. Am. J. Cardiol. 2007, 100, 291–295. [Google Scholar] [CrossRef]
- Guazzi, M.; Arena, R.; Myers, J. Comparison of the prognostic value of cardiopulmonary exercise testing between male and female patients with heart failure. Int. J. Cardiol. 2006, 113, 395–400. [Google Scholar] [CrossRef] [PubMed]
- Roberts, T.J.; Barros-Murphy, J.F.; Burns, A.T.; MacIsaac, R.J.; MacIsaac, A.I.; Prior, D.L.; La Gerche, A. Reduced Exercise Capacity in Diabetes Mellitus Is Not Associated with Impaired Deformation or Twist. J. Am. Soc. Echocardiogr. 2020, 33, 481–489. [Google Scholar] [CrossRef]
- Gojevic, T.; Van Ryckeghem, L.; Jogani, S.; Frederix, I.; Bakelants, E.; Petit, T.; Stroobants, S.; Dendale, P.; Bito, V.; Herbots, L.; et al. Pulmonary hypertension during exercise underlies unexplained exertional dyspnoea in patients with Type 2 diabetes. Eur. J. Prev. Cardiol. 2023, 30, 37–45. [Google Scholar] [CrossRef] [PubMed]
- McDonagh, T.A.; Metra, M.; Adamo, M.; Gardner, R.S.; Baumbach, A.; Böhm, M.; Burri, H.; Butler, J.; Čelutkienė, J.; ESC Scientific Document Group; et al. 2021 ESC Guidelines for the diagnosis and treatment of acute and chronic heart failure. Eur. Heart J. 2021, 42, 3599–3726. [Google Scholar] [CrossRef] [PubMed]
- Nayor, M.; Xanthakis, V.; Tanguay, M.; Blodgett, J.B.; Shah, R.V.; Schoenike, M.; Sbarbaro, J.; Farrell, R.; Malhotra, R.; Houstis, N.E.; et al. Clinical and Hemodynamic Associations and Prognostic Implications of Ventilatory Efficiency in Patients with Preserved Left Ventricular Systolic Function. Circ. Heart Fail. 2020, 13, e006729. [Google Scholar] [CrossRef] [PubMed]
- Ojima, S.; Kubozono, T.; Kawasoe, S.; Kawabata, T.; Salim, A.A.; Ikeda, Y.; Ohishi, M. VE/VCO2 slope in cardiopulmonary exercise testing was associated with left ventricular diastolic dysfunction in patients with reduced ejection fraction. Eur. Heart J. 2023, 44, ehad655.2585. [Google Scholar] [CrossRef]
- Coisne, A.; Aghezzaf, S.; Galli, E.; Mouton, S.; Richardson, M.; Dubois, D.; Delsart, P.; Domanski, O.; Bauters, C.; Charton, M.; et al. Prognostic values of exercise echocardiography and cardiopulmonary exercise testing in patients with primary mitral regurgitation. Eur. Heart J. Cardiovasc. Imaging 2022, 23, 1552–1561. [Google Scholar] [CrossRef]
- Van Ryckeghem, L.; Keytsman, C.; Verboven, K.; Verbaanderd, E.; Frederix, I.; Bakelants, E.; Petit, T.; Jogani, S.; Stroobants, S.; Dendale, P.; et al. Exercise capacity is related to attenuated responses in oxygen extraction and left ventricular longitudinal strain in asymptomatic type 2 diabetes patients. Eur. J. Prev. Cardiol. 2022, 28, 1756–1766. [Google Scholar] [CrossRef]
- Hansen, D.; Abreu, A.; Ambrosetti, M.; Cornelissen, V.; Gevaert, A.; Kemps, H.; Laukkanen, J.A.; Pedretti, R.; Simonenko, M.; Wilhelm, M.; et al. Exercise intensity assessment and prescription in cardiovascular rehabilitation and beyond: Why and how: A position statement from the Secondary Prevention and Rehabilitation Section of the European Association of Preventive Cardiology. Eur. J. Prev. Cardiol. 2022, 29, 230–245. [Google Scholar] [CrossRef]


Disclaimer/Publisher’s Note: The statements, opinions and data contained in all publications are solely those of the individual author(s) and contributor(s) and not of MDPI and/or the editor(s). MDPI and/or the editor(s) disclaim responsibility for any injury to people or property resulting from any ideas, methods, instructions or products referred to in the content. |
© 2025 by the authors. Licensee MDPI, Basel, Switzerland. This article is an open access article distributed under the terms and conditions of the Creative Commons Attribution (CC BY) license (https://creativecommons.org/licenses/by/4.0/).