
Plasma Endothelin-1 Levels: Non-Predictors of Alzheimer’s Disease Reveal Age Correlation in African American Women


Abstract
:1. Introduction
2. Materials and Methods
2.1. Preparation of Human Plasma for Sampling
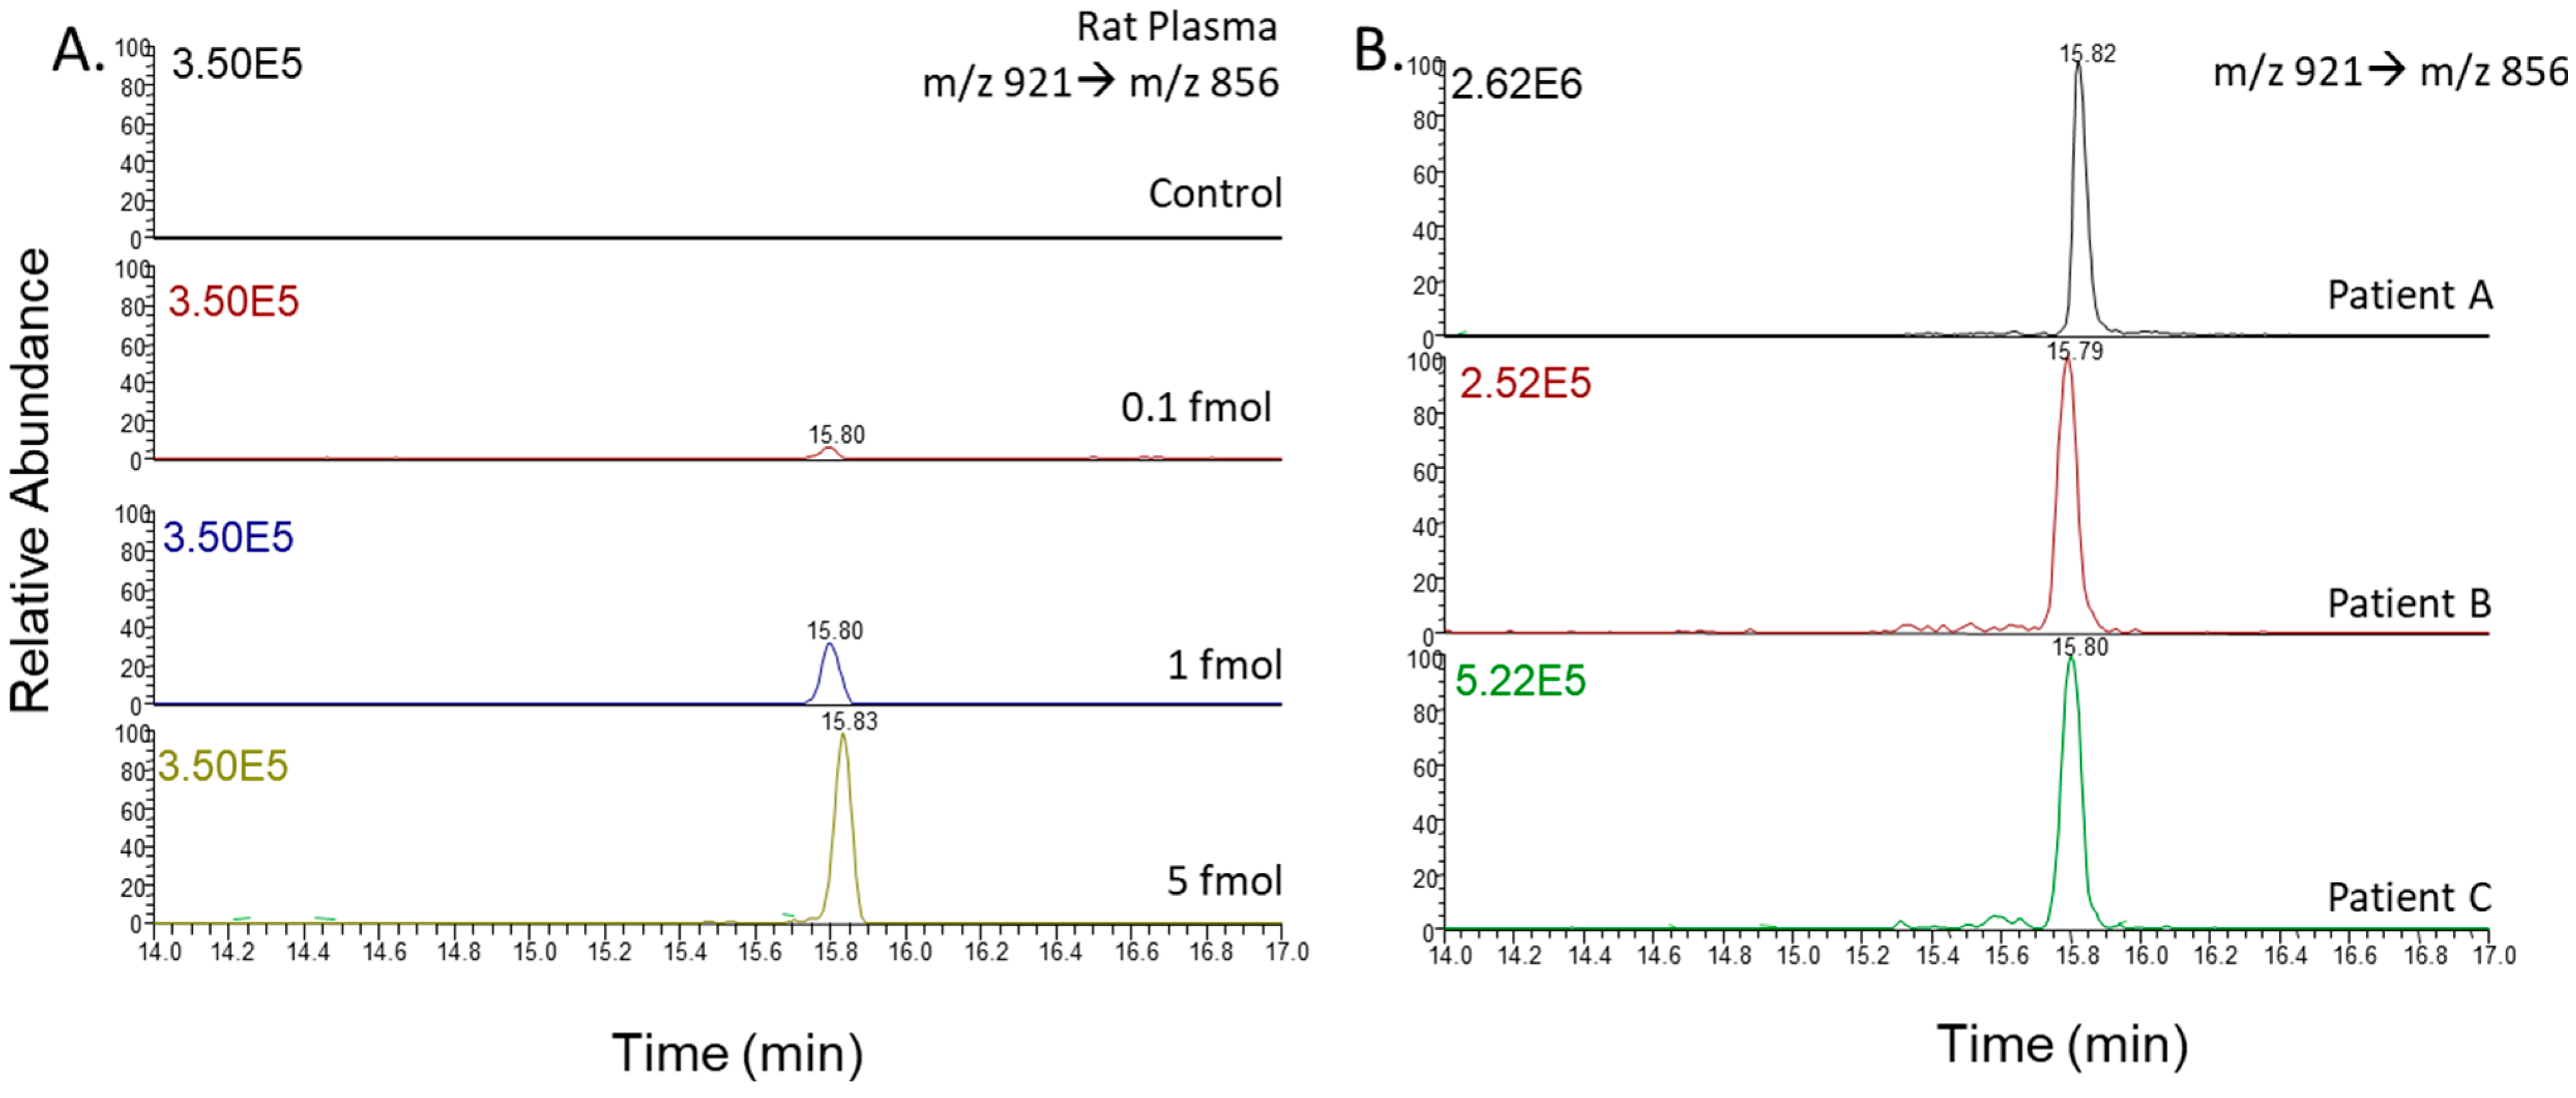
2.2. Liquid Chromatography–Tandem Mass Spectrometry
2.3. Endothelin Peptide Quantification
2.4. Data Curation
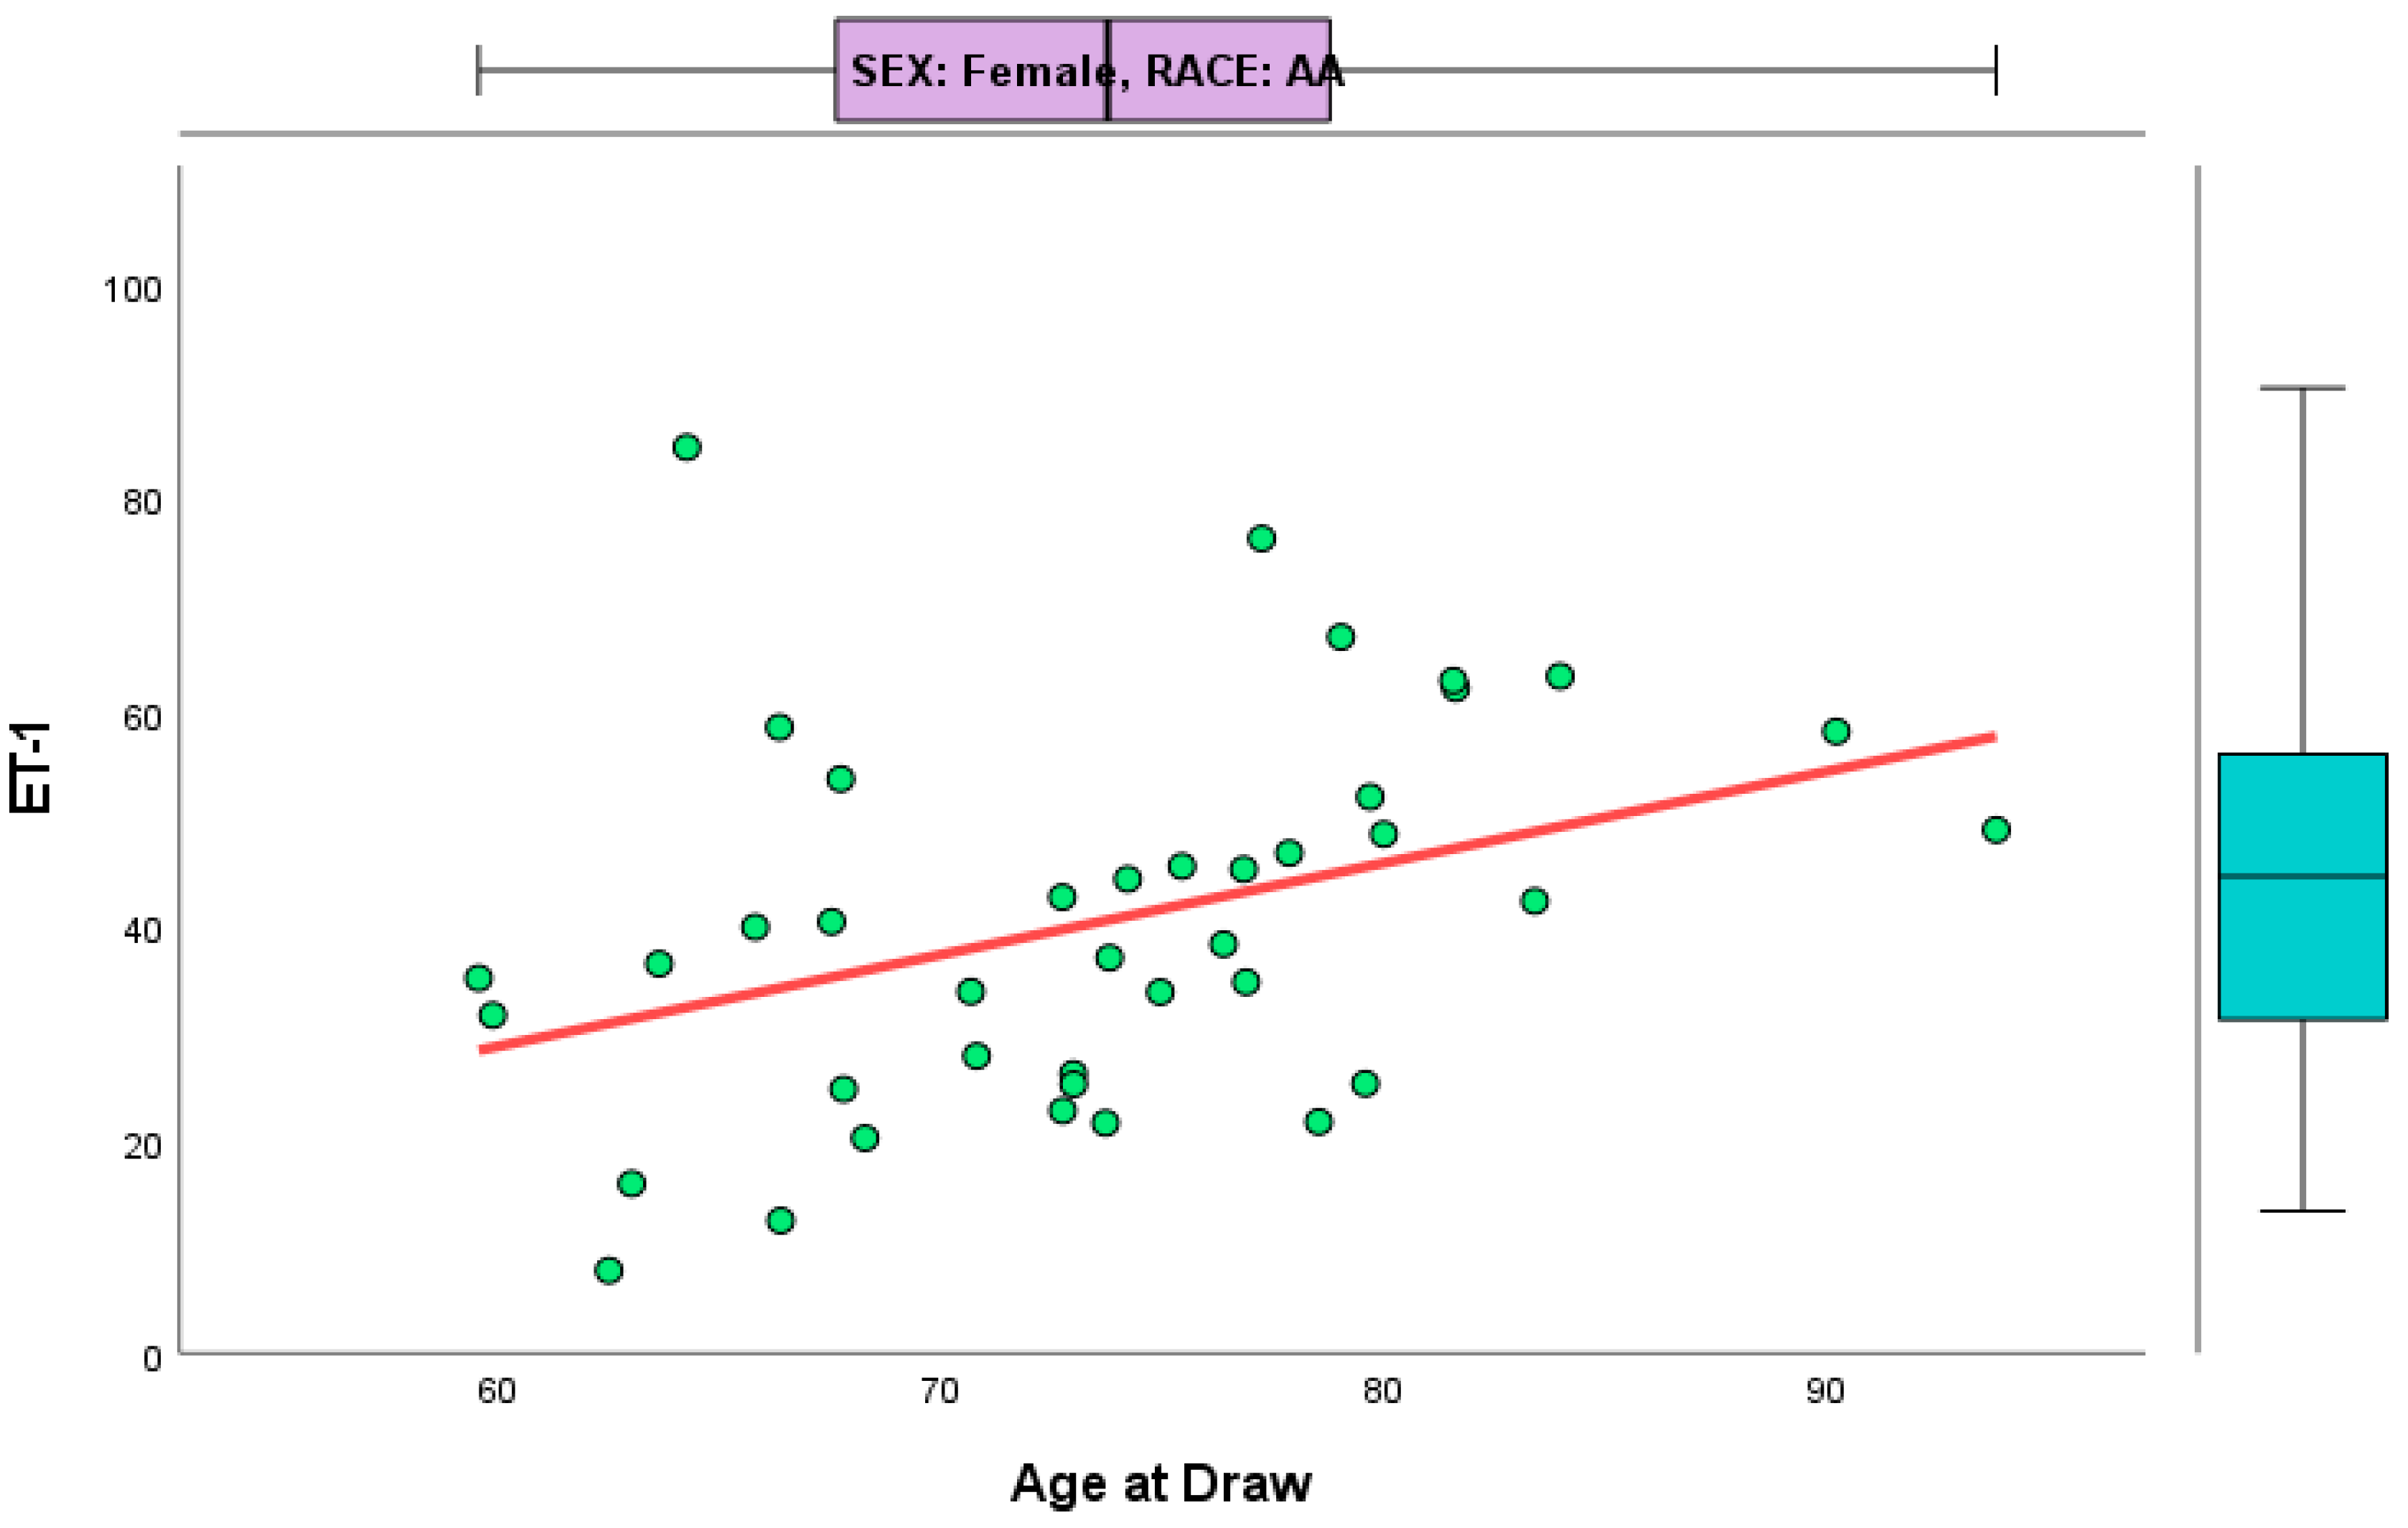
3. Results
4. Discussion
5. Limitations and Future Directions
6. Conclusions
Author Contributions
Funding
Institutional Review Board Statement
Informed Consent Statement
Data Availability Statement
Conflicts of Interest
References
- Savelieff, M.G.; Nam, G.; Kang, J.; Lee, H.J.; Lee, M.; Lim, M.H. Development of multifunctional molecules as potential therapeutic candidates for Alzheimer’s disease, Parkinson’s disease, and amyotrophic lateral sclerosis in the last decade. Chem. Rev. 2019, 119, 1221–1322. [Google Scholar] [CrossRef] [PubMed]
- Cummings, J.; Aisen, P.S.; DuBois, B.; Frolich, L.; Jack, C.R.; Jones, R.W.; Morris, J.C.; Raskin, J.; Dowsett, S.A.; Scheltens, P. Drug development in Alzheimer’s disease: The path to 2025. Alzheimers Res. Ther. 2016, 8, 12. [Google Scholar] [CrossRef] [PubMed]
- Ferreira-Vieira, T.H.; Guimaraes, I.M.; Silva, F.R.; Ribeiro, F.M. Alzheimer’s disease: Targeting the cholinergic system. Curr. Neuropharmacol. 2016, 14, 101–115. [Google Scholar] [CrossRef]
- Selkoe, D.J.; Hardy, J. The amyloid hypothesis of Alzheimer’s disease at 25 years. EMBO Mol. Med. 2016, 8, 595–608. [Google Scholar] [CrossRef]
- Lewis, J.; Dickson, D.W. Propagation of tau pathology: Hypotheses, discoveries, and yet unresolved questions from experimental and human brain studies. Acta Neuropathol. 2016, 131, 27–48. [Google Scholar] [CrossRef]
- Briggs, C.A.; Chakroborty, S.; Stutzmann, G.E. Emerging pathways driving early synaptic pathology in Alzheimer’s disease. Biochem. Biophys. Res. Commun. 2016, 483, 988–997. [Google Scholar] [CrossRef]
- Kumar, A.; Singh, A. A review on mitochondrial restorative mechanism of antioxidants in Alzheimer’s disease and other neurological conditions. Front. Pharmacol. 2015, 6, 206. [Google Scholar] [CrossRef]
- Calsolaro, V.; Edison, P. Neuroinflammation in Alzheimer’s disease: Current evidence and future directions. Alzheimers Dement. 2016, 12, 719–732. [Google Scholar] [CrossRef] [PubMed]
- Zhao, Q.F.; Tan, L.; Wang, H.F.; Jiang, T.; Tan, M.S.; Tan, L.; Xu, W.; Li, J.Q.; Wang, J.; Lai, T.J.; et al. The prevalence of neuropsychiatric symptoms in Alzheimer’s disease: Systematic review and meta-analysis. J. Affect. Disord. 2016, 190, 264–271. [Google Scholar] [CrossRef] [PubMed]
- Dugger, B.N.; Dickson, D.W. Pathology of Neurodegenerative Diseases. Cold Spring Harb. Perspect. Biol. 2017, 9, a028035. [Google Scholar] [CrossRef] [PubMed]
- Ambar Akkaoui, M.; Geoffroy, P.A.; Roze, E.; Degos, B.; Garcin, B. Functional Motor Symptoms in Parkinson’s Disease and Functional Parkinsonism: A Systematic Review. J. Neuropsychiatry Clin. Neurosci. 2020, 32, 4–13. [Google Scholar] [CrossRef]
- O’Day, D.H. Calmodulin Binding Proteins and Alzheimer’s Disease: Biomarkers, Regulatory Enzymes and Receptors That Are Regulated by Calmodulin. Int. J. Mol. Sci. 2020, 21, 7344. [Google Scholar] [CrossRef] [PubMed]
- Schwarz, M.J.; Guillemin, G.J.; Teipel, S.J.; Buerger, K.; Hampel, H. Increased 3-hydroxykynurenine serum concentrations differentiate Alzheimer’s disease patients from controls. Eur. Arch. Psychiatry Clin. Neurosci. 2013, 4, 345–352. [Google Scholar] [CrossRef]
- Gulaj, E.; Pawlak, K.; Bien, B.; Pawlak, D. Kynurenine and its metabolites in Alzheimer’s disease patients. Adv. Med. Sci. 2010, 2, 204–211. [Google Scholar] [CrossRef] [PubMed]
- Bonda, D.J.; Mailankot, M.; Stone, J.G.; Garrett, M.R.; Staniszewska, M.; Castellani, R.J.; Siedlak, S.L.; Zhu, X.; Lee, H.G.; Perry, G.L.; et al. Indoleamine 2,3-dioxygenase and 3-hydroxykynurenine modifications are found in the neuropathology of Alzheimer’s disease. Redox Rep. 2010, 4, 161–168. [Google Scholar] [CrossRef]
- Rahman, A.; Ting, K.; Cullen, K.M.; Braidy, N.; Brew, B.J.; Guillemin, G.J. The excitotoxin quinolinic acid induces tau phosphorylation in human neurons. PLoS ONE 2009, 4, e6344. [Google Scholar] [CrossRef]
- Giil, L.M.; Midttun, O.; Refsum, H.; Ulvik, A.; Advani, R.; Smith, A.D.; Ueland, P.M. Kynurenine Pathway Metabolites in Alzheimer’s Disease. J. Alzheimers Dis. 2017, 60, 495–504. [Google Scholar] [CrossRef]
- Novak, P.; Chu, J.; Ali, M.M.; Chen, J. Racial and Ethnic Disparities in Serious Psychological Distress Among Those With Alzheimer’s Disease and Related Dementias. Am. J. Geriatr. Psychiatry 2019, 19, 30473–30477. [Google Scholar] [CrossRef] [PubMed]
- Clark, L.R.; Norton, D.; Berman, S.E.; Johnson, S.C.; Bendlin, B.B.; Wieben, O.; Turski, P.; Carlsson, C.; Asthana, S.; Gleason, C.E.; et al. Association of Cardiovascular and Alzheimer’s Disease Risk Factors with Intracranial Arterial Blood Flow in Whites and African Americans. J. Alzheimers Dis. 2019, 3, 919–929. [Google Scholar] [CrossRef] [PubMed]
- Potter, G.G.; Plassman, B.L.; Burke, J.R.; Kabeto, M.U.; Langa, K.M.; Llewellyn, D.J.; Rogers, M.A.; Steffens, D.C. Cognitive performance and informant reports in the diagnosis of cognitive impairment and dementia in African Americans and whites. Alzheimers Dement. 2009, 6, 445–453. [Google Scholar] [CrossRef]
- Wilson, R.S.; Barnes, L.L.; Bennett, D.A.; Li, Y.; Bienias, J.L.; Mendes de Leon, C.F.; Evans, D.A. Proneness to psychological distress and risk of Alzheimer disease in a biracial community. Neurology 2005, 2, 380–382. [Google Scholar] [CrossRef] [PubMed]
- Barnes, L.L.; Bennett, D.A. Alzheimer’s disease in African Americans: Risk factors and challenges for the future. Health Aff. 2014, 4, 580–586. [Google Scholar] [CrossRef] [PubMed]
- Treiber, F.A.; Jackson, R.W.; Davis, H.; Pollock, J.S.; Kapuku, G.; Mensah, G.A.; Pollock, D.M. Racial differences in endothelin-1 at rest and in response to acute stress in adolescent males. Hypertension 2000, 3, 722–725. [Google Scholar] [CrossRef]
- Houde, M.; Desbiens, L.; D’Orléans-Juste, P. Endothelin-1: Biosynthesis, Signaling and Vasoreactivity. Adv. Pharmacol. 2016, 77, 143–175. [Google Scholar] [PubMed]
- Yanagisawa, M.; Kurihara, H.; Kimura, S. A novel potent vasoconstrictor peptide produced by vascular endothelial cells. Nature 1988, 332, 411–415. [Google Scholar] [CrossRef]
- Wager, O.F.; Chirst, G.; Wojta, J.; Vierhapper, H.; Parzer, S.; Nowotny, P.J. Polar secretion of endothelin-1 by cultured endothelial cells. J. Biol. Chem. 1992, 267, 16066–16068. [Google Scholar] [CrossRef]
- Dehouck, M.P.; Vigne, P.; Torpier, G.; Breittmayer, J.P.; Cecchelli, R.; Frelin, C. Endothelin- 1 as a mediator of endothelial cell-pericyte interactions in bovine brain capillaries. J. Cereb. Blood Flow Metab. 1997, 4, 464–469. [Google Scholar] [CrossRef] [PubMed]
- Ergul, A.; Portik-Dobos, V.; Giulumian, A.D.; Molero, M.M.; Fuchs, L.C. Stress upregulates arterial matrix metalloproteinase expression and activity via endothelin A receptor activation. Am. J. Physiol. Heart Circ. Physiol. 2003, 5, H2225–H2232. [Google Scholar] [CrossRef] [PubMed]
- Palmer, J.C.; Tayler, H.M.; Love, S. Endothelin-converting enzyme-1 activity, endothelin-1 production, and free radical-dependent vasoconstriction in Alzheimer’s disease. J. Alzheimers Dis. 2013, 36, 577–587. [Google Scholar] [CrossRef] [PubMed]
- Yang, S.; Jin, H.; Zhu, Y.; Wan, Y.; Opoku, E.N.; Zhu, L.; Bo, H. Diverse Functions and Mechanisms of Pericytes in Ischemic Stroke. Curr. Neuropharmacol. 2017, 6, 892–905. [Google Scholar] [CrossRef] [PubMed]
- Khan, M.J.; Desaire, H.; Lopez, O.L.; Ilyas Kamboh, M.; Robinson, R.A.S. Dataset of why inclusion matters for Alzheimer’s disease biomarker discovery in plasma. Data Brief. 2021, 35, 106923. [Google Scholar] [CrossRef] [PubMed]
- Gritti, F.; Basile, M.; Cormier, S.; Fogwill, M.; Gilar, M.; McDonald, T.; Riley, F.; Yan, Q. Semi-preparative high-resolution recycling liquid chromatography. J. Chromatogr. A 2018, 1566, 64–78. [Google Scholar] [CrossRef] [PubMed]
- Weng, Q.; Tan, W.; Yu, R.Y.; Xu, R.A.; Chen, Y. A novel bioanalytical method for the quantification of pemigatinib in rat plasma by UPLC-MS/MS. J. Pharm. Biomed. Anal. 2021, 202, 114137. [Google Scholar] [CrossRef] [PubMed]
- Ma, Z.Q.; Tabb, D.L.; Burden, J.; Chambers, M.C.; Cox, M.B.; Cantrell, M.J.; Ham, A.J.; Litton, M.D.; Oreto, M.R.; Schultz, W.C.; et al. Supporting tool suite for production proteomics. Bioinformatics 2011, 27, 3214–3215. [Google Scholar] [CrossRef] [PubMed]
- Chang, C.H.; Lane, H.Y.; Lin, C.H. Brain Stimulation in Alzheimer’s Disease. Front. Psychiatry 2018, 9, 201. [Google Scholar] [CrossRef] [PubMed]
- Borgomaneri, S.; Battaglia, S.; Sciamanna, G.; Tortora, F.; Laricchiuta, D. Memories are not written in stone: Re-writing fear memories by means of non-invasive brain stimulation and optogenetic manipulations. Neurosci. Biobehav. Rev. 2021, 127, 334–352. [Google Scholar] [CrossRef] [PubMed]
- Teselink, J.; Bawa, K.K.; Koo, G.K.; Sankhe, K.; Liu, C.S.; Rapoport, M.; Oh, P.; Marzolini, S.; Gallagher, D.; Swardfager, W.; et al. Efficacy of non-invasive brain stimulation on global cognition and neuropsychiatric symptoms in Alzheimer’s disease and mild cognitive impairment: A meta-analysis and systematic review. Ageing Res. Rev. 2021, 72, 101499. [Google Scholar] [CrossRef]
- Barker, A.T.; Jalinous, R.; Freeston, I.L. Non-invasive magnetic stimulation of human motor cortex. Lancet 1985, 1, 1106–1107. [Google Scholar] [CrossRef] [PubMed]
- Gilula, M.F.; Barach, P.R. Cranial electrotherapy stimulation: A safe neuromedical treatment for anxiety, depression, or insomnia. South Med. J. 2004, 12, 1269–1270. [Google Scholar] [CrossRef]
- Antal, A.; Paulus, W. Transcranial alternating current stimulation (tACS). Front. Hum. Neurosci. 2013, 7, 317. [Google Scholar] [CrossRef]
- Passione, R. Italian psychiatry in an international context: Ugo Cerletti and the case of electroshock. Hist. Psychiatry 2004, 15, 83–104. [Google Scholar] [CrossRef] [PubMed]
- Woods, A.J.; Antal, A.; Bikson, M.; Boggio, P.S.; Brunoni, A.R.; Celnik, P.; Cohen, L.G.; Fregni, F.; Herrmann, C.S.; Kappenman, E.S.; et al. A technical guide to tDCS, and related non-invasive brain stimulation tools. Clin. Neurophysiol. 2016, 2, 1031–1048. [Google Scholar] [CrossRef] [PubMed]
- Cretaz, E.; Brunoni, A.R.; Lafer, B. Magnetic seizure therapy for unipolar and bipolar depression: A systematic review. Neural. Plast. 2015, 2015, 521398. [Google Scholar] [CrossRef] [PubMed]
- Clark, L.T.; Watkins, L.; Piña, I.L.; Elmer, M.; Akinboboye, O.; Gorham, M.; Jamerson, B.; McCullough, C.; Pierre, C.; Polis, A.B.; et al. Increasing Diversity in Clinical Trials: Overcoming Critical Barriers. Curr. Probl. Cardiol. 2019, 5, 148–172. [Google Scholar] [CrossRef] [PubMed]
- Matt, E.; Dörl, G.; Beisteiner, R. Transcranial pulse stimulation (TPS) improves depression in AD patients on state-of-the-art treatment. Alzheimers Dement 2022, 8, e12245. [Google Scholar] [CrossRef]
- Andrasik, M.P.; Broder, G.B.; Wallace, S.E.; Chaturvedi, R.; Michael, N.L.; Bock, S.; Beyrer, C.; Oseso, L.; Aina, J.; Lucas, J.; et al. Increasing Black, Indigenous and People of Color participation in clinical trials through community engagement and recruitment goal establishment. PLoS ONE 2021, 10, e0258858. [Google Scholar] [CrossRef]
- Weissberger, G.H.; Lamar, M.; Nguyen, A.L.; Fenton, L.; Herrera, J.; Han, S.D. Quantification of race/ethnicity representation in Alzheimer’s disease neuroimaging research in the USA: A systematic review. Commun. Med. 2023, 3, 101. [Google Scholar]
- Quiroz, Y.T.; Solis, M.; Aranda, M.P.; Arbaje, A.I.; Arroyo-Miranda, M.; Cabrera, L.Y.; Carrasquillo, M.M.; Corrada, M.M.; Crivelli, L.; Diminich, E.D.; et al. Addressing the disparities in dementia risk, early detection and care in Latino populations: Highlights from the second Latinos & Alzheimer’s Symposium. Alzheimers Dement. 2022, 18, 1677–1686. [Google Scholar] [CrossRef]
- Parker, L.J.; Gaugler, J.E.; Gitlin, L.N. Use of Critical Race Theory to Inform the Recruitment of Black/African American Alzheimer’s Disease Caregivers into Community-Based Research. Gerontologist 2022, 62, 742–750. [Google Scholar] [CrossRef] [PubMed]
- Kuczmarski, A.V.; Welti, L.M.; Moreau, K.L.; Wenner, M.M. ET-1 as a Sex-Specific Mechanism Impacting Age-Related Changes in Vascular Function. Front. Aging 2021, 2, 727416. [Google Scholar] [CrossRef]
- Dosi, R.; Bhatt, N.; Shah, P.; Patell, R. Cardiovascular Disease and Menopause. JCDR 2014, 8, 62–64. [Google Scholar] [PubMed]
- Celermajer, D.S.; Sorensen, K.E.; Spiegelhalter, D.J.; Georgakopoulos, D.; Robinson, J.; Deanfield, J.E. Aging is associated with endothelial dysfunction in healthy men years before the age-related decline in women. J. Am. Coll. Cardiol. 1994, 24, 471–476. [Google Scholar] [CrossRef] [PubMed]


| Variable Name | Mean (±SD) | 95% CI | Median | Min | Max |
|---|---|---|---|---|---|
| Age at draw | 73.65 (±8.45) | (72.08, 75.23) | 73.80 | 53.07 | 93.85 |
| ET-1 | 39.10 (±22.78) | (34.85, 43.35) | 34.70 | 5.58 | 120.19 |
| Variable | Stratification | Mean (±SD) | 95% CI | Median | Min | Max |
|---|---|---|---|---|---|---|
| Age at draw | Male | 75.12 (±7.96) | (72.47, 77.78) | 76.83 | 59.96 | 86.78 |
| Female | 72.94 (±8.64) | (70.96, 74.91) | 73.75 | 53.07 | 93.85 | |
| AA | 73.57 (±7.66) | (71.52, 75.63) | 73.35 | 59.54 | 93.85 | |
| NHW | 73.73 (±9.22) | (71.28, 76.18) | 74.51 | 53.07 | 89.26 | |
| Probable Alzheimer’s | 75.45 (±8.33) | (73.26, 77.65) | 77.31 | 56.38 | 93.85 | |
| No Probable Alzheimer’s | 71.75 (±8.22) | (69.53, 73.98) | 71.32 | 53.07 | 90.23 | |
| ET-1 | Male | 42.74 (±26.16) | (34.02, 51.47) | 34.67 | 9.58 | 120.19 |
| Female | 37.33 (±20.90) | (32.55, 42.10) | 34.88 | 5.58 | 104.94 | |
| AA | 41.07 (±18.75) | (36.05, 46.10) | 37.77 | 7.71 | 84.78 | |
| NHW | 37.16 (±26.17) | (30.22, 44.11) | 33.44 | 5.58 | 120.19 | |
| Probable Alzheimer’s | 37.51 (±17.91) | (32.81, 42.22) | 35.05 | 6.16 | 91.31 | |
| No Probable Alzheimer’s | 40.78 (±27.06) | (33.46, 48.09) | 33.47 | 5.58 | 120.19 |
| African American Control | Mean 41.307 | Standard Deviation 21.904 |
|---|---|---|
| African American with probable Alzheimer’s | 40.856 | 15.662 |
| Non-Hispanic White control | 40.266 | 31.656 |
| Non-Hispanic White with probable Alzheimer’s | 34.166 | 19.608 |
| M | F | AA | NHW | ALZ | No ALZ | |
|---|---|---|---|---|---|---|
| M | 28.6 | 36.8 | 32.8 | 32.7 | ||
| F | 71.4 | 63.2 | 67.2 | 67.3 | ||
| AA | 43.2 | 52.6 | 50.0 | 49.1 | ||
| NHW | 56.8 | 47.4 | 50.0 | 50.9 | ||
| ALZ | 51.4 | 51.3 | 51.8 | 50.9 | ||
| No ALZ | 48.6 | 48.7 | 48.2 | 49.1 |
| Coefficient | S.E. | Wald | df | p-Value | Adjusted Odds Ratio | 95% CI | |
|---|---|---|---|---|---|---|---|
| Intercept Race | −3.954 | 1.857 | 4.532 | 1 | 0.033 | 0.019 | |
| African American | 0.079 | 0.392 | 0.041 | 1 | 0.839 | 1.083 | (0.503, 2.332) |
| Non-Hispanic White | ref | 1 | |||||
| Sex | |||||||
| Female | 0.069 | 0.421 | 0.027 | 1 | 0.869 | 1.072 | (0.470, 2.446) |
| Male | ref | 1 | |||||
| ET-1 | −0.009 | 0.009 | 0.992 | 1 | 0.319 | 0.991 | (0.974, 1.009) |
| Age at draw | 0.058 | 0.024 | 5.657 | 1 | 0.017 | 1.060 | (1.010, 1.112) |
Disclaimer/Publisher’s Note: The statements, opinions and data contained in all publications are solely those of the individual author(s) and contributor(s) and not of MDPI and/or the editor(s). MDPI and/or the editor(s) disclaim responsibility for any injury to people or property resulting from any ideas, methods, instructions or products referred to in the content. |
© 2025 by the authors. Licensee MDPI, Basel, Switzerland. This article is an open access article distributed under the terms and conditions of the Creative Commons Attribution (CC BY) license (https://creativecommons.org/licenses/by/4.0/).
Share and Cite
Zagol-Ikapitte, I.A.; Tabatabai, M.A.; Wilus, D.M.; Alcendor, D.J. Plasma Endothelin-1 Levels: Non-Predictors of Alzheimer’s Disease Reveal Age Correlation in African American Women. J. Clin. Med. 2025, 14, 635. https://doi.org/10.3390/jcm14020635
Zagol-Ikapitte IA, Tabatabai MA, Wilus DM, Alcendor DJ. Plasma Endothelin-1 Levels: Non-Predictors of Alzheimer’s Disease Reveal Age Correlation in African American Women. Journal of Clinical Medicine. 2025; 14(2):635. https://doi.org/10.3390/jcm14020635
Chicago/Turabian StyleZagol-Ikapitte, Irene A., Mohammad A. Tabatabai, Derek M. Wilus, and Donald J. Alcendor. 2025. "Plasma Endothelin-1 Levels: Non-Predictors of Alzheimer’s Disease Reveal Age Correlation in African American Women" Journal of Clinical Medicine 14, no. 2: 635. https://doi.org/10.3390/jcm14020635
APA StyleZagol-Ikapitte, I. A., Tabatabai, M. A., Wilus, D. M., & Alcendor, D. J. (2025). Plasma Endothelin-1 Levels: Non-Predictors of Alzheimer’s Disease Reveal Age Correlation in African American Women. Journal of Clinical Medicine, 14(2), 635. https://doi.org/10.3390/jcm14020635