
Long-Term Lung Sequelae in Survivors of Severe/Critical COVID-19 Pneumonia: The “Non-Steroid”, “Non-Interventional” Approach

 , , , , , , , and
Abstract
1. Introduction
2. Materials and Methods
2.1. Study Design
2.2. Patients’ Parameters
2.3. Statistics
3. Results
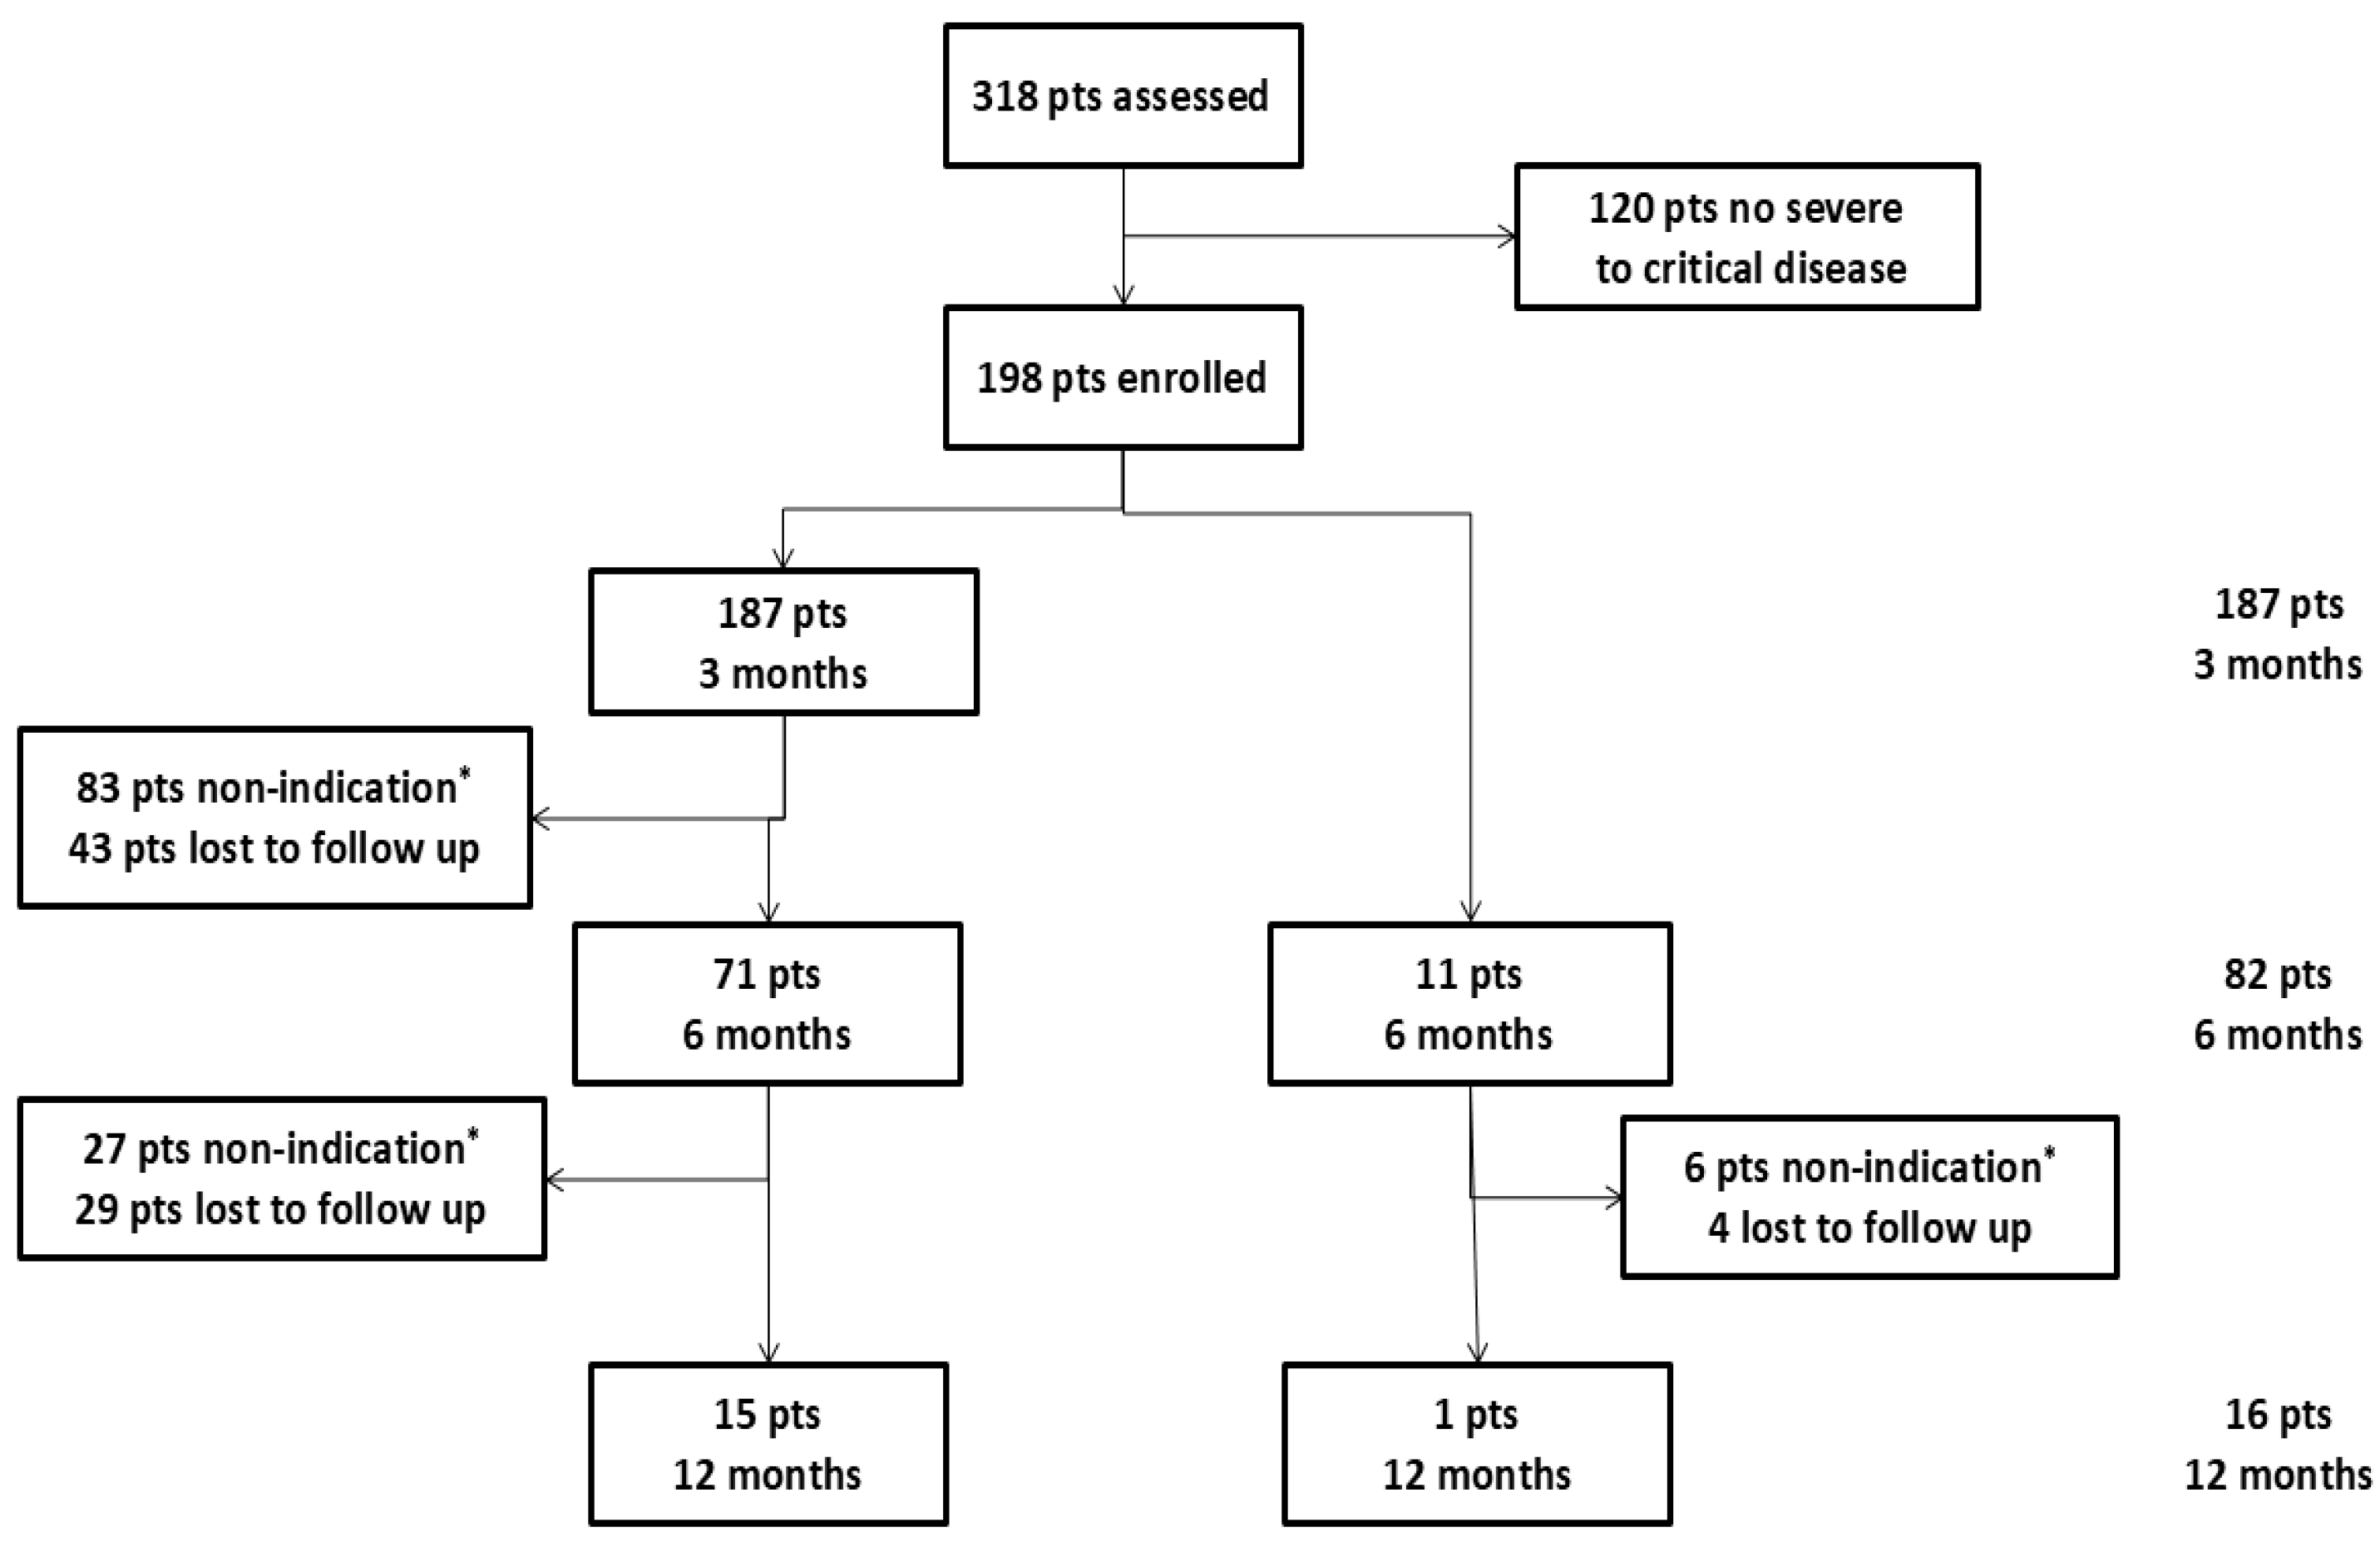
3.1. Study Population
3.2. Therapy
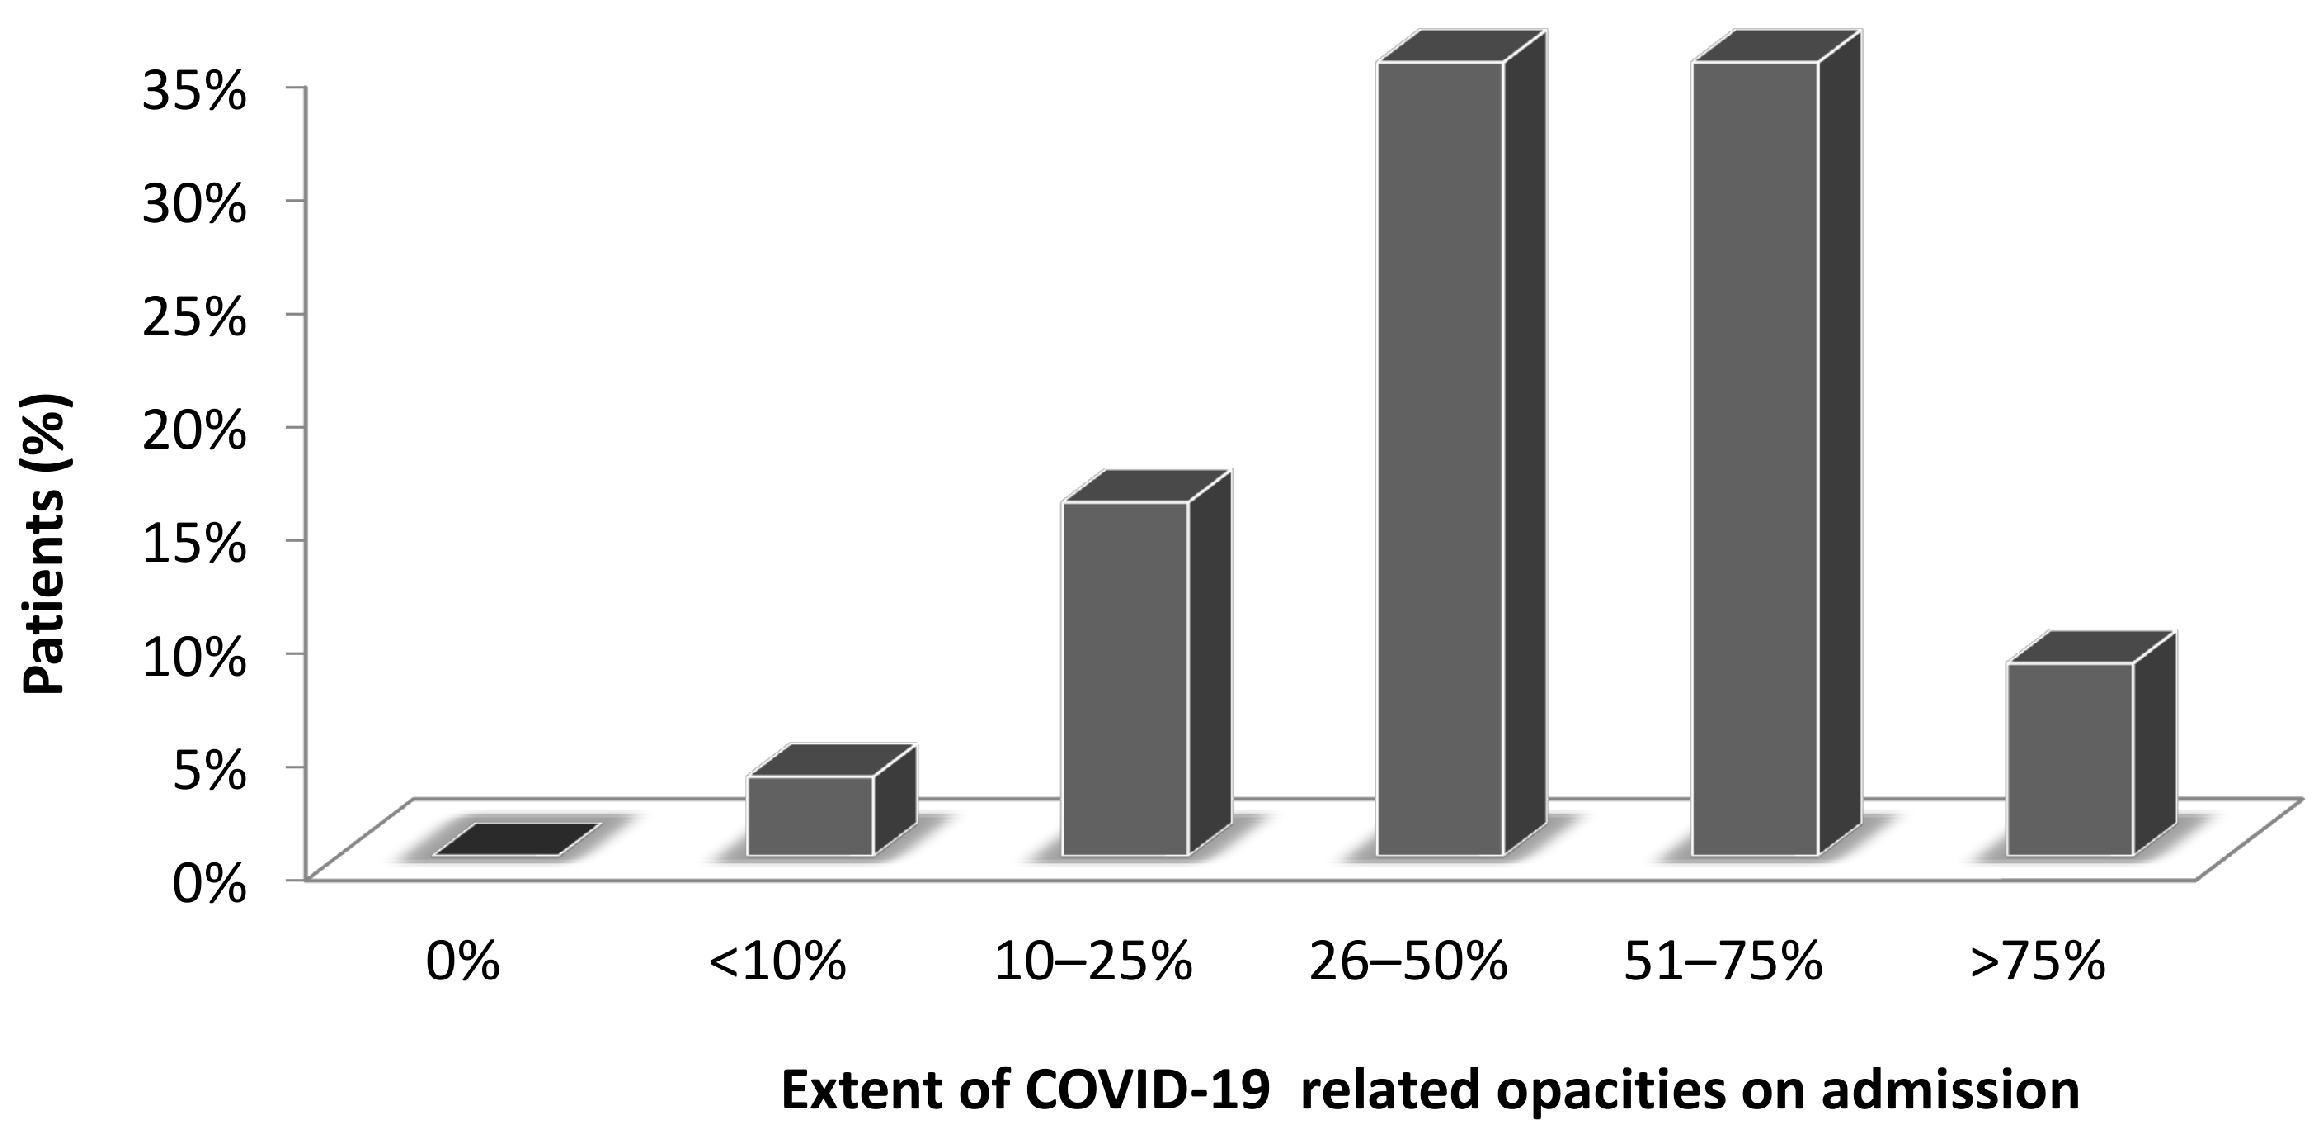
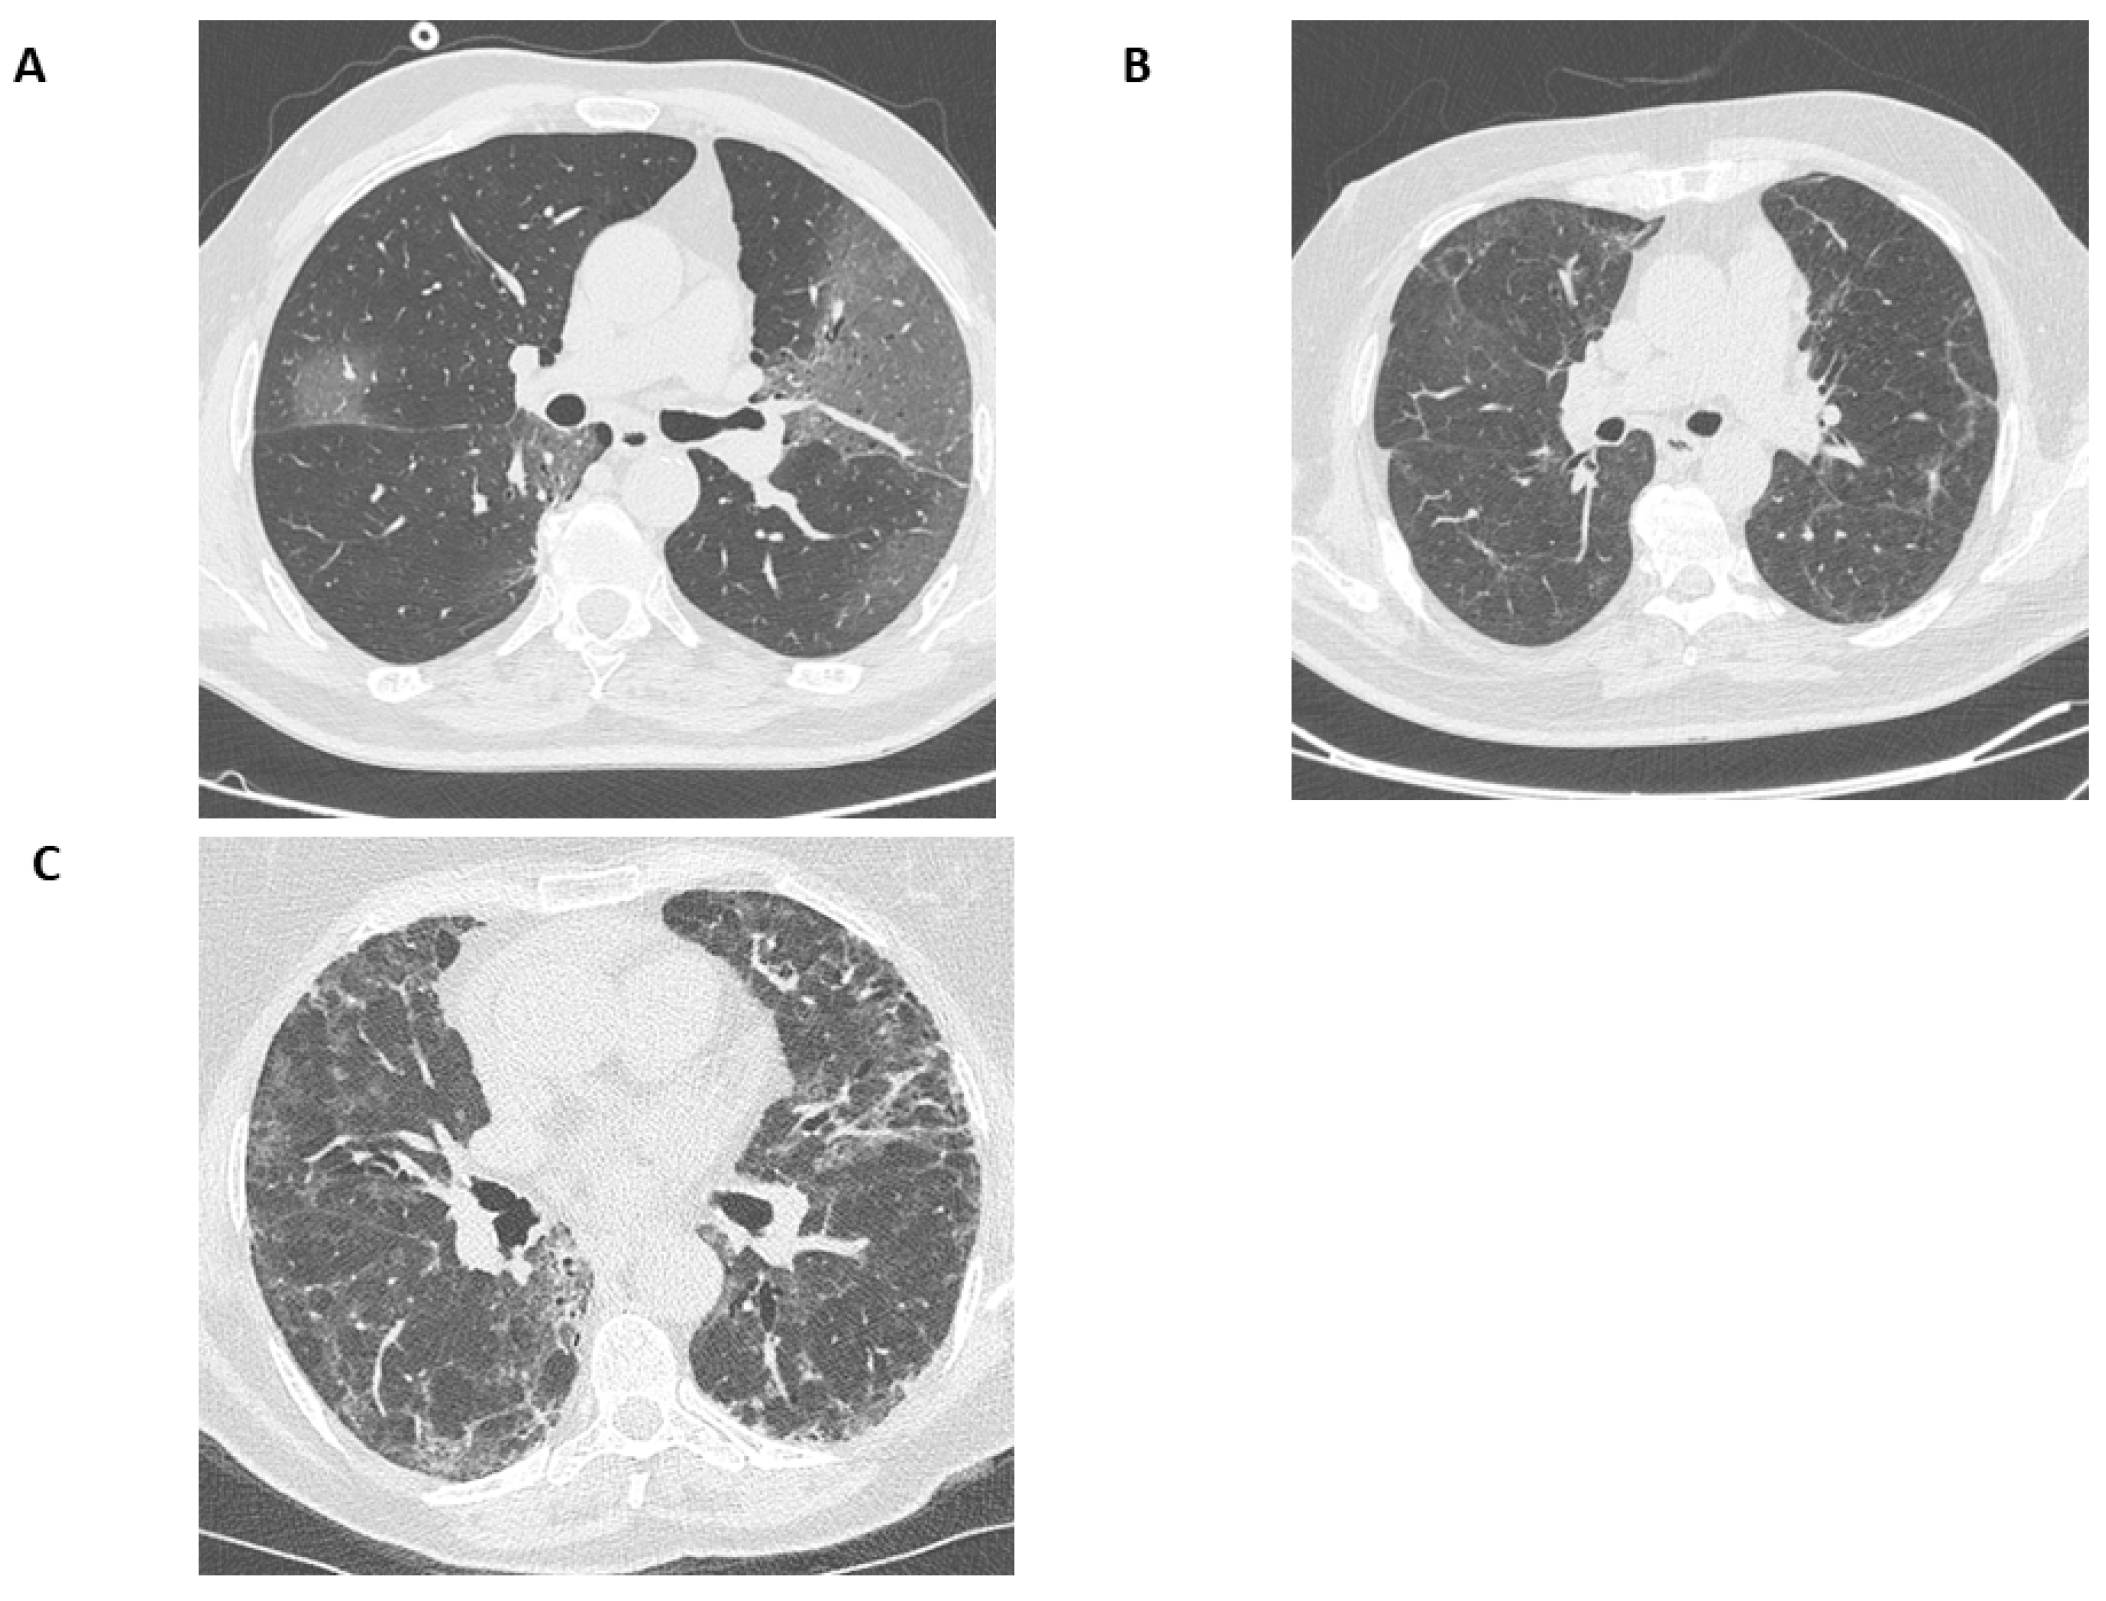
3.3. CT Findings
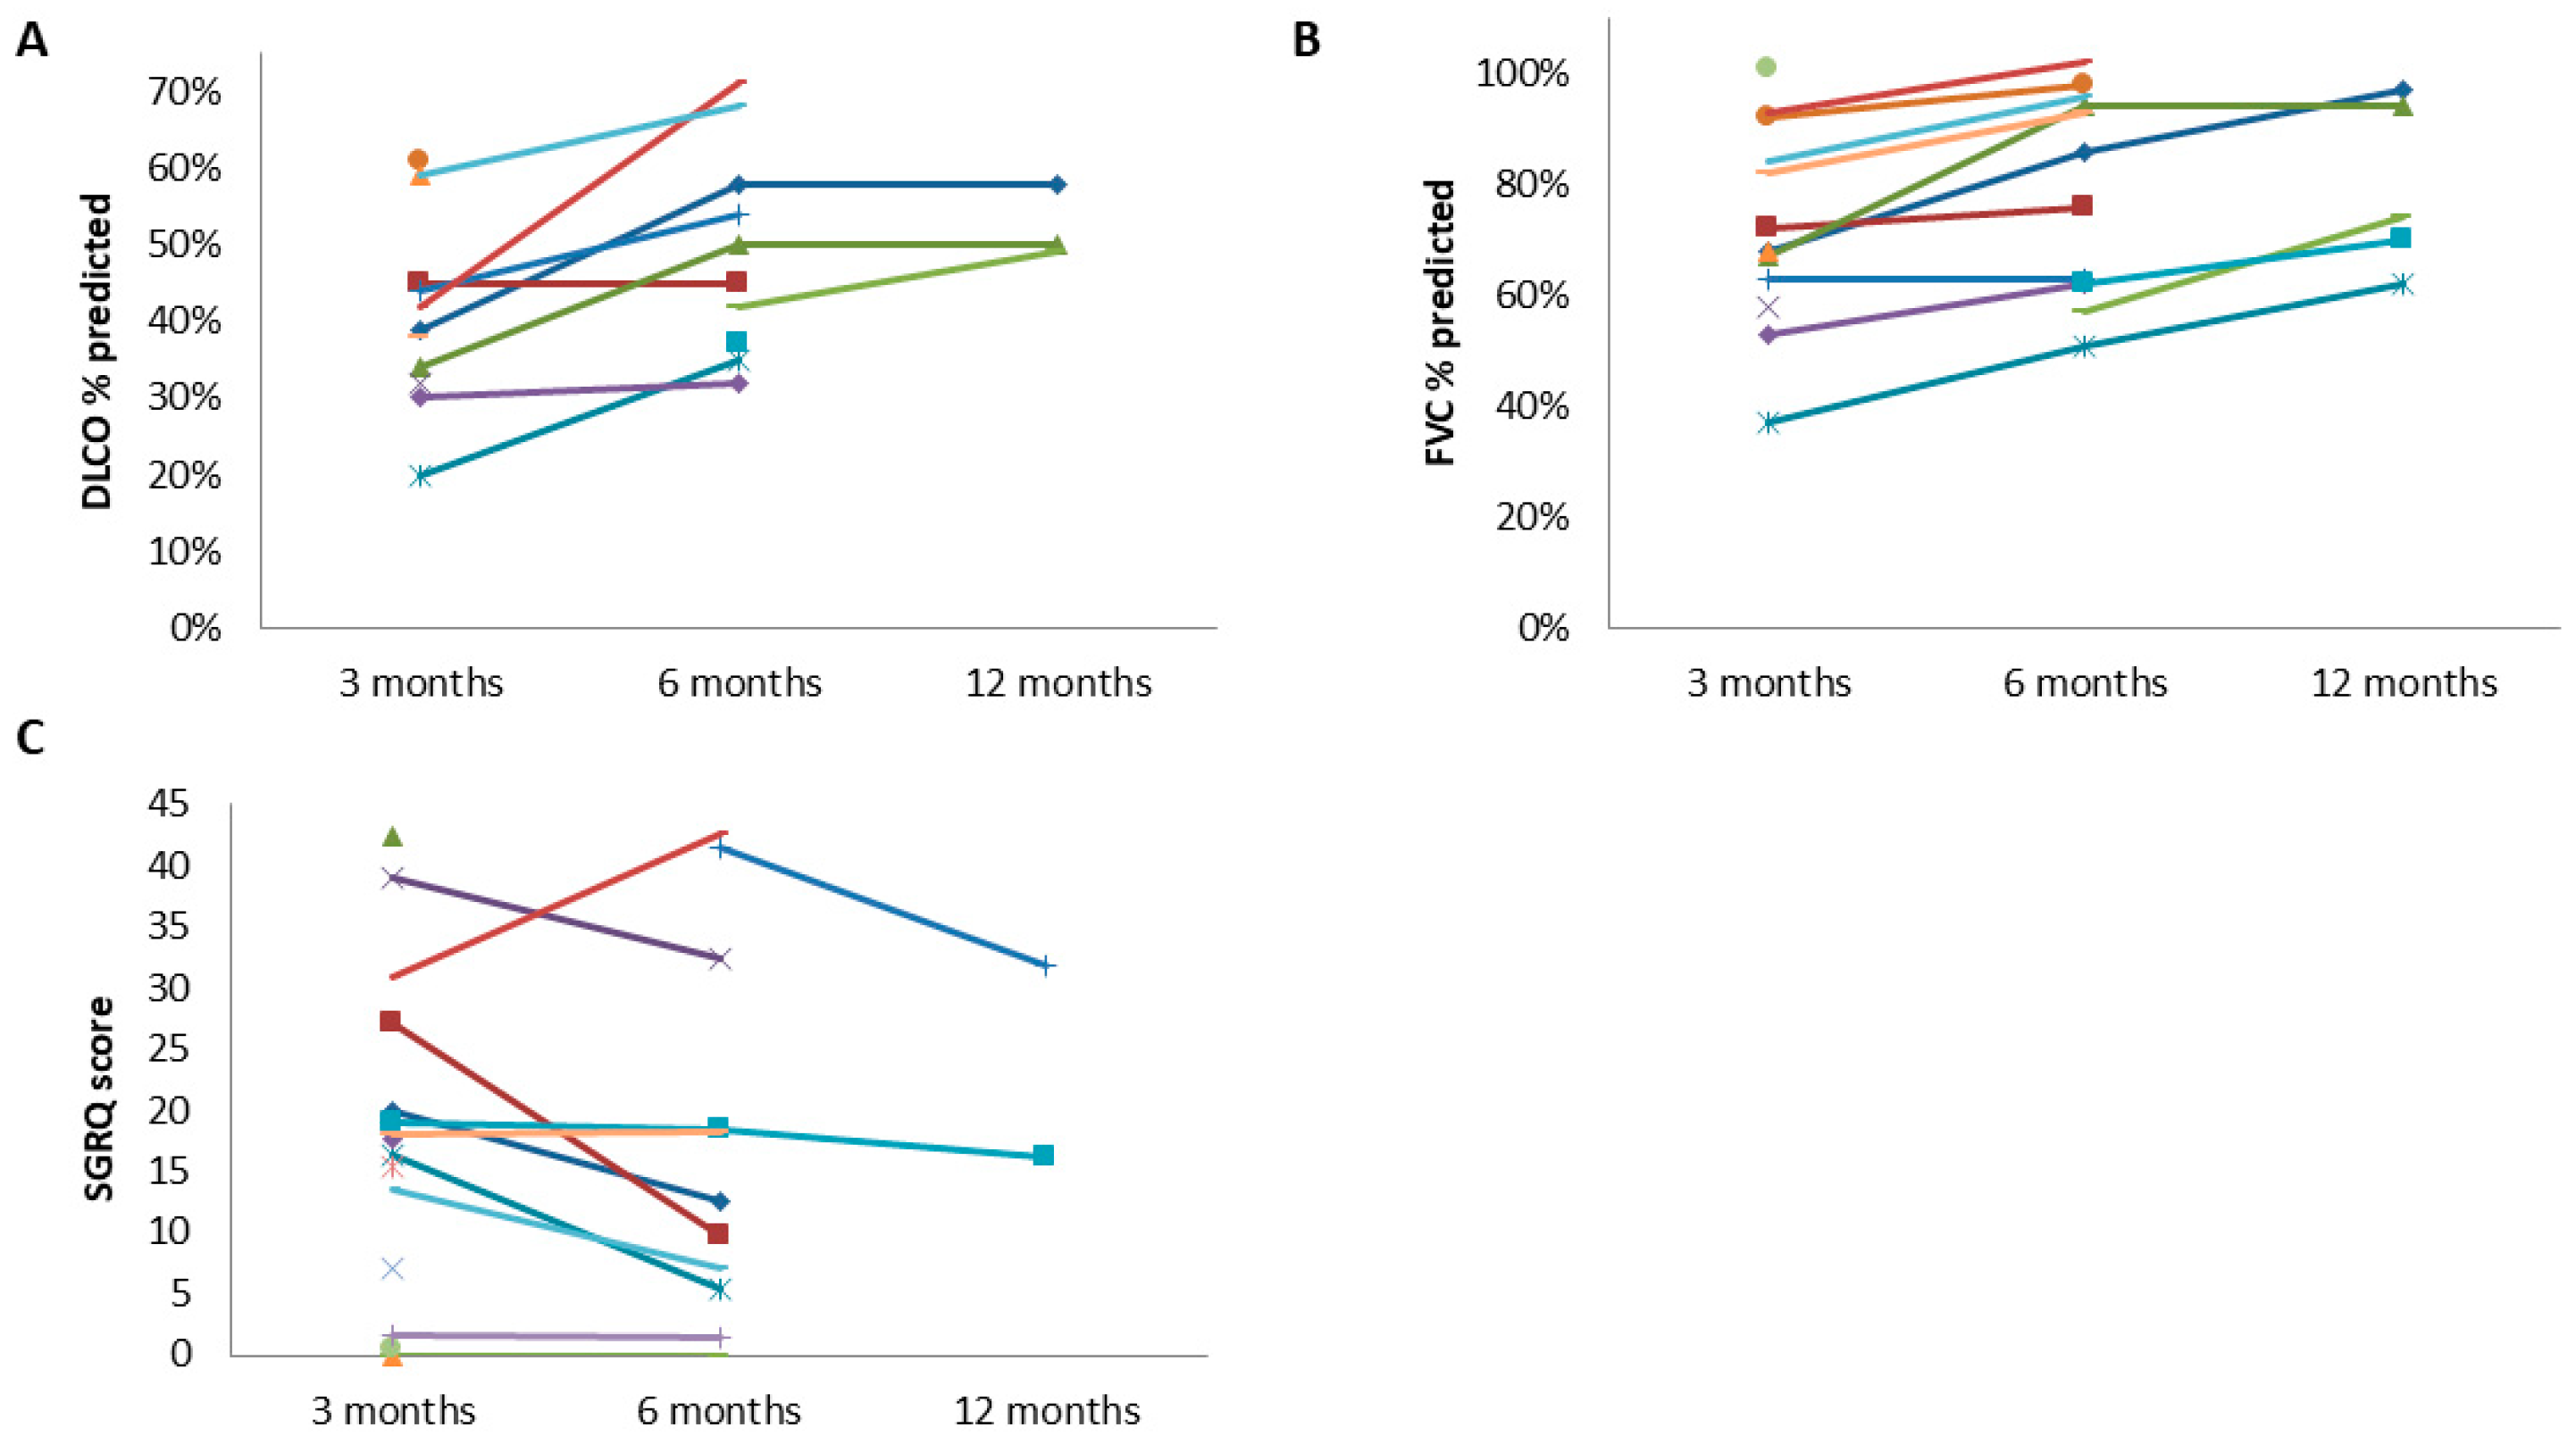
3.4. Spirometry
3.5. Diffusion Capacity
3.6. Oxygen Therapy and SpO2
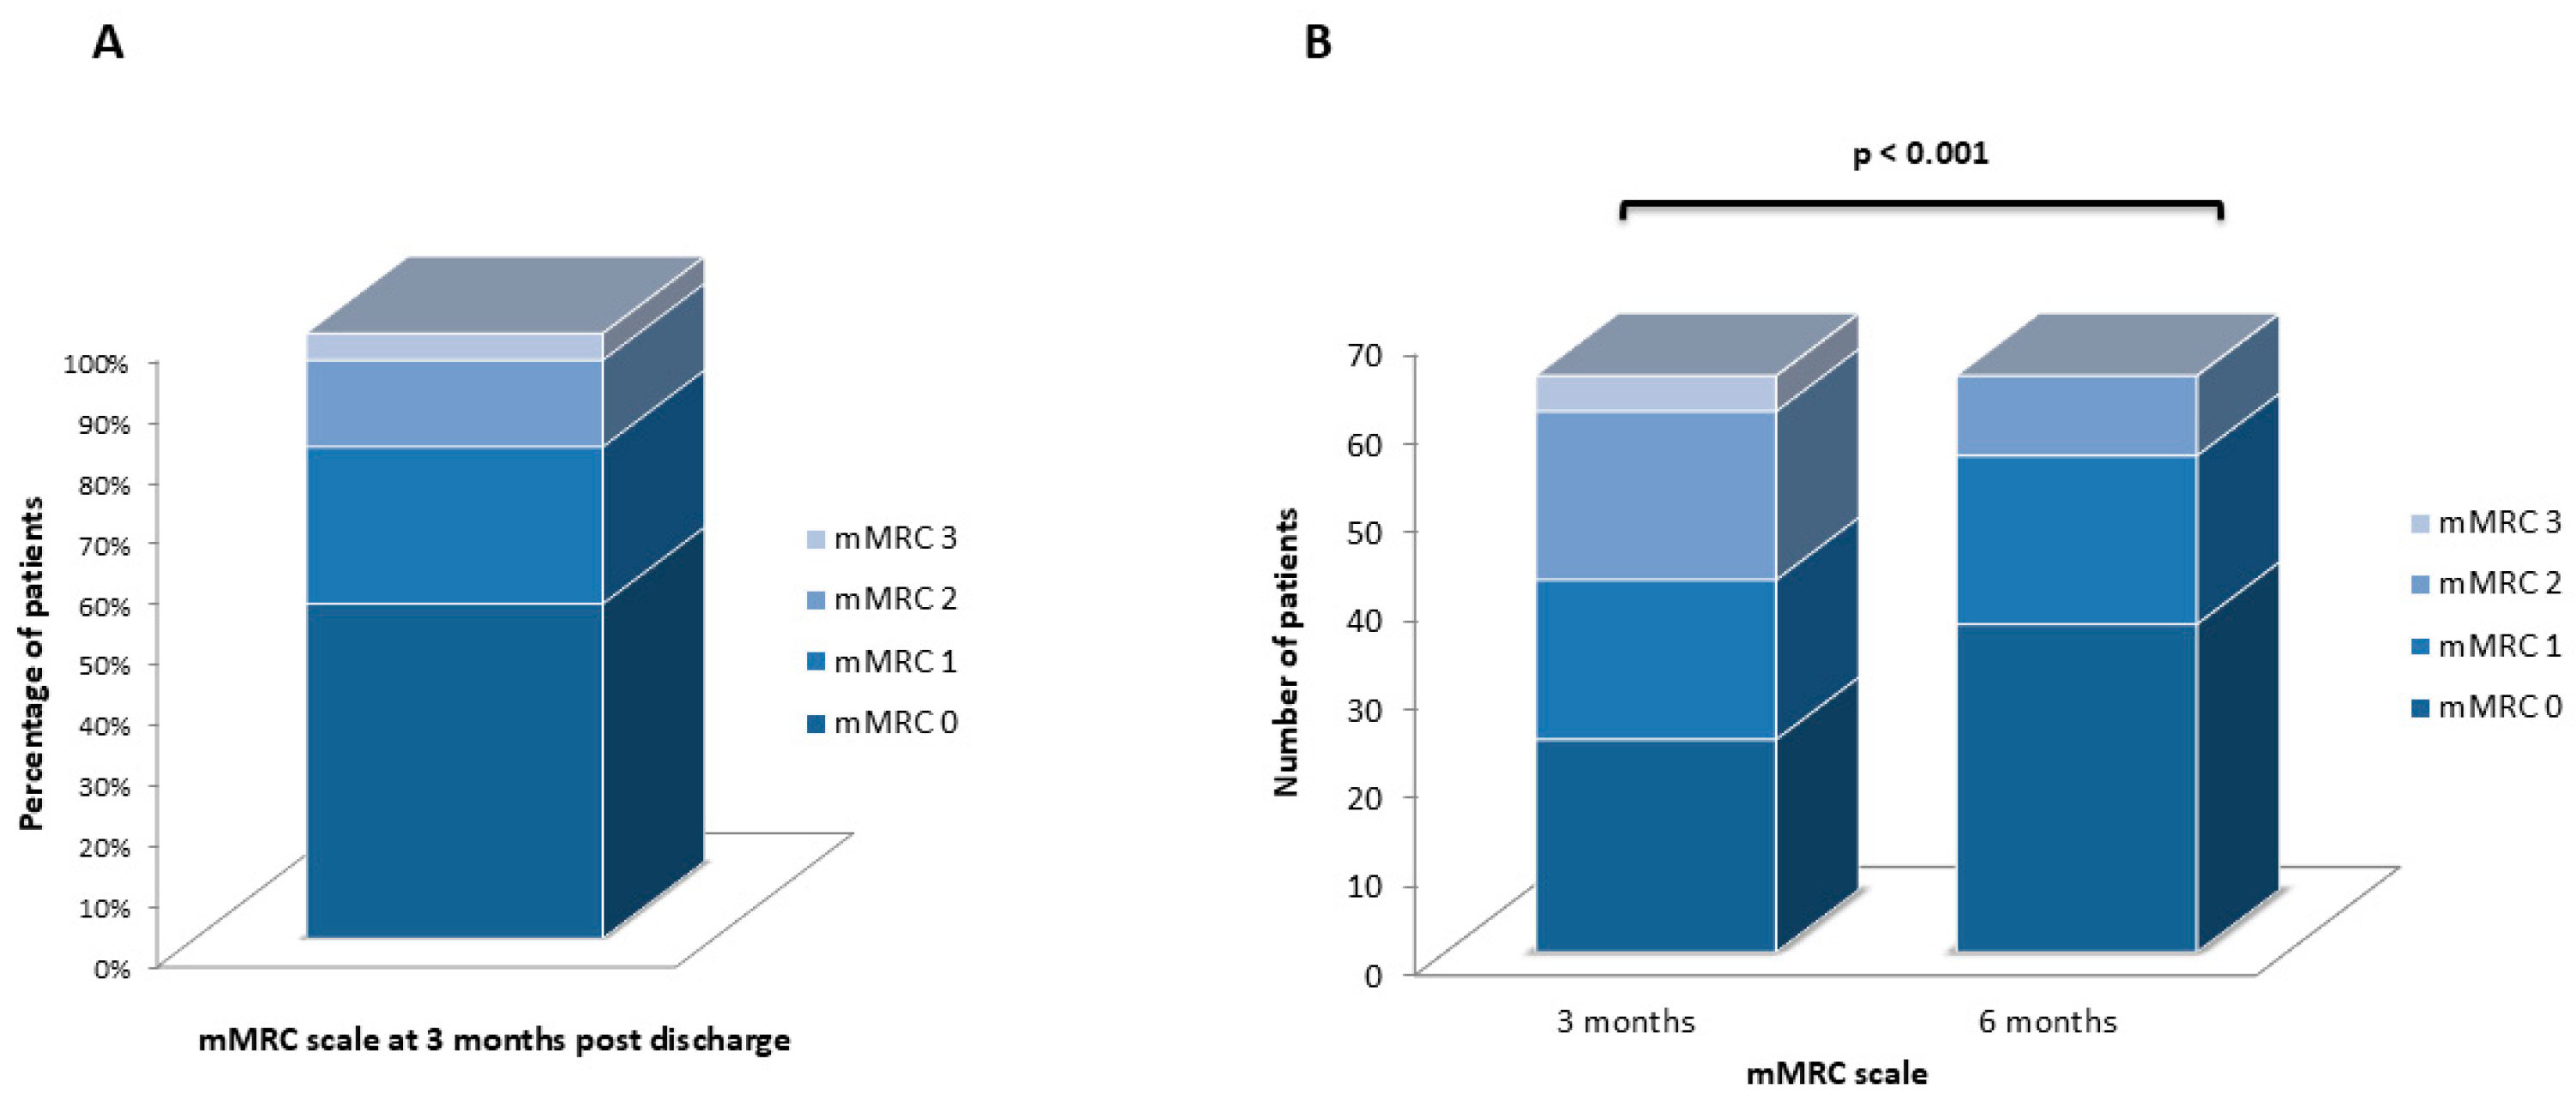
3.7. mMRC Scale
3.8. SGRQ
3.9. Conclusive Evaluation
4. Discussion
5. Conclusions
Author Contributions
Funding
Institutional Review Board Statement
Informed Consent Statement
Data Availability Statement
Conflicts of Interest
Appendix A

| Parameters at 3 Months | Parameters at 6 Months | |||||
|---|---|---|---|---|---|---|
| Patients Follow-up at 6 Months | Patients Lost to Follow-up at 6 Months | p-Value | Patients Follow-up at 12 Months | Patients Lost to Follow-up at 12 Months | p-Value | |
| Number of patients | 71 | 126 | 16 | 66 | ||
| Age (years), median (IQR) | 58 (50–67) | 56 (48–66) | 0.383 | 57.5 (48.5–66) | 56 (50–66.5) | 0.908 |
| Sex (male), n (%) | 40 (56.3) | 81 (66.3) | 0.271 | 8 (50) | 40 (60.6) | 0.439 |
| Functional parameters | ||||||
| FEV1 (%), median (IQR) | 86 (74–100) | 93 (83–102) | 0.01 | 93 (80–97) | 94 (83–106) | 0.204 |
| FVC (%), median (IQR) | 85 (74–100) | 94 (84–103) | 0.011 | 91 (84–95) | 97 (84–105) | 0.107 |
| DLCO (%), median (IQR) | 60.5 (44.5–65.5) | 70 (61–80) | <0.001 | 59 (51.5–50) | 68 (59–77) | 0.006 |
| SpO2 (%), median (IQR) | 98 (97–98) | 98 (97–98) | 0.931 | 98 (97–98) | 98 (97–98) | 0.987 |
| mMRC scale, | <0.001 | 0.294 | ||||
| n (%) | ||||||
| 0 | 26 (36.6) | 74 (58.7) | 7 (43.8) | 34 (51.5) | ||
| 1 | 19 (26.8) | 28 (22.2) | 8 (50) | 15 (22.8) | ||
| 2 | 19 (26.8) | 7 (5.6) | 1 (6.2) | 8 (12.1) | ||
| 3 | 5 (7) | 3 (2.4) | 0 (0) | 1 (1.5) | ||
| NA | 2 (2.8) | 14 (11.1) | 0 (0) | 8 (12.1) | ||
| SGRQ, median (IQR) | 19.9 (4.4–34.8) | 6.4 (0–17.6) | <0.001 | 28.4 (13.6–32.2) | 8 (0.3–26.5) | 0.038 |
| Imaging parameters | ||||||
| Number of patients | 43 | 125 | 14 | 37 | ||
| COVID-19 opacities (Co.VA.Sc score), n (%) | <0.001 | 0.201 | ||||
| 0 | 3 (6.9) | 35 (28) | 2 (14.3) | 10 (27) | ||
| 1 | 14 (32.5) | 56 (44.8) | 5 (35.7) | 17 (46) | ||
| 2 | 17 (39.5) | 30 (24) | 4 (28.6) | 9 (24.3) | ||
| 3 | 7 (16.2) | 3 (2.4) | 2 (14.3) | 1 (2.7) | ||
| 4 | 1 (2.3) | 1 (0.8) | 1 (7.1) | 0 (0) | ||
| 5 | 1 (2.3) | 0 (0) | 0 (0) | 0 (0) | ||
| Parenchymal bands, n (%) | 37 (86) | 68 (54.4) | <0.001 | 12 (85.7) | 24 (64.9) | 0.145 |
| Fibrotic-like changes, n (%) | 13 (30.2) | 4 (3.3) | <0.001 | 4 (28.6) | 8 (21.6) | 0.602 |
| Univariate Analysis | Multivariate Analysis | |||||
|---|---|---|---|---|---|---|
| Variable | OR | 95% CI | p-Value | OR | 95% CI | p-Value |
| Age | 1.007 | 0.969–1.046 | 0.732 | |||
| Gender (male) | 1.303 | 0.468–3.629 | 0.613 | |||
| BMI | 0.949 | 0.852–1.056 | 0.337 | |||
| Smoking status | 1.607 | 0.556–4.331 | 0.349 | |||
| Vaccination history | 0.637 | 0.196–2.306 | 0.492 | |||
| Length of hospital stay | 1.057 | 1.035–1.088 | <0.001 | 1.062 | 1.025–1.100 | 0.01 |
| Co.Va.SC score on admission | 2.068 | 1.149–3.722 | 0.015 | 1.385 | 0.758–2.528 | 0.289 |
| FiO2 ≥ 50% | 0.544 | 0.172–1.722 | 0.300 | |||
| HFNC therapy | 0.914 | 0.345–2.423 | 0.857 | |||
| Intubation | 3.1 | 1.066–9.012 | 0.038 | 0.483 | 0.1–2.338 | 0.366 |


References
- Holshue, M.L.; DeBolt, C.; Lindquist, S.; Lofy, K.H.; Wiesman, J.; Bruce, H.; Spitters, C.; Ericson, K.; Wilkerson, S.; Tural, A.; et al. First Case of 2019 Novel Coronavirus in the United States. N. Engl. J. Med. 2020, 382, 929–936. [Google Scholar] [CrossRef]
- World Health Organization (WHO). Coronavirus Disease (COVID-19) Pandemic. Available online: https://www.who.int/europe/emergencies/situations/covid-19/ (accessed on 24 November 2024).
- World Health Organization (WHO). Coronavirus Disease (COVID-19) Dashboard. Available online: https://covid19.who.int/ (accessed on 24 November 2024).
- Hoffmann, M.; Kleine-Weber, H.; Schroeder, S.; Krüger, N.; Herrler, T.; Erichsen, S.; Schiergens, T.S.; Herrler, G.; Wu, N.H.; Nitsche, A.; et al. SARS-CoV-2 Cell Entry Depends on ACE2 and TMPRSS2 and Is Blocked by a Clinically Proven Protease Inhibitor. Cell 2020, 181, 271–280. [Google Scholar] [CrossRef]
- Wiersinga, W.J.; Rhodes, A.; Cheng, A.C.; Peacock, S.J.; Prescott, H.C. Pathophysiology, Transmission, Diagnosis, and Treatment of Coronavirus Disease 2019 (COVID-19): A Review. JAMA 2020, 324, 782–793. [Google Scholar] [CrossRef]
- Jin, Y.; Yang, H.; Ji, W.; Wu, W.; Chen, S.; Zhang, W.; Duan, G. Virology, Epidemiology, Pathogenesis, and Control of COVID-19. Viruses 2020, 12, 372. [Google Scholar] [CrossRef]
- Gulick, R.M.; Pau, A.K.; Daar, E.; Evans, L.; Gandhi, R.T.; Tebas, P.; Ridzon, R.; Masur, H.; Lane, H.C.; NIH COVID-19 Treatment Guidelines Panel. National Institutes of Health COVID-19 Treatment Guidelines Panel: Perspectives and Lessons Learned. Ann. Intern. Med. 2024, 177, 1547–1557. [Google Scholar] [CrossRef]
- Berlin, D.A.; Gulick, R.M.; Martinez, F.J. Severe COVID-19. N. Engl. J. Med. 2020, 383, 2451–2460. [Google Scholar] [CrossRef] [PubMed]
- Yüksel, A.; Karadoğan, D.; Hürsoy, N.; Telatar, G.; Köse, N.; Marım, F.; Kaya, I.; Er, A.B.; Erçelik, M.; Polat, D.; et al. Methylprednisolone in the treatment of post-COVID-19 Interstitial Lung Disease (STERCOV-ILD). In Proceedings of the ERS International Congress, Vienna, Austria, 4–6 September 2022. [Google Scholar] [CrossRef]
- Myall, K.J.; Mukherjee, B.; Castanheira, A.M.; Lam, J.L.; Benedetti, G.; Mak, S.M.; Preston, R.; Thillai, M.; Dewar, A.; Molyneaux, P.L.; et al. Persistent Post-COVID-19 Interstitial Lung Disease. An Observational Study of Corticosteroid Treatment. Ann. Am. Thorac. Soc. 2021, 18, 799–806. [Google Scholar] [CrossRef]
- Dhooria, S.; Chaudhary, S.; Sehgal, I.S.; Agarwal, R.; Arora, S.; Garg, M.; Prabhakar, N.; Puri, G.D.; Bhalla, A.; Suri, V.; et al. High-dose versus low-dose prednisolone in symptomatic patients with post-COVID-19 diffuse parenchymal lung abnormalities: An open-label, randomised trial (the COLDSTER trial). Eur. Respir. J. 2022, 59, 2102930. [Google Scholar] [CrossRef]
- Saiphoklang, N.; Patanayindee, P.; Ruchiwit, P. The Effect of Nintedanib in Post-COVID-19 Lung Fibrosis: An Observational Study. Crit. Care Res. Pract. 2022, 2022, 9972846. [Google Scholar] [CrossRef]
- Bazdyrev, E.; Rusina, P.; Panova, M.; Novikov, F.; Grishagin, I.; Nebolsin, V. Lung Fibrosis after COVID-19: Treatment Prospects. Pharmaceuticals 2021, 14, 807. [Google Scholar] [CrossRef]
- Cherrez-Ojeda, I.; Cortés-Telles, A.; Gochicoa-Rangel, L.; Camacho-Leon, G.; Mautong, H.; Robles-Velasco, K.; Faytong-Haro, M. Challenges in the Management of Post-COVID-19 Pulmonary Fibrosis for the Latin American Population. J. Pers. Med. 2022, 12, 1393. [Google Scholar] [CrossRef] [PubMed]
- Rajala, K.; Lehto, J.T.; Sutinen, E.; Kautiainen, H.; Myllärniemi, M.; Saarto, T. mMRC dyspnoea scale indicates impaired quality of life and increased pain in patients with idiopathic pulmonary fibrosis. ERJ Open Res. 2017, 3, 00084–2017. [Google Scholar] [CrossRef] [PubMed]
- Barr, J.T.; Schumacher, G.E.; Freeman, S.; LeMoine, M.; Bakst, A.W.; Jones, P.W. American translation, modification, and validation of the St. George’s Respiratory Questionnaire. Clin. Ther. 2000, 22, 1121–1145. [Google Scholar] [CrossRef] [PubMed]
- Vijayakumar, B.; Tonkin, J.; Devaraj, A.; Philip, K.E.J.; Orton, C.M.; Desai, S.R.; Shah, P.L. CT Lung Abnormalities after COVID-19 at 3 Months and 1 Year after Hospital Discharge. Radiology 2022, 303, 444–454. [Google Scholar] [CrossRef]
- Hansell, D.M.; Bankier, A.A.; MacMahon, H.; McLoud, T.C.; Müller, N.L.; Remy, J. Fleischner Society: Glossary of terms for thoracic imaging. Radiology 2008, 246, 697–722. [Google Scholar] [CrossRef] [PubMed]
- Arkoudis, N.A.; Tsochatzis, A.; Argentos, S.; Kontopoulou, C.; Mademli, M.; Spiliopoulos, S.; Oikonomopoulos, N. CT in patients with COVID-19: Imaging patterns, disease extent and evolution; our experience in a Greek reference University Hospital. Hell. J. Radiol. 2021, 6, 2–12. [Google Scholar] [CrossRef]
- Arkoudis, N.A.; Karofylakis, E.; Moschovaki-Zeiger, O.; Vrentzos, E.; Palialexis, K.; Filippiadis, D.; Oikonomopoulos, N.; Kelekis, N.; Spiliopoulos, S. COVID Visual Assessment Scale (“Co.V.A.Sc.”): Quantification of COVID-19 disease extent on admission chest computed tomography (CT) in the prediction of clinical outcome—A retrospective analysis of 273 patients. Emerg. Radiol. 2022, 29, 479–489. [Google Scholar] [CrossRef]
- Karageorgou, V.; Papaioannou, A.I.; Kallieri, M.; Blizou, M.; Lampadakis, S.; Sfika, M.; Krouskos, A.; Papavasileiou, V.; Strakosha, F.; Vandorou, K.T.; et al. Patients Hospitalized for COVID-19 in the Periods of Delta and Omicron Variant Dominance in Greece: Determinants of Severity and Mortality. J. Clin. Med. 2023, 12, 5904. [Google Scholar] [CrossRef]
- Wells, A.U.; Devaraj, A.; Desai, S.R. Interstitial Lung Disease after COVID-19 Infection: A Catalog of Uncertainties. Radiology 2021, 299, E216–E218. [Google Scholar] [CrossRef]
- Han, X.; Fan, Y.; Alwalid, O.; Li, N.; Jia, X.; Yuan, M.; Li, Y.; Cao, Y.; Gu, J.; Wu, H.; et al. Six-month Follow-up Chest CT Findings after Severe COVID-19 Pneumonia. Radiology 2021, 299, E177–E186. [Google Scholar] [CrossRef]
- McGroder, C.F.; Zhang, D.; Choudhury, M.A.; Salvatore, M.M.; D’Souza, B.M.; Hoffman, E.A.; Wei, Y.; Baldwin, M.R.; Garcia, C.K. Pulmonary fibrosis 4 months after COVID-19 is associated with severity of illness and blood leucocyte telomere length. Thorax 2021, 76, 1242–1245. [Google Scholar] [CrossRef]
- Chen, J.; Wu, J.; Hao, S.; Yang, M.; Lu, X.; Chen, X.; Li, L. Long term outcomes in survivors of epidemic Influenza A (H7N9) virus infection. Sci. Rep. 2017, 7, 17275. [Google Scholar] [CrossRef] [PubMed]
- Matthay, M.A.; Zemans, R.L.; Zimmerman, G.A.; Arabi, Y.M.; Beitler, J.R.; Mercat, A.; Herridge, M.; Randolph, A.G.; Calfee, C.S. Acute respiratory distress syndrome. Nat. Rev. Dis. Primers 2019, 5, 18. [Google Scholar] [CrossRef] [PubMed]
- Villar, J.; Zhang, H.; Slutsky, A.S. Lung Repair and Regeneration in ARDS: Role of PECAM1 and Wnt Signaling. Chest 2019, 155, 587–594. [Google Scholar] [CrossRef] [PubMed]


| All Patients | Patients Without Fibrotic-like Changes | Patients With Fibrotic-like Changes | p-Value | |
|---|---|---|---|---|
| Number of pts | 198 | 180 (90.9) | 18 (9.1) | |
| Age (years), median (IQR) | 57 (49–66) | 57 (48–66) | 57 (52–67) | 0.69 |
| Sex (male), n (%) | 121 (61.1) | 119 (66.1) | 12 (66.6) | 0.612 |
| Smoking history, n (%) | 100 (50.5) | 89 (49.4) | 11 (61.1) | 0.345 |
| ΒΜΙ (kg/m2), median (IQR) | 29.4 (27.3–33.1) | 29.4 (27.4–33) | 29.1 (26.8–32.3) | 0.414 |
| Vaccinated, n (%) | 46 (23.2) | 43 (23.8) | 3 (16.6) | 0.481 |
| Comorbidities | ||||
| COPD/asthma, n (%) | 13 (6.5) | 10 (5.5) | 3 (16.6) | 0.483 |
| ILD, n (%) | 2 (1) | 2 (1.1) | 0 (0) | N/A |
| Diabetes, n (%) | 35 (17.6) | 34 (18.8) | 1 (5.5) | 0.155 |
| Dyslipidemia, n (%) | 56 (28.3) | 55 (30.5) | 1 (5.5) | 0.025 |
| Hypertension, n (%) | 79 (39.8) | 73 (40.5) | 6 (33.3) | 0.551 |
| CVD/Heart failure, n (%) | 12 (6.1) | 12 (6.6) | 0 (0) | N/A |
| Autoimmune disease, n (%) | 17 (8.6) | 16 (8.8) | 1 (5.5) | 0.63 |
| Current cancer, n (%) | 3 (1.5) | 3 (1.6) | 0 (0) | N/A |
| Length of stay (days), median (IQR) | 17 (12–25) | 16 (12–22) | 28.5 (18–64) | 0.001 |
| COVID-19 therapy #, n (%) | ||||
| Remdesivir | 184 (92.9) | 166 (92.2) | 18 (100) | 0.22 |
| Dexamethasone | 189 (95.4) | 171 (95) | 18 (100) | 0.332 |
| Immunomodulators | 105 (53) | 83 (46.1) | 12 (66.6) | 0.224 |
| Respiratory support | ||||
| FiO2 ≥ 50%, n (%) | 66 (37.3) | 62 (34.4) | 4 (22.2) | 0.294 |
| HFNC, n (%) | 92 (46.4) | 84 (46.6) | 8 (44.4) | 0.857 |
| Intubation, n (%) | 31 (15.6) | 25 (13.8) | 6 (33.3) | 0.003 |
| Patients With Fibrotic-like Changes at 3 Months | Patients Without Fibrotic-like Changesat 3 Months | p-Value | Patients With Fibrotic-like Changes at 6 Months | Patients Without Fibrotic-like Changes at 6 Months | p-Value | |
|---|---|---|---|---|---|---|
| Number of patients | 17 | 170 | 14 | 68 | ||
| Age (years), median [IQR] | 58 (52–67) | 57 (48–66) | 0.696 | 56 (49–66) | 61 (53–67) | 0.386 |
| Sex (male), n (%) | 11 (64.7) | 104 (61.2) | 0.776 | 8 (57.1) | 37 (54.4) | 0.988 |
| Functional parameters | ||||||
| FEV1 (%), median (IQR) | 68 (63–86) | 91.5 (80–102) | <0.001 | 88 (65–100) | 94 (84–106) | 0.151 |
| FVC (%), median (IQR) | 68 (62–84) | 92.5 (82–103) | <0.001 | 86 (61–98) | 94 (86.5–100) | 0.035 |
| DLCO (%), median (IQR) | 39 (34–59) | 66 (60–78) | <0.001 | 57.5 (45–68) | 66 (59.5–76) | 0.031 |
| SpO2 (%), median (IQR) | 98 (97–98) | 98 (97–98) | 0.233 | 98 (97–98) | 98 (97–98) | 0.143 |
| mMRC scale, | 0.005 | 0.554 | ||||
| n (%) | ||||||
| 0 | 6 (35.3) | 94 (55.3) | 7 (50) | 34 (50) | ||
| 1 | 2 (11.7) | 45 (26.5) | 3 (21.4) | 20 (29.4) | ||
| 2 | 7 (41.2) | 19 (11.2) | 3 (21.4) | 6 (8.8) | ||
| 3 | 1 (5.9) | 3 (1.7) | 0 (0) | 1 (1.5) | ||
| NA | 1 (5.9) | 9 (5.3) | 1 (7.2) | 7 (10.3) | ||
| SGRQ, median (IQR) | 16.9 (4.4–23.9) | 10.8 (0–24.3) | 0.377 | 28.1 (6.23–32.9) | 14.9 (1.1–27.8) | 0.24 |
Disclaimer/Publisher’s Note: The statements, opinions and data contained in all publications are solely those of the individual author(s) and contributor(s) and not of MDPI and/or the editor(s). MDPI and/or the editor(s) disclaim responsibility for any injury to people or property resulting from any ideas, methods, instructions or products referred to in the content. |
© 2025 by the authors. Licensee MDPI, Basel, Switzerland. This article is an open access article distributed under the terms and conditions of the Creative Commons Attribution (CC BY) license (https://creativecommons.org/licenses/by/4.0/).
Share and Cite
Antonogiannaki, E.-M.; Grigoropoulos, I.; Manali, E.D.; Thomas, K.; Kallieri, M.; Alexopoulou, P.; Papaioannou, A.I.; Prountzos, S.; Karachaliou, A.; Kontopoulou, C.; et al. Long-Term Lung Sequelae in Survivors of Severe/Critical COVID-19 Pneumonia: The “Non-Steroid”, “Non-Interventional” Approach. J. Clin. Med. 2025, 14, 347. https://doi.org/10.3390/jcm14020347
Antonogiannaki E-M, Grigoropoulos I, Manali ED, Thomas K, Kallieri M, Alexopoulou P, Papaioannou AI, Prountzos S, Karachaliou A, Kontopoulou C, et al. Long-Term Lung Sequelae in Survivors of Severe/Critical COVID-19 Pneumonia: The “Non-Steroid”, “Non-Interventional” Approach. Journal of Clinical Medicine. 2025; 14(2):347. https://doi.org/10.3390/jcm14020347
Chicago/Turabian StyleAntonogiannaki, Elvira-Markela, Ioannis Grigoropoulos, Effrosyni D. Manali, Konstantinos Thomas, Maria Kallieri, Panagiota Alexopoulou, Andriana I. Papaioannou, Spyridon Prountzos, Anastasia Karachaliou, Christina Kontopoulou, and et al. 2025. "Long-Term Lung Sequelae in Survivors of Severe/Critical COVID-19 Pneumonia: The “Non-Steroid”, “Non-Interventional” Approach" Journal of Clinical Medicine 14, no. 2: 347. https://doi.org/10.3390/jcm14020347
APA StyleAntonogiannaki, E.-M., Grigoropoulos, I., Manali, E. D., Thomas, K., Kallieri, M., Alexopoulou, P., Papaioannou, A. I., Prountzos, S., Karachaliou, A., Kontopoulou, C., Karageorgou, V., Lampadakis, S., Blizou, M., Tomos, I., Grigoropoulou, S., Kavatha, D., Loukides, S., Antoniadou, A., & Papiris, S. A. (2025). Long-Term Lung Sequelae in Survivors of Severe/Critical COVID-19 Pneumonia: The “Non-Steroid”, “Non-Interventional” Approach. Journal of Clinical Medicine, 14(2), 347. https://doi.org/10.3390/jcm14020347