Abstract
Background/Objectives: Fragility fractures, particularly in the vertebra and hip, are a significant health concern in the elderly, often associated with osteoporosis. Emerging evidence suggests a link between lipid profiles and bone health, but the characteristics of lipid biomarkers in patients with fragility fractures remain underexplored. Methods: This study analyzed serum lipid biomarkers, including total cholesterol (TC), triglycerides (TG), high-density lipoprotein cholesterol (HDL-C), and low-density lipoprotein cholesterol (LDL-C) in 10,540 patients aged 50 and older with either vertebral or hip fragility fractures. We compared lipid levels between the two fracture groups and examined the relationship between lipid profiles and baseline characteristics of patients. Results: Patients with vertebral fractures exhibited significantly higher serum levels of TC, TG, HDL-C, and LDL-C compared to those with hip fractures. These differences remained statistically significant after adjusting for confounding variables. Multivariable regression analysis revealed that age was inversely associated with TC, TG, and LDL-C, but positively associated with HDL-C. All lipid levels were significantly higher in women than in men. Time from fracture to admission and BMI were positively associated with TG levels and inversely associated with HDL-C. Vertebral fracture patients had a higher prevalence of abnormally high TC (3.03% vs. 0.78%), TG (9.15% vs. 3.54%), and LDL-C (2.80% vs. 1.04%), but lower prevalence of abnormally low HDL-C (20.53% vs. 26.66%; p < 0.001 for all). Conclusions: Our findings highlight distinct lipid profile characteristics in patients with vertebral and hip fragility fractures, suggesting that physiological or metabolic changes following different fracture types may differentially influence lipid metabolism. These insights may inform targeted prevention and management strategies for fragility fractures.
1. Introduction
Fragility fractures, also known as fragility fractures, represent the most severe consequence of osteoporosis. It was estimated that the global population aged 50 years and older at risk of fragility fractures was 158 million in 2010, and this number is projected to double by 2040 [1]. In 2013, the International Osteoporosis Foundation (IOF) reported that a fragility fracture occurs globally every three seconds [2]. Fragility fractures have become a major global public health concern. They not only cause pain and disability, significantly reducing patients’ quality of life, but fractures at specific sites, particularly the vertebra and hip, also increase mortality risk and impose substantial medical and economic burdens on healthcare systems [3,4].
Numerous clinical risk factors associated with fracture risk have been identified, including low bone mineral density (BMD), prior fracture, sex (female), early menopause, advanced age, low body weight, and glucocorticoid treatment [5]. Furthermore, serum lipid profiles have been suggested as potential factors linked to osteoporosis and fragility fractures. Previous meta-analyses indicated that the use of lipid-lowering agents was associated with increased BMD at various sites and a reduced risk of fragility fractures, supporting a connection between serum lipids and osteoporosis [6,7,8]. In recent years, there has been growing insight into the relationships between blood lipid levels, metabolism, and osteoporosis [9,10,11]. Associations between BMD, metabolic syndrome, and cardiovascular events have been reported, and lipid profiles may play a significant role in these links [12,13,14,15].
Many observational studies have investigated the relationship between specific lipid biomarkers and BMD or fracture risk [16,17,18,19,20,21,22]. These biomarkers include total cholesterol (TC), triglycerides (TG), high-density lipoprotein cholesterol (HDL-C), and low-density lipoprotein cholesterol (LDL-C). However, to the best of our knowledge, the characteristics of the serum lipid profiles in patients who have already sustained a fragility fracture remain unreported. The vertebra and hip are common sites for fragility fractures. In this study, we focused on patients aged 50 years and older with vertebral or hip fragility fractures, aiming to analyze the characteristics of serum cholesterol levels (TC, TG, HDL-C, and LDL-C) in this fracture population. We further examined the correlations between these lipid biomarkers and age, sex, body mass index (BMI), time from fracture to hospital, and fracture sites.
2. Materials and Methods
2.1. Study Population
This is a single-center retrospective study. Patients with vertebral or hip fragility fractures were identified from the Fragility Fracture Database established by Honghui Hospital, Xi’an Jiaotong University [23,24]. We exported information (epidemiological data, medical history, and lipid biochemical indicators) of patients hospitalized from January 2020 to August 2023 from the database. Patients were included in this study based on the following criteria: (1) Age ≥ 50 years and postmenopausal status (for females); (2) Fracture sustained due to low energy trauma (Falls from standing height or lower, and daily activities such as bending over, coughing, and sneezing) or no identifiable trauma; (3) Confirmed diagnosis of vertebral or hip fragility fracture; (4) Availability of lipid biomarker measurements. Exclusion criteria were: (1) Fractures at sites other than the vertebra or hip; (2) Duration exceeding 3 months between fracture occurrence and hospital admission; (3) Pathological fractures secondary to malignancy. The study protocol received approval from the Institutional Review Board of Honghui Hospital, Xi’an Jiaotong University (Approval No. 202305003), and informed consent was waived due to the retrospective nature of the study utilizing deidentified data.
2.2. Measurement of Lipid Biomarkers and Definition of Abnormalities
Fasting blood samples were collected in the morning within 24 h of admission and centrifuged to obtain serum. Serum levels of TC, TG, HDL-C, and LDL-C were measured preoperatively for all enrolled fracture patients using a Roche Cobas 6000 biochemical analyzer (Roche, Basel, Switzerland), with all assays performed using original manufacturer’s reagents and following standard calibration and quality control procedures. Abnormal lipid biomarkers were defined according to the reference ranges recommended by the Chinese guideline for lipid management [25]:
- TC: Optimal level < 5.2 mmol/L; High level ≥ 6.2 mmol/L
- TG: Optimal level < 1.7 mmol/L; High level ≥ 2.3 mmol/L
- HDL-C: Low level < 1.0 mmol/L
- LDL-C: Optimal level < 3.4 mmol/L; High level ≥ 4.1 mmol/L
Lipid biomarkers were considered abnormal if they fell into the high or low categories defined above.
2.3. Statistical Analysis
Categorical data are presented as numbers and percentages (%) and were compared between groups using the Chi-square (χ2) test. Normally distributed continuous data are expressed as mean ± standard deviation (SD) and were compared using Student’s t test. Continuous variables not conforming to a normal distribution are presented as median (interquartile range, IQR), and group comparisons were performed using the Mann–Whitney U test. Multivariate linear regression analysis was used to determine the association of lipid markers with age, sex, BMI, fracture sites, time from fracture to hospital, smoking history, drinking history, history of fractures, history of cancer, diabetes, anemia, and coronary disease. Multivariate logistic regression analysis was used to compare the risk of abnormal blood lipid between patients with vertebral and hip fractures. All statistical analyses were performed using IBM SPSS Statistics version 27.0 (IBM Corp., Armonk, NY, USA). To mitigate potential false positives resulting from the large sample size, a p-value < 0.01 was defined as statistically significant.
3. Results
3.1. Characteristics of the Study Population
As shown in Figure 1, based on the inclusion and exclusion criteria, this study ultimately included 10,540 patients with vertebral and hip fractures.
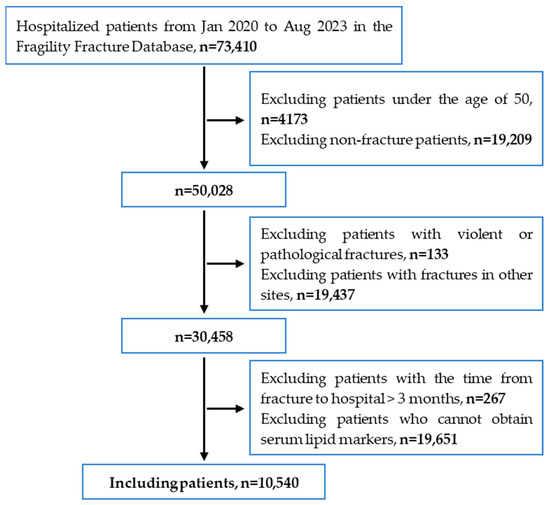
Figure 1.
Patient screening flowchart for this study.
The mean age of the 5817 patients with vertebral fragility fractures was 68.61 years, while the mean age of the 4723 patients with hip fragility fractures was 75.78 years (Table 1). This difference in age between the two groups was statistically significant (p < 0.001). Compared to hip fracture patients, the proportion of males was significantly lower among vertebral fracture patients (29.43% vs. 35.36%, p < 0.001). Vertebral fracture patients had higher BMI and a longer time from fracture to hospital. The proportions of patients with a history of fractures and cancer were significantly higher in the vertebral fracture group. Conversely, hip fracture patients had a higher prevalence of diabetes, anemia, and coronary disease. There were no significant differences between the two fracture groups regarding the proportions of patients with a history of smoking and drinking.

Table 1.
Characteristics of the study population.
3.2. The Differences in Lipid Biomarkers Between Patients with Vertebral Fracture and Hip Fracture
Student’s t test showed patients with vertebral fracture had higher serum levels of TC, TG, HDL-C, and LDL-C compared to hip fracture patients (Table 2). These differences were also validated in a multiple linear regression model with or without adjusting for variables, including age, sex, BMI, time from fracture to hospital, history of fractures, history of cancer, diabetes, anemia, and coronary disease.
Table 2.
The differences in lipid biomarkers between patients with vertebral fracture and hip fracture.
3.3. Blood Lipid Characteristics of Patients with Vertebral and Hip Fragility Fractures
To evaluate the characteristics of lipid profiles in patients with vertebral and hip fragility fractures, we used multiple linear regression to examine the associations of TC, TG, HDL-C, and LDL-C with variables including age, sex, BMI, time from fracture to hospital, smoking history, drinking history, history of fractures, history of cancer, diabetes, anemia, and coronary disease (Table 3).
Table 3.
Multivariate linear regression analysis of lipid profile characteristics in patients with fragility fractures.
The levels of TC, TG, and LDL-C displayed a negative association with age in patients with vertebral fracture or hip fracture (p < 0.001) in Model 1 (no covariates were adjusted). After adjusting for confounders (Model 2), a negative association was still present and statistically significant. However, HDL-C levels were positively associated with age in Model 1 and Model 2.
Using females as the reference, regression analyses—both unadjusted and adjusted—consistently showed that all lipid marker levels were significantly lower in males than in females (p < 0.001).
Regarding BMI, although Model 1 indicated significant positive associations between serum TC, LDL-C and BMI, these associations lost significance after adjustment for covariates. In contrast, TG showed a significant positive association with BMI, while HDL-C was negatively associated, both with and without adjustment.
Similarly to BMI, time from fracture to hospital was positively associated with TC and LDL-C in unadjusted models, but these associations ceased to be significant after adjustment. However, a consistently positive association was observed between time from fracture to hospital and TG regardless of adjustment. Interestingly, while no significant association was found between time from fracture to hospital and HDL-C in unadjusted models (p = 0.207), a significant negative relationship emerged after adjustment (p = 0.002).
Compared to patients with a history of smoking, those without exhibited only lower TC and HDL-C levels in unadjusted analyses; these differences became non-significant after adjustment. No significant associations were observed between smoking history and serum TG or LDL-C levels. Furthermore, all lipid indicators showed no significant associations with drinking history, prior fracture, or cancer—either with or without adjustment.
Relative to non-diabetic patients, those with diabetes demonstrated lower TC, HDL-C, and LDL-C levels, but higher TG levels. Compared to patients without anemia or coronary disease, those with either condition exhibited lower serum TC and LDL-C levels both with and without adjustment, while lower TG and HDL-C were observed only in unadjusted models.
3.4. Differences in Lipid Biomarkers Among Patients with Vertebral and Hip Fractures in Different Populations
To minimize the influence of other variables on the differences in lipid profiles between patients with vertebral and hip fractures, we conducted a stratified analysis based on various factors, as presented in Table 4. The results demonstrated that serum TC levels were consistently significantly higher in vertebral fracture patients than in hip fracture patients across all subgroups, regardless of whether other variables were adjusted or not. Regarding TG levels in vertebral fracture patients, after adjusting for covariates, significant differences compared to hip fracture patients were observed only in subgroups with BMI > 24.9 kg/m2 and in those with diabetes; in all other subgroups, TG levels remained significantly higher. For serum HDL-C levels, no significant differences were found between vertebral and hip fracture patients in subgroups including age < 80 years, females, BMI < 18.5 kg/m2, time from fracture to admission ≤ 72 h, and those with coronary disease. Significant differences in LDL-C levels between the two groups were absent only among patients with coronary disease; in all other subgroups, vertebral fracture patients exhibited significantly higher LDL-C levels than hip fracture patients.
Table 4.
Stratified analysis of differences in lipid profiles between patients with vertebral fractures and hip fractures.
3.5. Comparison of Proportions with Abnormal Lipid Indicators Between Vertebral and Hip Fracture Patients
As shown in Table 5, the proportion of patients with abnormally high levels was significantly greater in the vertebral fracture group compared to the hip fragility fracture group for TC (3.03% vs. 0.78%), TG (9.15% vs. 3.54%), and LDL-C (2.80% vs. 1.04%). Conversely, the proportion of patients with abnormally low HDL-C levels was significantly lower among vertebral fracture patients than hip fracture patients (20.53% vs. 26.66%).
Table 5.
Percentage and comparison of abnormal lipid biomarkers in patients with fragility fractures.
To eliminate the potential influence of other variables on the proportion of abnormal lipid indicators, we converted lipid values into dichotomous variables (normal vs. abnormal) and performed multivariate logistic regression analysis (Table 6). Using vertebral fracture as the reference group, the risk of abnormally high levels of TC (OR: 0.260, p < 0.001), TG (OR: 0.609, p < 0.001), and LDL-C (OR: 0.458, p < 0.001) remained significantly lower in hip fracture patients after adjusting for confounding variables, including age, sex, BMI, time from fracture to hospital, smoking history, drinking history, history of fractures, history of cancer, diabetes, anemia, and coronary disease. In contrast, hip fracture patients exhibited a significantly higher risk of abnormally low HDL-C levels compared to those with vertebral fractures (OR: 1.459, p < 0.001).
Table 6.
Multiple Logistic Regression Results.
4. Discussion
This study provided a novel insight into the serum lipid profiles of elderly patients with vertebral and hip fragility fractures, revealing significant differences in lipid biomarker levels and their associations with age, sex, BMI, time from fracture to hospital, and fracture site. These findings contribute to the growing body of evidence linking lipid metabolism to osteoporosis and fracture risk, with implications for both clinical practice and future research.
The elevated lipid levels in vertebral fracture patients compared to hip fracture patients may partly be explained by age differences, as vertebral fracture patients were significantly younger (mean age 68.61 vs. 75.78 years). Previous studies have shown that TC, TG, and LDL-C levels tend to decrease with advancing age, while HDL-C increases, consistent with our correlation findings [26,27]. However, these differences persisted even after adjusting for age and other covariates, suggesting that additional factors—such as fracture-specific pathophysiological mechanisms or risk profiles—may also play a role.
The age-related patterns of lipid biomarkers align with established literature. The negative association of TC, TG, and LDL-C with age, and the positive correlation of HDL-C with age, mirror trends observed in the general population [28]. In the context of fragility fractures, this implies that older patients, who are at greater risk of fractures, generally have lower TC, TG, and LDL-C levels but higher HDL-C. However, the role of HDL-C in bone health remains complex. Hussain et al. [16] reported that higher HDL-C levels were associated with increased fracture risk in older adults, which may relate to our finding of higher HDL-C in younger vertebral fracture patients. This paradox suggests that HDL-C’s impact on fracture risk may depend on fracture type, age, or comorbidities, warranting further exploration.
Sex differences in lipid profiles were also notable, with females exhibiting higher levels of all lipid biomarkers compared to males. This is consistent with post-menopausal lipid changes, where women often show elevated HDL-C and sometimes TC levels [29]. As our study included only postmenopausal women, these findings align with expected hormonal influences on lipid metabolism. Similarly, the positive association between TG and BMI reflects the well-documented association between higher body mass and dyslipidemia [30]. Conversely, serum levels of HDL-C showed a significant negative correlation with BMI, indicating that patients with higher body weight tend to have lower HDL-C levels. Indeed, well-established studies have demonstrated that obesity adversely affects HDL-C metabolism, resulting in reduced serum HDL-C concentrations [31,32,33].
Based on our findings, the observed differences in lipid profiles between vertebral and hip fracture patients may be importantly influenced by acute-phase responses following fracture. The significantly shorter time from fracture to admission in the hip fracture group, coupled with the positive association between longer time and higher TC, TG, and LDL-C levels—as well as the negative association with HDL-C—suggests that systemic inflammation in the early post-fracture period may transiently suppress lipid levels. Indeed, studies have found that among hospitalized older adults, patients with acute-phase symptoms exhibit lower levels of TC, LDL-C, and HDL-C compared to those without such symptoms [34]. Moreover, in both subgroups with time from fracture to hospital ≤72 h and >72 h, patients with vertebral fractures consistently exhibited higher levels of TC, TG, and LDL-C compared to those with hip fractures, suggesting that the differences in lipid profiles between the two fracture types may not be entirely attributable to acute-phase changes, but rather reflect underlying metabolic differences between these patient populations. The delayed emergence of a significant difference in HDL-C only in the >72 h subgroup further implies that HDL-C may be more sensitive to acute inflammatory suppression, and that differential regulation or recovery becomes apparent only after the initial phase. Although our study attempted to account for timing-related confounding through stratification and regression adjustment, the absence of direct inflammatory markers represents a limitation. Future studies incorporating biomarkers such as CRP or IL-6 could help clarify the interplay between fracture type, inflammation, and lipid metabolism.
The higher prevalence of abnormally high TC, TG, and LDL-C in vertebral fracture patients, coupled with a lower prevalence of abnormally low HDL-C, underscores the distinct lipid profiles between fracture groups. These differences may have implications for cardiovascular risk management, given dyslipidemia’s role in cardiovascular disease [35]. Mechanistically, lipids may influence bone health through inflammation, oxidative stress, or effects on osteoblast and osteoclast activity [36,37,38]. For example, high LDL-C and low HDL-C are linked to increased inflammation, which may exacerbate bone loss [39,40]. Our findings thus contribute to the growing evidence of a lipid-bone health nexus, as supported by prior studies linking lipid profiles to osteoporosis and fracture risk [41,42,43].
Clinically, these results suggest that lipid management strategies might need tailoring based on fracture site. The higher lipid levels in vertebral fracture patients, who are younger and may have a longer life expectancy, could justify more aggressive lipid-lowering interventions. In contrast, hip fracture patients, who are older and often frailer, may require a more conservative approach. Future studies should explore whether modulating lipid levels can influence fracture risk or recovery outcomes.
This study has several limitations. First, its retrospective design limits causal inferences regarding lipid biomarkers and fracture risk. Prospective studies are needed to elucidate whether lipid abnormalities precede or result from fractures. Second, the lack of BMD measurements in our cohort precludes direct assessment of the relationship between lipid profiles and BMD. Future studies should incorporate dual-energy X-ray absorptiometry (DXA) to clarify these associations. Third, our analysis did not account for lipid-lowering medication use, which could influence lipid levels and fracture risk. Detailed medication histories should be included in future research. Finally, the study population was limited to Chinese patients, and findings may not generalize to other ethnic groups with different lipid metabolism profiles.
5. Conclusions
This study systematically characterized the lipid profiles of older adults with vertebral and hip fragility fractures. We revealed that patients with vertebral fractures had higher levels of TC, TG, HDL-C, and LDL-C compared to those with hip fractures. These differences remained significant even after adjusting for other variables, suggesting that physiological and metabolic changes following fractures at different sites may exert distinct influences on lipid metabolism. Further research is essential to clarify these relationships and assess the potential of lipid-modifying interventions in fracture prevention and management.
Author Contributions
Conceptualization, Y.F., J.Y. and Y.Z.; methodology, Y.F., J.Y. and Y.Z.; software, Y.F. and J.Y.; validation, Y.F. and J.Y.; formal analysis, Y.F., J.Y. and Q.T.; investigation, Y.F., Q.T., S.L. and L.Y.; resources, Y.Z.; data curation, Q.T. and M.Y.; writing—original draft preparation, Y.F.; writing—review and editing, J.Y. and Y.Z.; visualization, Y.F., J.Y. and Y.Z.; supervision, J.Y. and Y.Z.; project administration, Y.Z.; funding acquisition, J.Y. and Y.Z. All authors have read and agreed to the published version of the manuscript.
Funding
This research was funded by the Fundamental Research Funds for the Central Universities (No. xzy012025148) and the Natural Science Basic Research Program of Shaanxi (No. 2023-JC-YB-814).
Institutional Review Board Statement
The study was conducted in accordance with the Declaration of Helsinki and approved by the Institutional Review Board of Honghui Hospital, Xi’an Jiaotong University (Reg. No. 202305003, Date:30 November 2022).
Informed Consent Statement
Given the non-invasive nature of the study, the large sample size, and the anonymity of the patients, patient consent was waived and agreed upon by the Institutional Review Board of Honghui Hospital, Xi’an Jiaotong University.
Data Availability Statement
The datasets generated and analyzed during the current study are not publicly available due to the limitations of our hospital’s information security and confidentiality system, but data are available from the corresponding author (yjchhyy2021@163.com or xahhzyh@163.com) with the appropriate approval from the Institutional Review Board of Honghui Hospital, Xi’an Jiaotong University.
Conflicts of Interest
The authors declare no conflicts of interest.
Abbreviations
The following abbreviations are used in this manuscript:
| TC | Total cholesterol |
| TG | Triglycerides |
| HDL-C | High-density lipoprotein |
| LDL-C | Low-density lipoprotein |
| BMD | Bone mineral density |
| BMI | Body mass index |
References
- Odén, A.; McCloskey, E.V.; Kanis, J.A.; Harvey, N.C.; Johansson, H. Burden of high fracture probability worldwide: Secular increases 2010–2040. Osteoporos. Int. 2015, 26, 2243–2248. [Google Scholar] [CrossRef]
- Åkesson, K.; Marsh, D.; Mitchell, P.J.; McLellan, A.R.; Stenmark, J.; Pierroz, D.D.; Kyer, C.; Cooper, C.; IOF Fracture Working Group. Capture the Fracture: A Best Practice Framework and global campaign to break the fragility fracture cycle. Osteoporos. Int. 2013, 24, 2135–2152. [Google Scholar] [CrossRef]
- Pisani, P.; Renna, M.D.; Conversano, F.; Casciaro, E.; Di Paola, M.; Quarta, E.; Muratore, M.; Casciaro, S. Major osteoporotic fragility fractures: Risk factor updates and societal impact. World J. Orthop. 2016, 7, 171–181. [Google Scholar] [CrossRef]
- Kanis, J.A.; Norton, N.; Harvey, N.C.; Jacobson, T.; Johansson, H.; Lorentzon, M.; McCloskey, E.V.; Willers, C.; Borgström, F. SCOPE 2021: A new scorecard for osteoporosis in Europe. Arch. Osteoporos. 2021, 16, 82. [Google Scholar] [CrossRef] [PubMed]
- Kanis, J.A. Diagnosis of osteoporosis and assessment of fracture risk. Lancet 2002, 359, 1929–1936. [Google Scholar] [CrossRef]
- Hatzigeorgiou, C.; Jackson, J.L. Hydroxymethylglutaryl-coenzyme A reductase inhibitors and osteoporosis: A meta-analysis. Osteoporos. Int. 2005, 16, 990–998. [Google Scholar] [CrossRef]
- An, T.; Hao, J.; Sun, S.; Li, R.; Yang, M.; Cheng, G.; Zou, M. Efficacy of statins for osteoporosis: A systematic review and meta-analysis. Osteoporos. Int. 2017, 28, 47–57. [Google Scholar] [CrossRef]
- Uzzan, B.; Cohen, R.; Nicolas, P.; Cucherat, M.; Perret, G.Y. Effects of statins on bone mineral density: A meta-analysis of clinical studies. Bone 2007, 40, 1581–1587. [Google Scholar] [CrossRef] [PubMed]
- Bagger, Y.Z.; Rasmussen, H.B.; Alexandersen, P.; Werge, T.; Christiansen, C.; Tankó, L.B. Links between cardiovascular disease and osteoporosis in postmenopausal women: Serum lipids or atherosclerosis per se? Osteoporos. Int. 2007, 18, 505–512. [Google Scholar] [CrossRef] [PubMed]
- Ackert-Bicknell, C.L. HDL-C cholesterol and bone mineral density: Is there a genetic link? Bone 2012, 50, 525–533. [Google Scholar] [CrossRef]
- Makovey, J.; Chen, J.S.; Hayward, C.; Williams, F.M.; Sambrook, P.N. Association between serum cholesterol and bone mineral density. Bone 2009, 44, 208–213. [Google Scholar] [CrossRef]
- Chen, G.D.; Ding, D.; Tian, H.Y.; Zhu, Y.Y.; Cao, W.T.; Wang, C.; Chen, Y.M. Adherence to the 2006 American Heart Association’s Diet and Lifestyle Recommendations for cardiovascular disease risk reduction is associated with bone mineral density in older Chinese. Osteoporos. Int. 2017, 28, 1295–1303. [Google Scholar] [CrossRef] [PubMed]
- Veronese, N.; Stubbs, B.; Crepaldi, G.; Solmi, M.; Cooper, C.; Harvey, N.C.; Reginster, J.Y.; Rizzoli, R.; Civitelli, R.; Schofield, P.; et al. Relationship Between Low Bone Mineral Density and Fractures With Incident Cardiovascular Disease: A Systematic Review and Meta-Analysis. J. Bone Miner. Res. 2017, 32, 1126–1135. [Google Scholar] [CrossRef]
- Fohtung, R.B.; Brown, D.L.; Koh, W.J.; Bartz, T.M.; Carbone, L.D.; Civitelli, R.; Stein, P.K.; Chaves, P.H.; Kestenbaum, B.R.; Kizer, J.R. Bone Mineral Density and Risk of Heart Failure in Older Adults: The Cardiovascular Health Study. J. Am. Heart Assoc. 2017, 6, e004344. [Google Scholar] [CrossRef]
- Szulc, P.; Varennes, A.; Delmas, P.D.; Goudable, J.; Chapurlat, R. Men with metabolic syndrome have lower bone mineral density but lower fracture risk--the MINOS study. J. Bone Miner. Res. 2010, 25, 1446–1454. [Google Scholar] [CrossRef]
- Hussain, S.M.; Ebeling, P.R.; Barker, A.L.; Beilin, L.J.; Tonkin, A.M.; McNeil, J.J. Association of Plasma High-Density Lipoprotein Cholesterol Level With Risk of Fractures in Healthy Older Adults. JAMA Cardiol. 2023, 8, 268–272. [Google Scholar] [CrossRef] [PubMed]
- Wang, Y.; Dai, J.; Zhong, W.; Hu, C.; Lu, S.; Chai, Y. Association between Serum Cholesterol Level and Fragility fractures. Front. Endocrinol. 2018, 9, 30. [Google Scholar] [CrossRef]
- Zolfaroli, I.; Ortiz, E.; García-Pérez, M.; Hidalgo-Mora, J.J.; Tarín, J.J.; Cano, A. Positive association of high-density lipoprotein cholesterol with lumbar and femoral neck bone mineral density in postmenopausal women. Maturitas 2021, 147, 41–46. [Google Scholar] [CrossRef] [PubMed]
- Xie, R.; Huang, X.; Liu, Q.; Liu, M. Positive association between high-density lipoprotein cholesterol and bone mineral density in U.S. adults: The NHANES 2011–2018. J. Orthop. Surg. Res. 2022, 17, 92. [Google Scholar] [CrossRef]
- Poli, A.; Bruschi, F.; Cesana, B.; Rossi, M.; Paoletti, R.; Crosignani, P.G. Plasma low-density lipoprotein cholesterol and bone mass densitometry in postmenopausal women. Obstet. Gynecol. 2003, 102, 922–926. [Google Scholar]
- Zhao, H.; Li, Y.; Zhang, M.; Qi, L.; Tang, Y. Blood lipid levels in patients with osteopenia and osteoporosis:a systematic review and meta-analysis. J. Bone Miner. Metab. 2021, 39, 510–520. [Google Scholar] [CrossRef]
- Kan, B.; Zhao, Q.; Wang, L.; Xue, S.; Cai, H.; Yang, S. Association between lipid biomarkers and osteoporosis: A cross-sectional study. BMC Musculoskelet. Disord. 2021, 22, 759. [Google Scholar] [CrossRef]
- Yang, J.; Tang, Q.; Che, M.; Shi, J.; Yang, L.; Zeng, Y. Effect of bedside health education for elderly patients with fragility fracture by specialist physicians on the diagnosis and treatment of osteoporosis during hospitalization and the visiting rate to osteoporosis clinic after discharge in a high-volume orthopedic hospital. Arch. Osteoporos. 2023, 18, 133. [Google Scholar] [CrossRef] [PubMed]
- Li, Q.; Yang, J.; Tang, Q.; Feng, Y.; Pan, M.; Che, M.; Shi, J.; Zeng, Y. Age-dependent gender differences in the diagnosis and treatment of osteoporosis during hospitalization in patients with fragility fractures. BMC Geriatr. 2023, 23, 728. [Google Scholar] [CrossRef] [PubMed]
- Li, J.J.; Zhao, S.P.; Zhao, D.; Lu, G.P.; Peng, D.Q.; Liu, J.; Chen, Z.Y.; Guo, Y.L.; Wu, N.Q.; Yan, S.K.; et al. 2023 Chinese guideline for lipid management. Front. Pharmacol. 2023, 14, 1190934. [Google Scholar] [CrossRef]
- Ferrara, A.; Barrett-Connor, E.; Shan, J. Total, LDL-C, and HDL-C cholesterol decrease with age in older men and women. The Rancho Bernardo Study 1984–1994. Circulation 1997, 96, 37–43. [Google Scholar] [CrossRef]
- Saher, G. Cholesterol Metabolism in Aging and Age-Related Disorders. Annu. Rev. Neurosci. 2023, 46, 59–78. [Google Scholar] [CrossRef]
- Abbott, R.D.; Garrison, R.J.; Wilson, P.W.; Epstein, F.H.; Castelli, W.P.; Feinleib, M.; LaRue, C. Joint distribution of lipoprotein cholesterol classes. The Framingham study. Arteriosclerosis 1983, 3, 260–272. [Google Scholar] [CrossRef]
- Matthews, K.A.; Meilahn, E.; Kuller, L.H.; Kelsey, S.F.; Caggiula, A.W.; Wing, R.R. Menopause and risk factors for coronary heart disease. N. Engl. J. Med. 1989, 321, 641–646. [Google Scholar] [CrossRef]
- Klop, B.; Elte, J.W.; Cabezas, M.C. Dyslipidemia in obesity: Mechanisms and potential targets. Nutrients 2013, 5, 1218–1240. [Google Scholar] [CrossRef] [PubMed]
- Arai, T.; Yamashita, S.; Hirano, K.; Sakai, N.; Kotani, K.; Fujioka, S.; Nozaki, S.; Keno, Y.; Yamane, M.; Shinohara, E.; et al. Increased plasma cholesteryl ester transfer protein in obese subjects. A possible mechanism for the reduction of serum HDL-C cholesterol levels in obesity. Arterioscler. Thromb. 1994, 14, 1129–1136. [Google Scholar] [CrossRef]
- Rashid, S.; Genest, J. Effect of obesity on high-density lipoprotein metabolism. Obesity 2007, 15, 2875–2888. [Google Scholar] [CrossRef]
- Stadler, J.T.; Lackner, S.; Mörkl, S.; Trakaki, A.; Scharnagl, H.; Borenich, A.; Wonisch, W.; Mangge, H.; Zelzer, S.; Meier-Allard, N.; et al. Obesity Affects HDL-C Metabolism, Composition and Subclass Distribution. Biomedicines 2021, 9, 242. [Google Scholar] [CrossRef] [PubMed]
- Volpato, S.; Palmieri, E.; Fellin, R.; Zuliani, G. Acute phase markers are associated with reduced plasma lipid levels in a population of hospitalized elderly patients. Gerontology 2000, 46, 22–27. [Google Scholar] [CrossRef] [PubMed]
- Grundy, S.M.; Stone, N.J.; Bailey, A.L.; Beam, C.; Birtcher, K.K.; Blumenthal, R.S.; Braun, L.T.; de Ferranti, S.; Faiella-Tommasino, J.; Forman, D.E.; et al. 2018 AHA/ACC/AACVPR/AAPA/ABC/ACPM/ADA/AGS/APhA/ASPC/NLA/PCNA Guideline on the Management of Blood Cholesterol: Executive Summary: A Report of the American College of Cardiology/American Heart Association Task Force on Clinical Practice Guidelines. Circulation 2019, 139, e1046–e1081. [Google Scholar]
- Zhang, J.; Hu, W.; Zou, Z.; Li, Y.; Kang, F.; Li, J.; Dong, S. The role of lipid metabolism in osteoporosis: Clinical implication and cellular mechanism. Genes. Dis. 2024, 11, 101122. [Google Scholar] [CrossRef]
- Tian, L.; Yu, X. Lipid metabolism disorders and bone dysfunction--interrelated and mutually regulated (review). Mol. Med. Rep. 2015, 12, 783–794. [Google Scholar] [CrossRef]
- Winckel, T.; Friedrich, N.; Zylla, S.; Fenzlaff, M.; Schöpfel, J.; Gauß, K.F.; Petersmann, A.; Nauck, M.; Völzke, H.; Hannemann, A. Bone turnover: The role of lipoproteins in a population-based study. Lipids Health Dis. 2024, 23, 302. [Google Scholar] [CrossRef] [PubMed]
- Tang, Y.; Wang, S.; Yi, Q.; Xia, Y.; Geng, B. High-density Lipoprotein Cholesterol Is Negatively Correlated with Bone Mineral Density and Has Potential Predictive Value for Bone Loss. Lipids Health Dis. 2021, 20, 75. [Google Scholar] [CrossRef]
- Xie, R.; Huang, X.; Zhang, Y.; Liu, Q.; Liu, M. High Low-Density Lipoprotein Cholesterol Levels are Associated with Osteoporosis Among Adults 20-59 Years of Age. Int. J. Gen. Med. 2022, 15, 2261–2270. [Google Scholar] [CrossRef]
- Wang, J.; Li, S.; Pu, H.; He, J. The association between the non-high-density lipoprotein cholesterol to high-density lipoprotein cholesterol ratio and the risk of osteoporosis among U.S. adults: Analysis of NHANES data. Lipids Health Dis. 2024, 23, 161. [Google Scholar] [CrossRef] [PubMed]
- Fan, L.; Chen, J.; Chen, C.; Zhang, Y.; Yang, Y.; Chen, Z. The diagnostic value of the combined application of blood lipid metabolism markers and interleukin-6 in osteoporosis and osteopenia. Lipids Health Dis. 2025, 24, 38. [Google Scholar] [CrossRef] [PubMed]
- Ye, H.; Chen, Z.; Li, K.; Zhang, Y.; Li, H.; Tian, N. Non-linear association of the platelet/high-density lipoprotein cholesterol ratio with bone mineral density a cross-sectional study. Lipids Health Dis. 2024, 23, 300. [Google Scholar] [CrossRef] [PubMed]
Disclaimer/Publisher’s Note: The statements, opinions and data contained in all publications are solely those of the individual author(s) and contributor(s) and not of MDPI and/or the editor(s). MDPI and/or the editor(s) disclaim responsibility for any injury to people or property resulting from any ideas, methods, instructions or products referred to in the content. |
© 2025 by the authors. Licensee MDPI, Basel, Switzerland. This article is an open access article distributed under the terms and conditions of the Creative Commons Attribution (CC BY) license (https://creativecommons.org/licenses/by/4.0/).