Sex Differences in Seasonal Variation in Metabolic Syndrome and Its Components: A 10-Year National Health Screening Study
Abstract
1. Introduction
2. Materials and Methods
2.1. Study Design and Patient Population
2.2. Data Collection
2.3. Definition and Metabolic Syndrome
2.4. Statistical Analysis
3. Results
3.1. Baseline Characteristics
3.2. Seasonal and Monthly Trends in Metabolic Syndrome Prevalence by Sex
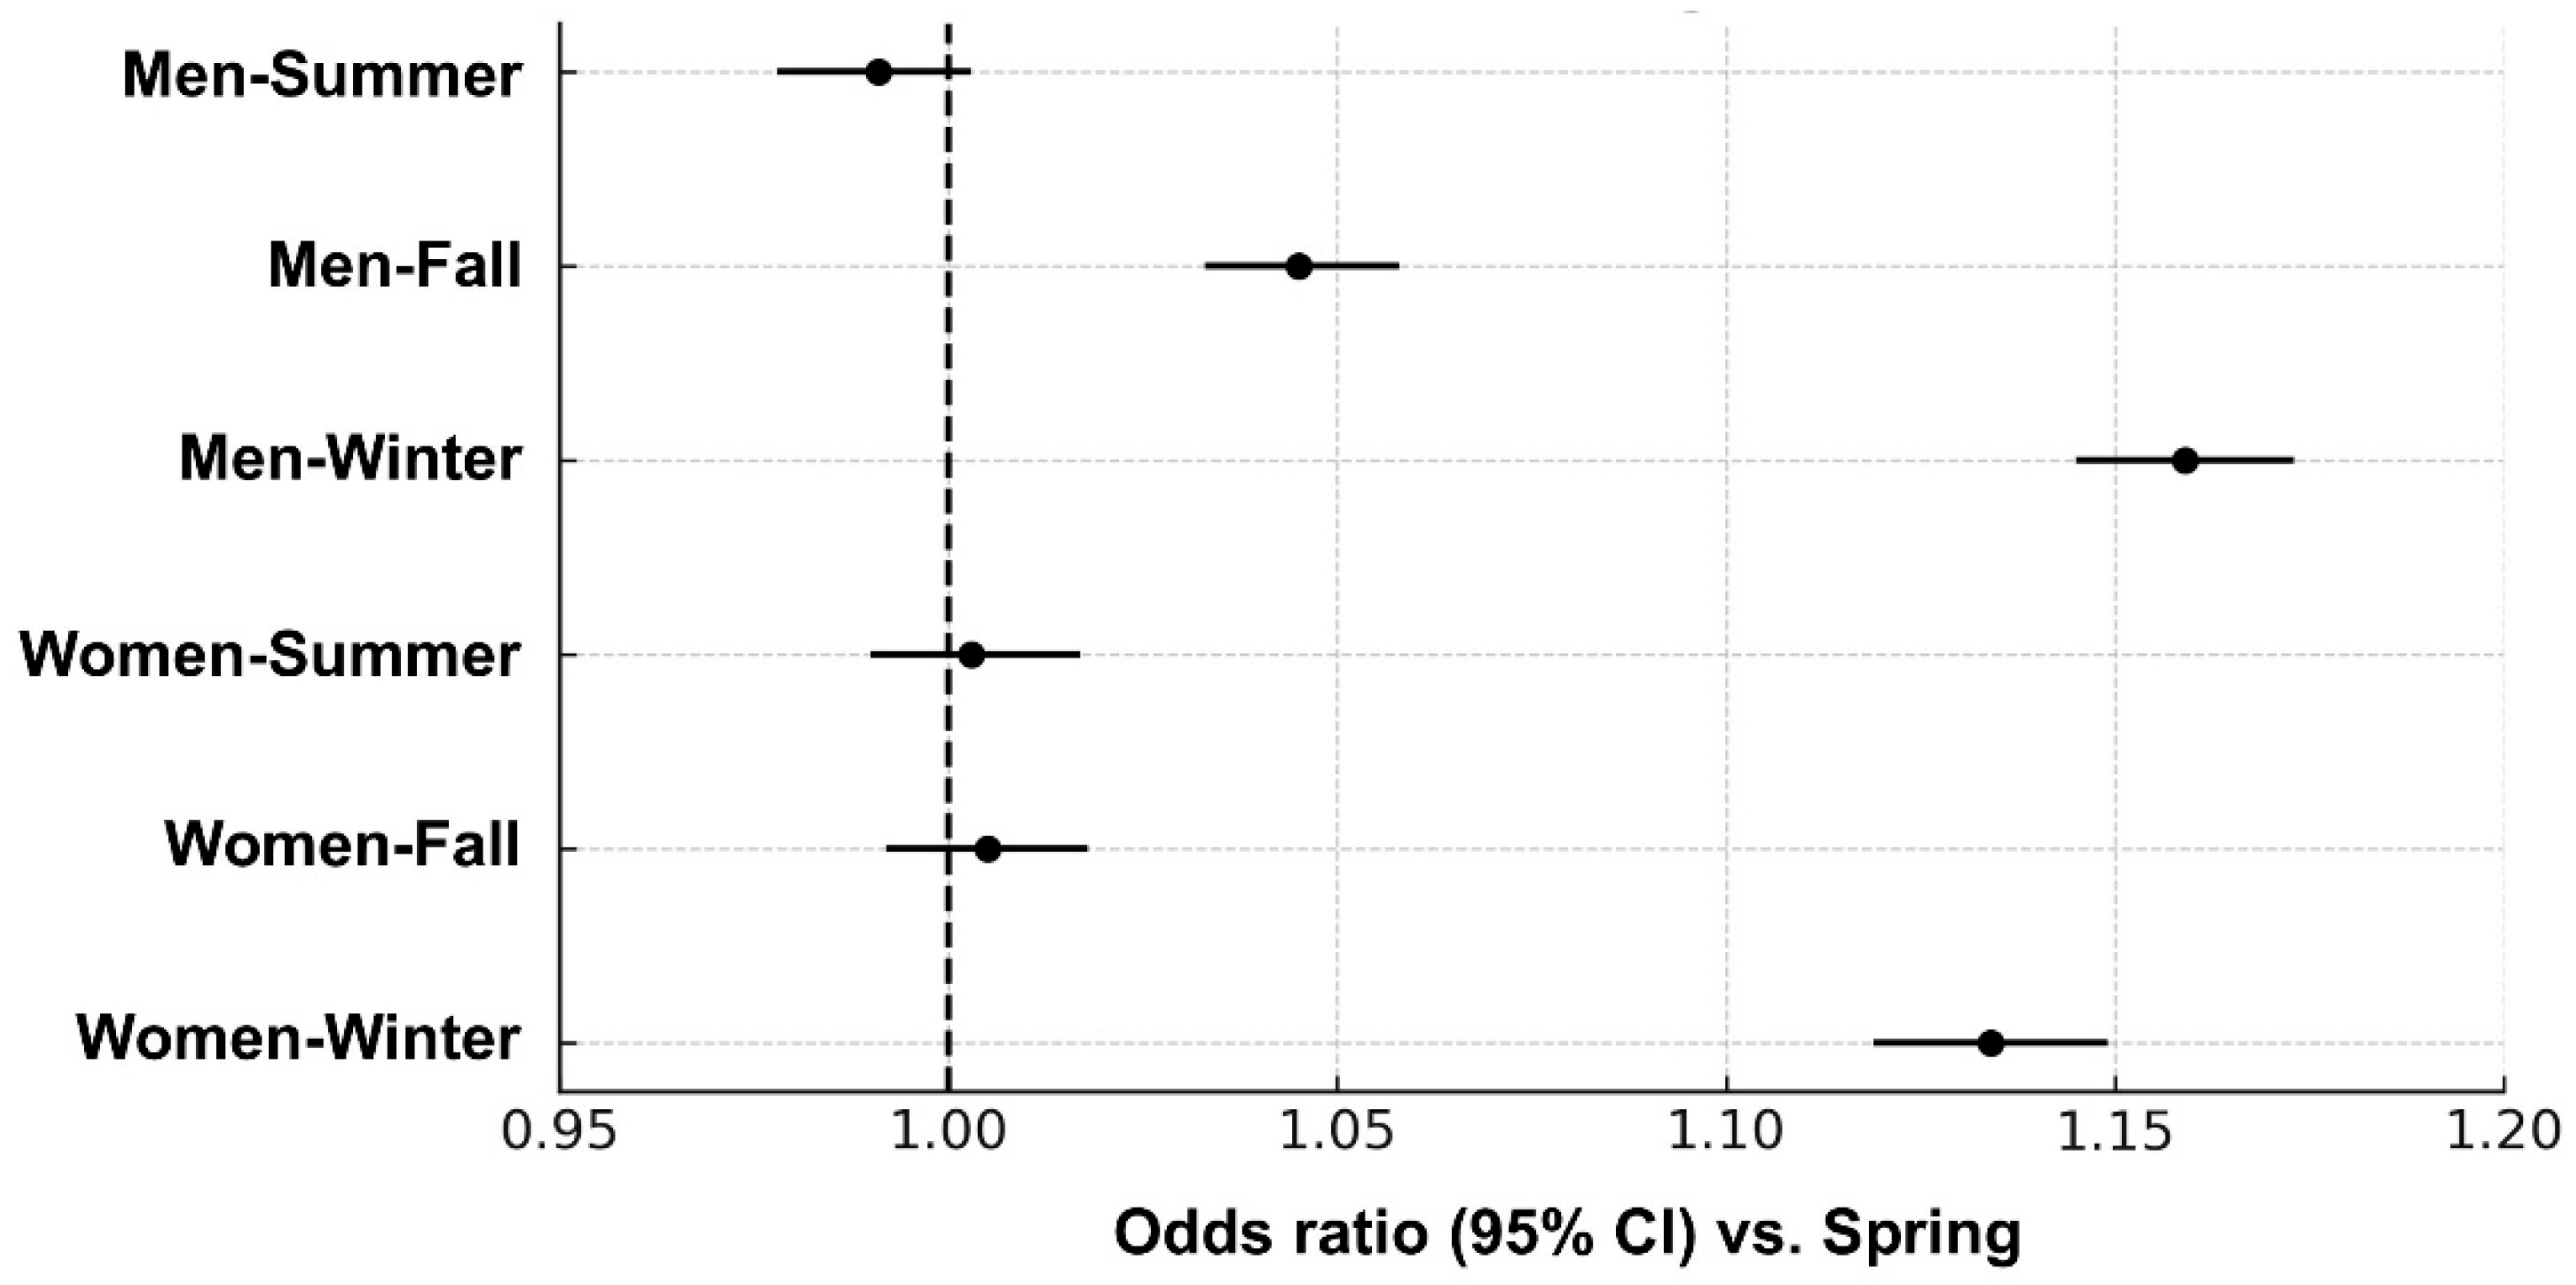
3.3. Adjusted Seasonal Association with Metabolic Syndrome by Sex
4. Discussion
5. Conclusions
Supplementary Materials
Author Contributions
Funding
Institutional Review Board Statement
Informed Consent Statement
Data Availability Statement
Conflicts of Interest
Abbreviations
| MetS | Metabolic syndrome |
| BP | Blood pressure |
| NHIS | National Health Insurance Service |
| BMI | Body mass index |
| TG | Triglyceride |
| HDL-C | High-density lipoprotein cholesterol |
| OR | Odds ratio |
| 95% CI | 95% confidence interval |
| eGFR | Estimated glomerular filtration rate |
References
- Alberti, K.G.; Eckel, R.H.; Grundy, S.M.; Zimmet, P.Z.; Cleeman, J.I.; Donato, K.A.; Fruchart, J.C.; James, W.P.; Loria, C.M.; Smith, S.C., Jr.; et al. Harmonizing the metabolic syndrome: A joint interim statement of the International Diabetes Federation Task Force on Epidemiology and Prevention; National Heart, Lung, and Blood Institute; American Heart Association; World Heart Federation; International Atherosclerosis Society; and International Association for the Study of Obesity. Circulation 2009, 120, 1640–1645. [Google Scholar] [CrossRef]
- Saklayen, M.G. The Global Epidemic of the Metabolic Syndrome. Curr. Hypertens. Rep. 2018, 20, 12. [Google Scholar] [CrossRef] [PubMed]
- Modesti, P.A.; Morabito, M.; Massetti, L.; Rapi, S.; Orlandini, S.; Mancia, G.; Gensini, G.F.; Parati, G. Seasonal blood pressure changes: An independent relationship with temperature and daylight hours. Hypertension 2013, 61, 908–914. [Google Scholar] [CrossRef]
- Shahar, D.R.; Yerushalmi, N.; Lubin, F.; Froom, P.; Shahar, A.; Kristal-Boneh, E. Seasonal variations in dietary intake affect the consistency of dietary assessment. Eur. J. Epidemiol. 2001, 17, 129–133. [Google Scholar] [CrossRef]
- Ma, X.; Yan, H.; Zhang, H.; Wang, M.; Zhang, Q.; Zhou, X. Progress in the seasonal variations of blood lipids: A mini-review. Lipids Health Dis. 2020, 19, 108. [Google Scholar] [CrossRef]
- Kamezaki, F.; Sonoda, S.; Tomotsune, Y.; Yunaka, H.; Otsuji, Y. Seasonal variation in serum lipid levels in Japanese workers. J. Atheroscler. Thromb. 2010, 17, 638–643. [Google Scholar] [CrossRef]
- Ockene, I.S.; Chiriboga, D.E.; Stanek, E.J., 3rd; Harmatz, M.G.; Nicolosi, R.; Saperia, G.; Well, A.D.; Freedson, P.; Merriam, P.A.; Reed, G.; et al. Seasonal variation in serum cholesterol levels: Treatment implications and possible mechanisms. Arch. Intern. Med. 2004, 164, 863–870. [Google Scholar] [CrossRef]
- Westerterp, K.R. Seasonal variation in body mass, body composition and activity-induced energy expenditure: A long-term study. Eur. J. Clin. Nutr. 2020, 74, 135–140. [Google Scholar] [CrossRef] [PubMed]
- Holick, M.F. Vitamin D deficiency. N. Engl. J. Med. 2007, 357, 266–281. [Google Scholar] [CrossRef] [PubMed]
- Shephard, R.J.; Aoyagi, Y. Seasonal variations in physical activity and implications for human health. Eur. J. Appl. Physiol. 2009, 107, 251–271. [Google Scholar] [CrossRef]
- Regitz-Zagrosek, V. Sex and gender differences in health. Science & Society Series on Sex and Science. EMBO Rep. 2012, 13, 596–603. [Google Scholar] [CrossRef]
- Peters, S.A.E.; Woodward, M. Sex Differences in the Burden and Complications of Diabetes. Curr. Diab. Rep. 2018, 18, 33. [Google Scholar] [CrossRef]
- Mauvais-Jarvis, F. Gender differences in glucose homeostasis and diabetes. Physiol. Behav. 2018, 187, 20–23. [Google Scholar] [CrossRef]
- Jeong, S.M.; Jung, J.H.; Yang, Y.S.; Kim, W.; Cho, I.Y.; Lee, Y.B.; Park, K.Y.; Nam, G.E.; Han, K.; Taskforce Team of the Obesity Fact Sheet of the Korean Society for the Study of Obesity. 2023 Obesity Fact Sheet: Prevalence of Obesity and Abdominal Obesity in Adults, Adolescents, and Children in Korea from 2012 to 2021. J. Obes. Metab. Syndr. 2024, 33, 27–35. [Google Scholar] [CrossRef]
- Park, S.; Jee, S.H.; Shin, H.R.; Park, E.H.; Shin, A.; Jung, K.W.; Hwang, S.S.; Cha, E.S.; Yun, Y.H.; Park, S.K.; et al. Attributable fraction of tobacco smoking on cancer using population-based nationwide cancer incidence and mortality data in Korea. BMC Cancer 2014, 14, 406. [Google Scholar] [CrossRef] [PubMed]
- Kim, H.J.; Kang, D.R.; Kim, J.Y.; Kim, W.; Jeong, Y.W.; Chun, K.H.; Han, S.H.; Koh, K.K. Metabolic Syndrome Fact Sheet 2024: Executive Report. Cardiometab. Synr J. 2024, 4, 70–80. [Google Scholar] [CrossRef]
- Bull, F.C.; Al-Ansari, S.S.; Biddle, S.; Borodulin, K.; Buman, M.P.; Cardon, G.; Carty, C.; Chaput, J.P.; Chastin, S.; Chou, R.; et al. World Health Organization 2020 guidelines on physical activity and sedentary behaviour. Br. J. Sports Med. 2020, 54, 1451–1462. [Google Scholar] [CrossRef] [PubMed]
- Levey, A.S.; Bosch, J.P.; Lewis, J.B.; Greene, T.; Rogers, N.; Roth, D. A more accurate method to estimate glomerular filtration rate from serum creatinine: A new prediction equation. Modification of Diet in Renal Disease Study Group. Ann. Intern. Med. 1999, 130, 461–470. [Google Scholar] [CrossRef]
- Kassi, E.; Pervanidou, P.; Kaltsas, G.; Chrousos, G. Metabolic syndrome: Definitions and controversies. BMC Med. 2011, 9, 48. [Google Scholar] [CrossRef]
- Fares, A. Winter Hypertension: Potential mechanisms. Int. J. Health Sci. 2013, 7, 210–219. [Google Scholar] [CrossRef]
- Sun, Z. Cardiovascular responses to cold exposure. Front. Biosci. 2010, 2, 495–503. [Google Scholar] [CrossRef]
- Fleury, N.; Geldenhuys, S.; Gorman, S. Sun Exposure and Its Effects on Human Health: Mechanisms through Which Sun Exposure Could Reduce the Risk of Developing Obesity and Cardiometabolic Dysfunction. Int. J. Environ. Res. Public Health 2016, 13, 999. [Google Scholar] [CrossRef]
- Stothard, E.R.; McHill, A.W.; Depner, C.M.; Birks, B.R.; Moehlman, T.M.; Ritchie, H.K.; Guzzetti, J.R.; Chinoy, E.D.; LeBourgeois, M.K.; Axelsson, J.; et al. Circadian Entrainment to the Natural Light-Dark Cycle across Seasons and the Weekend. Curr. Biol. 2017, 27, 508–513. [Google Scholar] [CrossRef]
- Yoshimura, E.; Tajiri, E.; Hatamoto, Y.; Tanaka, S. Changes in Season Affect Body Weight, Physical Activity, Food Intake, and Sleep in Female College Students: A Preliminary Study. Int. J. Environ. Res. Public Health 2020, 17, 8713. [Google Scholar] [CrossRef]
- Tanaka, N.; Okuda, T.; Shinohara, H.; Yamasaki, R.S.; Hirano, N.; Kang, J.; Ogawa, M.; Nishi, N.N. Relationship between Seasonal Changes in Food Intake and Energy Metabolism, Physical Activity, and Body Composition in Young Japanese Women. Nutrients 2022, 14, 506. [Google Scholar] [CrossRef] [PubMed]
- Ma, Y.; Olendzki, B.C.; Li, W.; Hafner, A.R.; Chiriboga, D.; Hebert, J.R.; Campbell, M.; Sarnie, M.; Ockene, I.S. Seasonal variation in food intake, physical activity, and body weight in a predominantly overweight population. Eur. J. Clin. Nutr. 2006, 60, 519–528. [Google Scholar] [CrossRef]
- Noordam, R.; Ramkisoensing, A.; Loh, N.Y.; Neville, M.J.; Rosendaal, F.R.; Willems van Dijk, K.; van Heemst, D.; Karpe, F.; Christodoulides, C.; Kooijman, S. Associations of Outdoor Temperature, Bright Sunlight, and Cardiometabolic Traits in Two European Population-Based Cohorts. J. Clin. Endocrinol. Metab. 2019, 104, 2903–2910. [Google Scholar] [CrossRef] [PubMed]
- Lindqvist, P.G.; Olsson, H.; Landin-Olsson, M. Are active sun exposure habits related to lowering risk of type 2 diabetes mellitus in women, a prospective cohort study? Diabetes Res. Clin. Pract. 2010, 90, 109–114. [Google Scholar] [CrossRef] [PubMed]
- Au-Yong, I.T.; Thorn, N.; Ganatra, R.; Perkins, A.C.; Symonds, M.E. Brown adipose tissue and seasonal variation in humans. Diabetes 2009, 58, 2583–2587. [Google Scholar] [CrossRef]
- Nirengi, S.; Sakane, N.; Amagasa, S.; Wakui, S.; Homma, T.; Kurosawa, Y.; Hamaoka, T. Seasonal differences in brown adipose tissue density and pulse rate variability in a thermoneutral environment. J. Physiol. Anthropol. 2018, 37, 6. [Google Scholar] [CrossRef]
- Mendelsohn, M.E.; Karas, R.H. The protective effects of estrogen on the cardiovascular system. N. Engl. J. Med. 1999, 340, 1801–1811. [Google Scholar] [CrossRef] [PubMed]
- Gupte, A.A.; Pownall, H.J.; Hamilton, D.J. Estrogen: An emerging regulator of insulin action and mitochondrial function. J. Diabetes Res. 2015, 2015, 916585. [Google Scholar] [CrossRef]
- Rosenfeld, C.S.; Trainor, B.C. Environmental Health Factors and Sexually Dimorphic Differences in Behavioral Disruptions. Curr. Environ. Health Rep. 2014, 1, 287–301. [Google Scholar] [CrossRef]
- Kamezaki, F.; Sonoda, S.; Tomotsune, Y.; Yunaka, H.; Otsuji, Y. Seasonal variation in metabolic syndrome prevalence. Hypertens. Res. 2010, 33, 568–572. [Google Scholar] [CrossRef]
- Marti-Soler, H.; Gonseth, S.; Gubelmann, C.; Stringhini, S.; Bovet, P.; Chen, P.C.; Wojtyniak, B.; Paccaud, F.; Tsai, D.H.; Zdrojewski, T.; et al. Seasonal variation of overall and cardiovascular mortality: A study in 19 countries from different geographic locations. PLoS ONE 2014, 9, e113500. [Google Scholar] [CrossRef]
- Yang, L.; Li, L.; Lewington, S.; Guo, Y.; Sherliker, P.; Bian, Z.; Collins, R.; Peto, R.; Liu, Y.; Yang, R.; et al. Outdoor temperature, blood pressure, and cardiovascular disease mortality among 23 000 individuals with diagnosed cardiovascular diseases from China. Eur. Heart J. 2015, 36, 1178–1185. [Google Scholar] [CrossRef]
- Kamezaki, F.; Sonoda, S.; Nakata, S.; Muraoka, Y.; Okazaki, M.; Tamura, M.; Abe, H.; Tekeuchi, M.; Otsuji, Y. Association of seasonal variation in the prevalence of metabolic syndrome with insulin resistance. Hypertens. Res. 2013, 36, 398–402. [Google Scholar] [CrossRef]
- Seto, H.; Toki, H.; Kitora, S.; Oyama, A.; Yamamoto, R. Seasonal variations of the prevalence of metabolic syndrome and its markers using big-data of health check-ups. Environ. Health Prev. Med. 2024, 29, 2. [Google Scholar] [CrossRef] [PubMed]

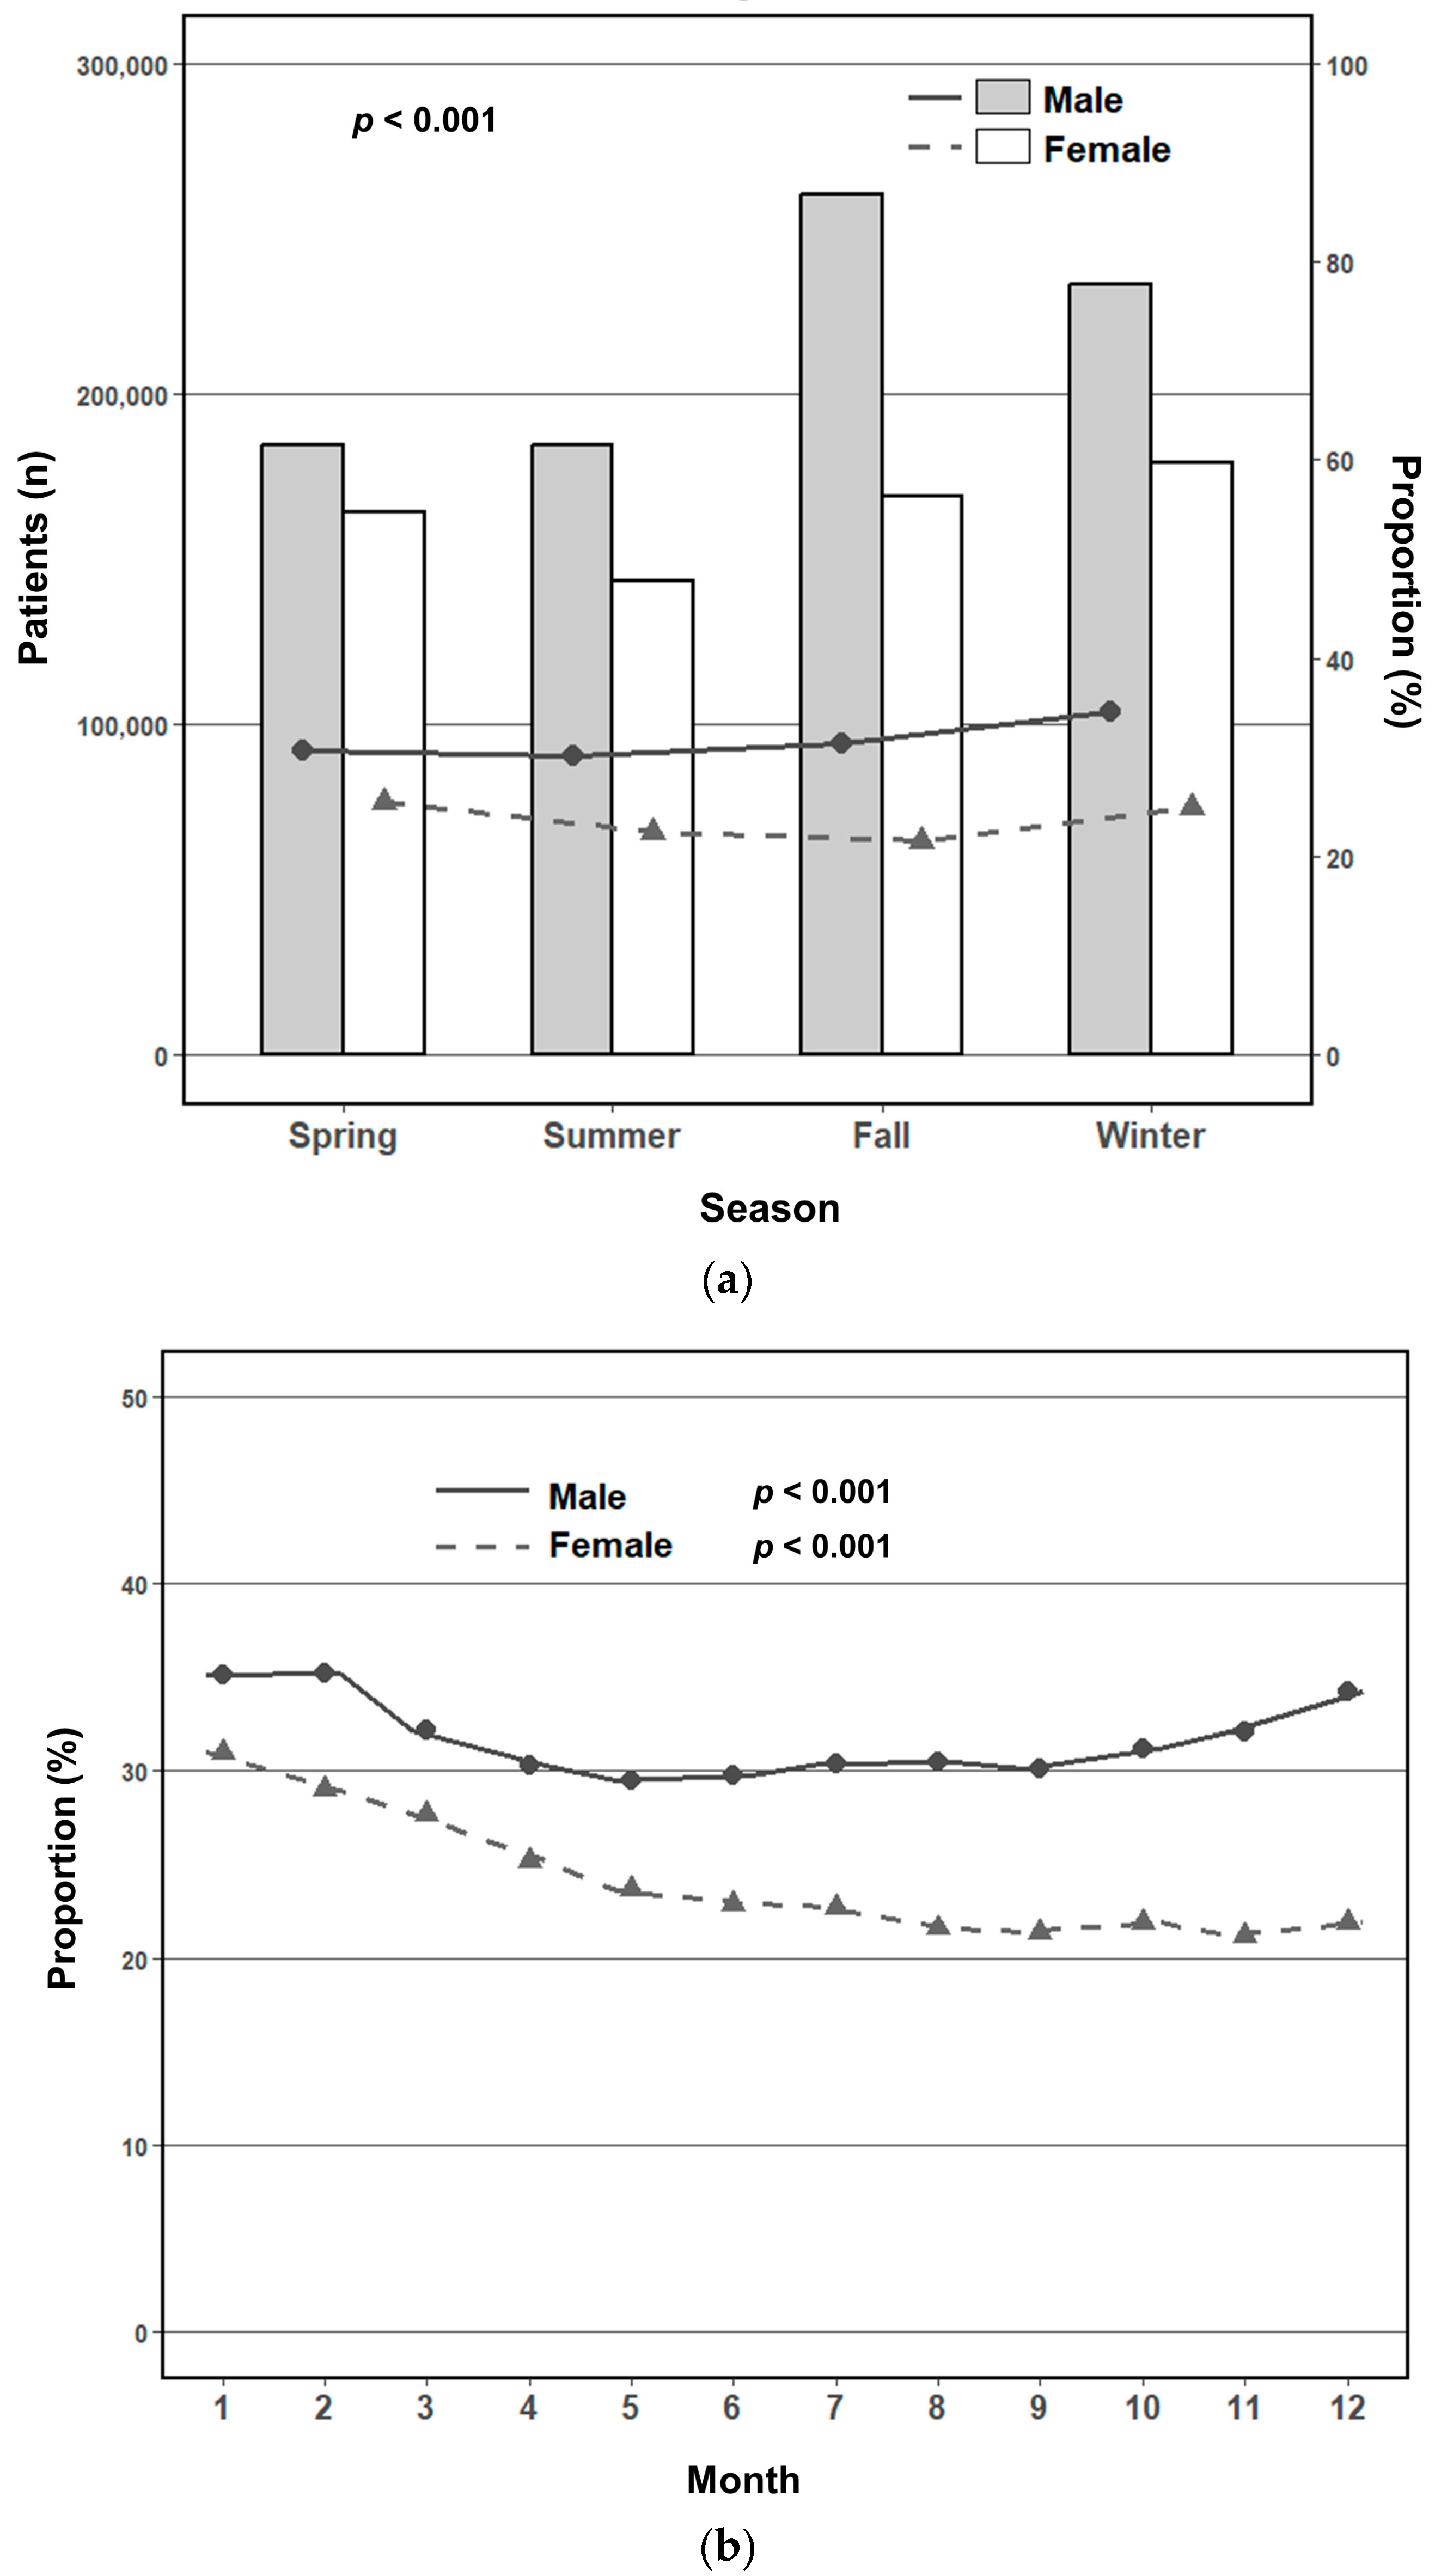
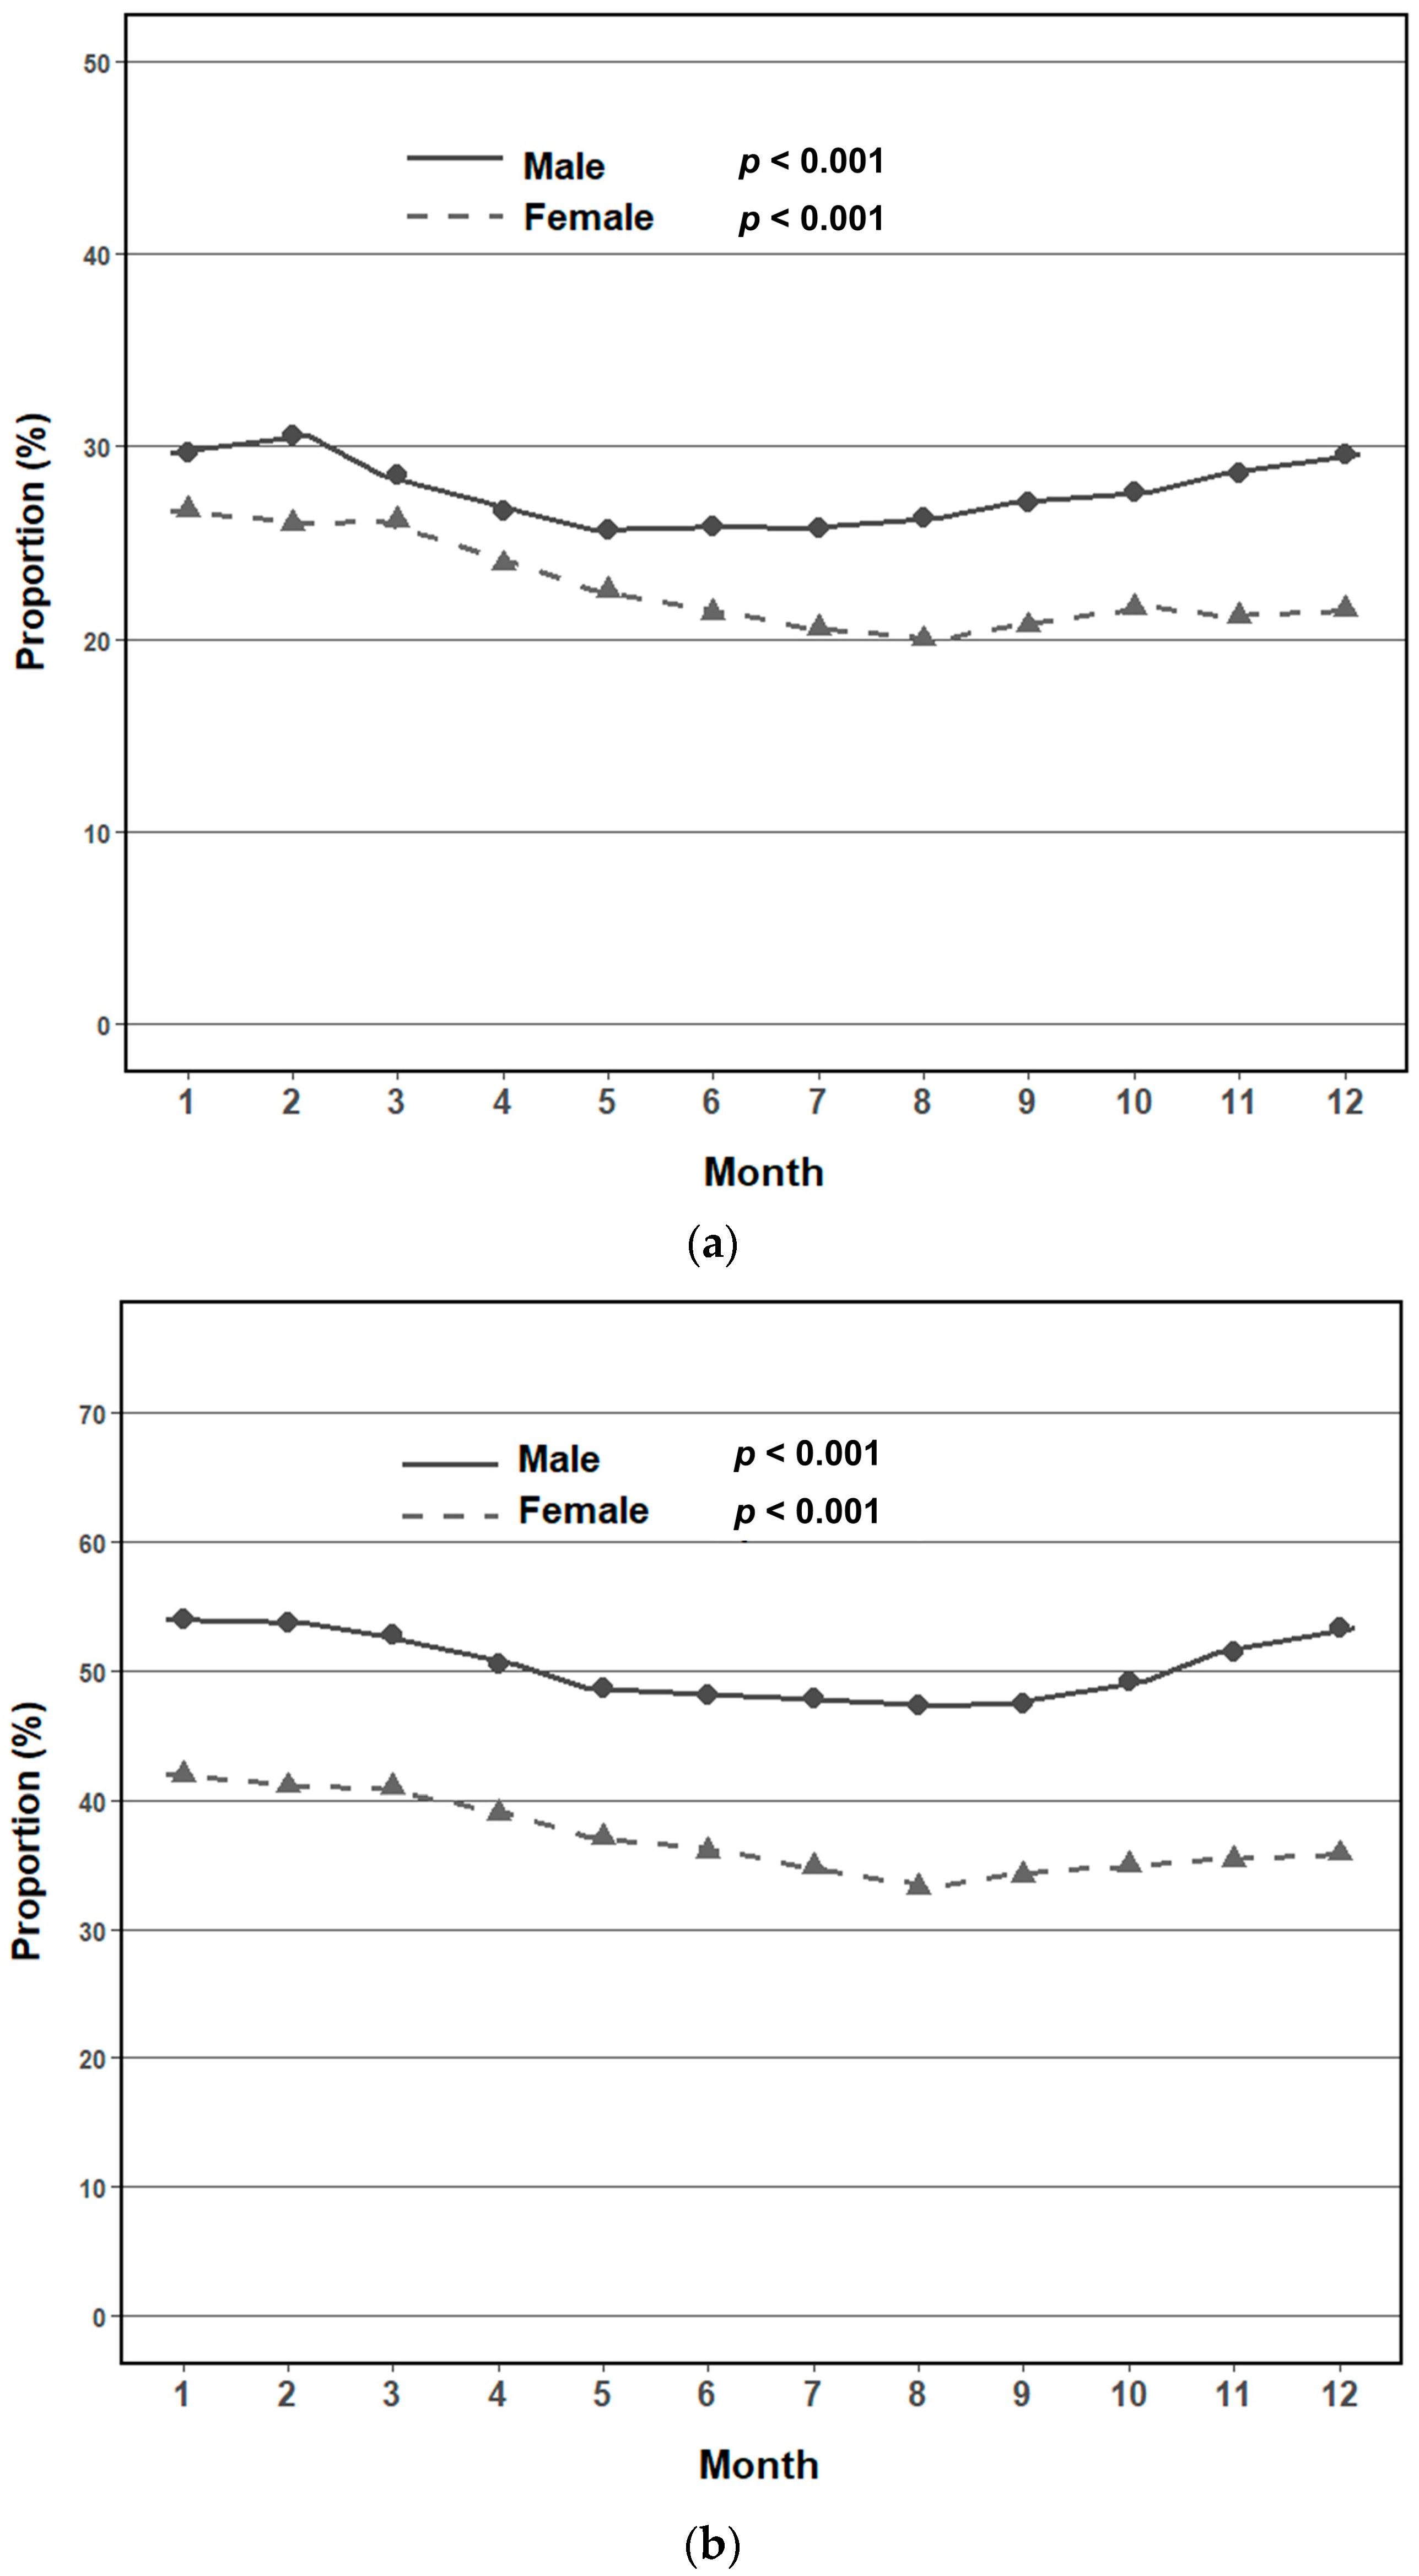
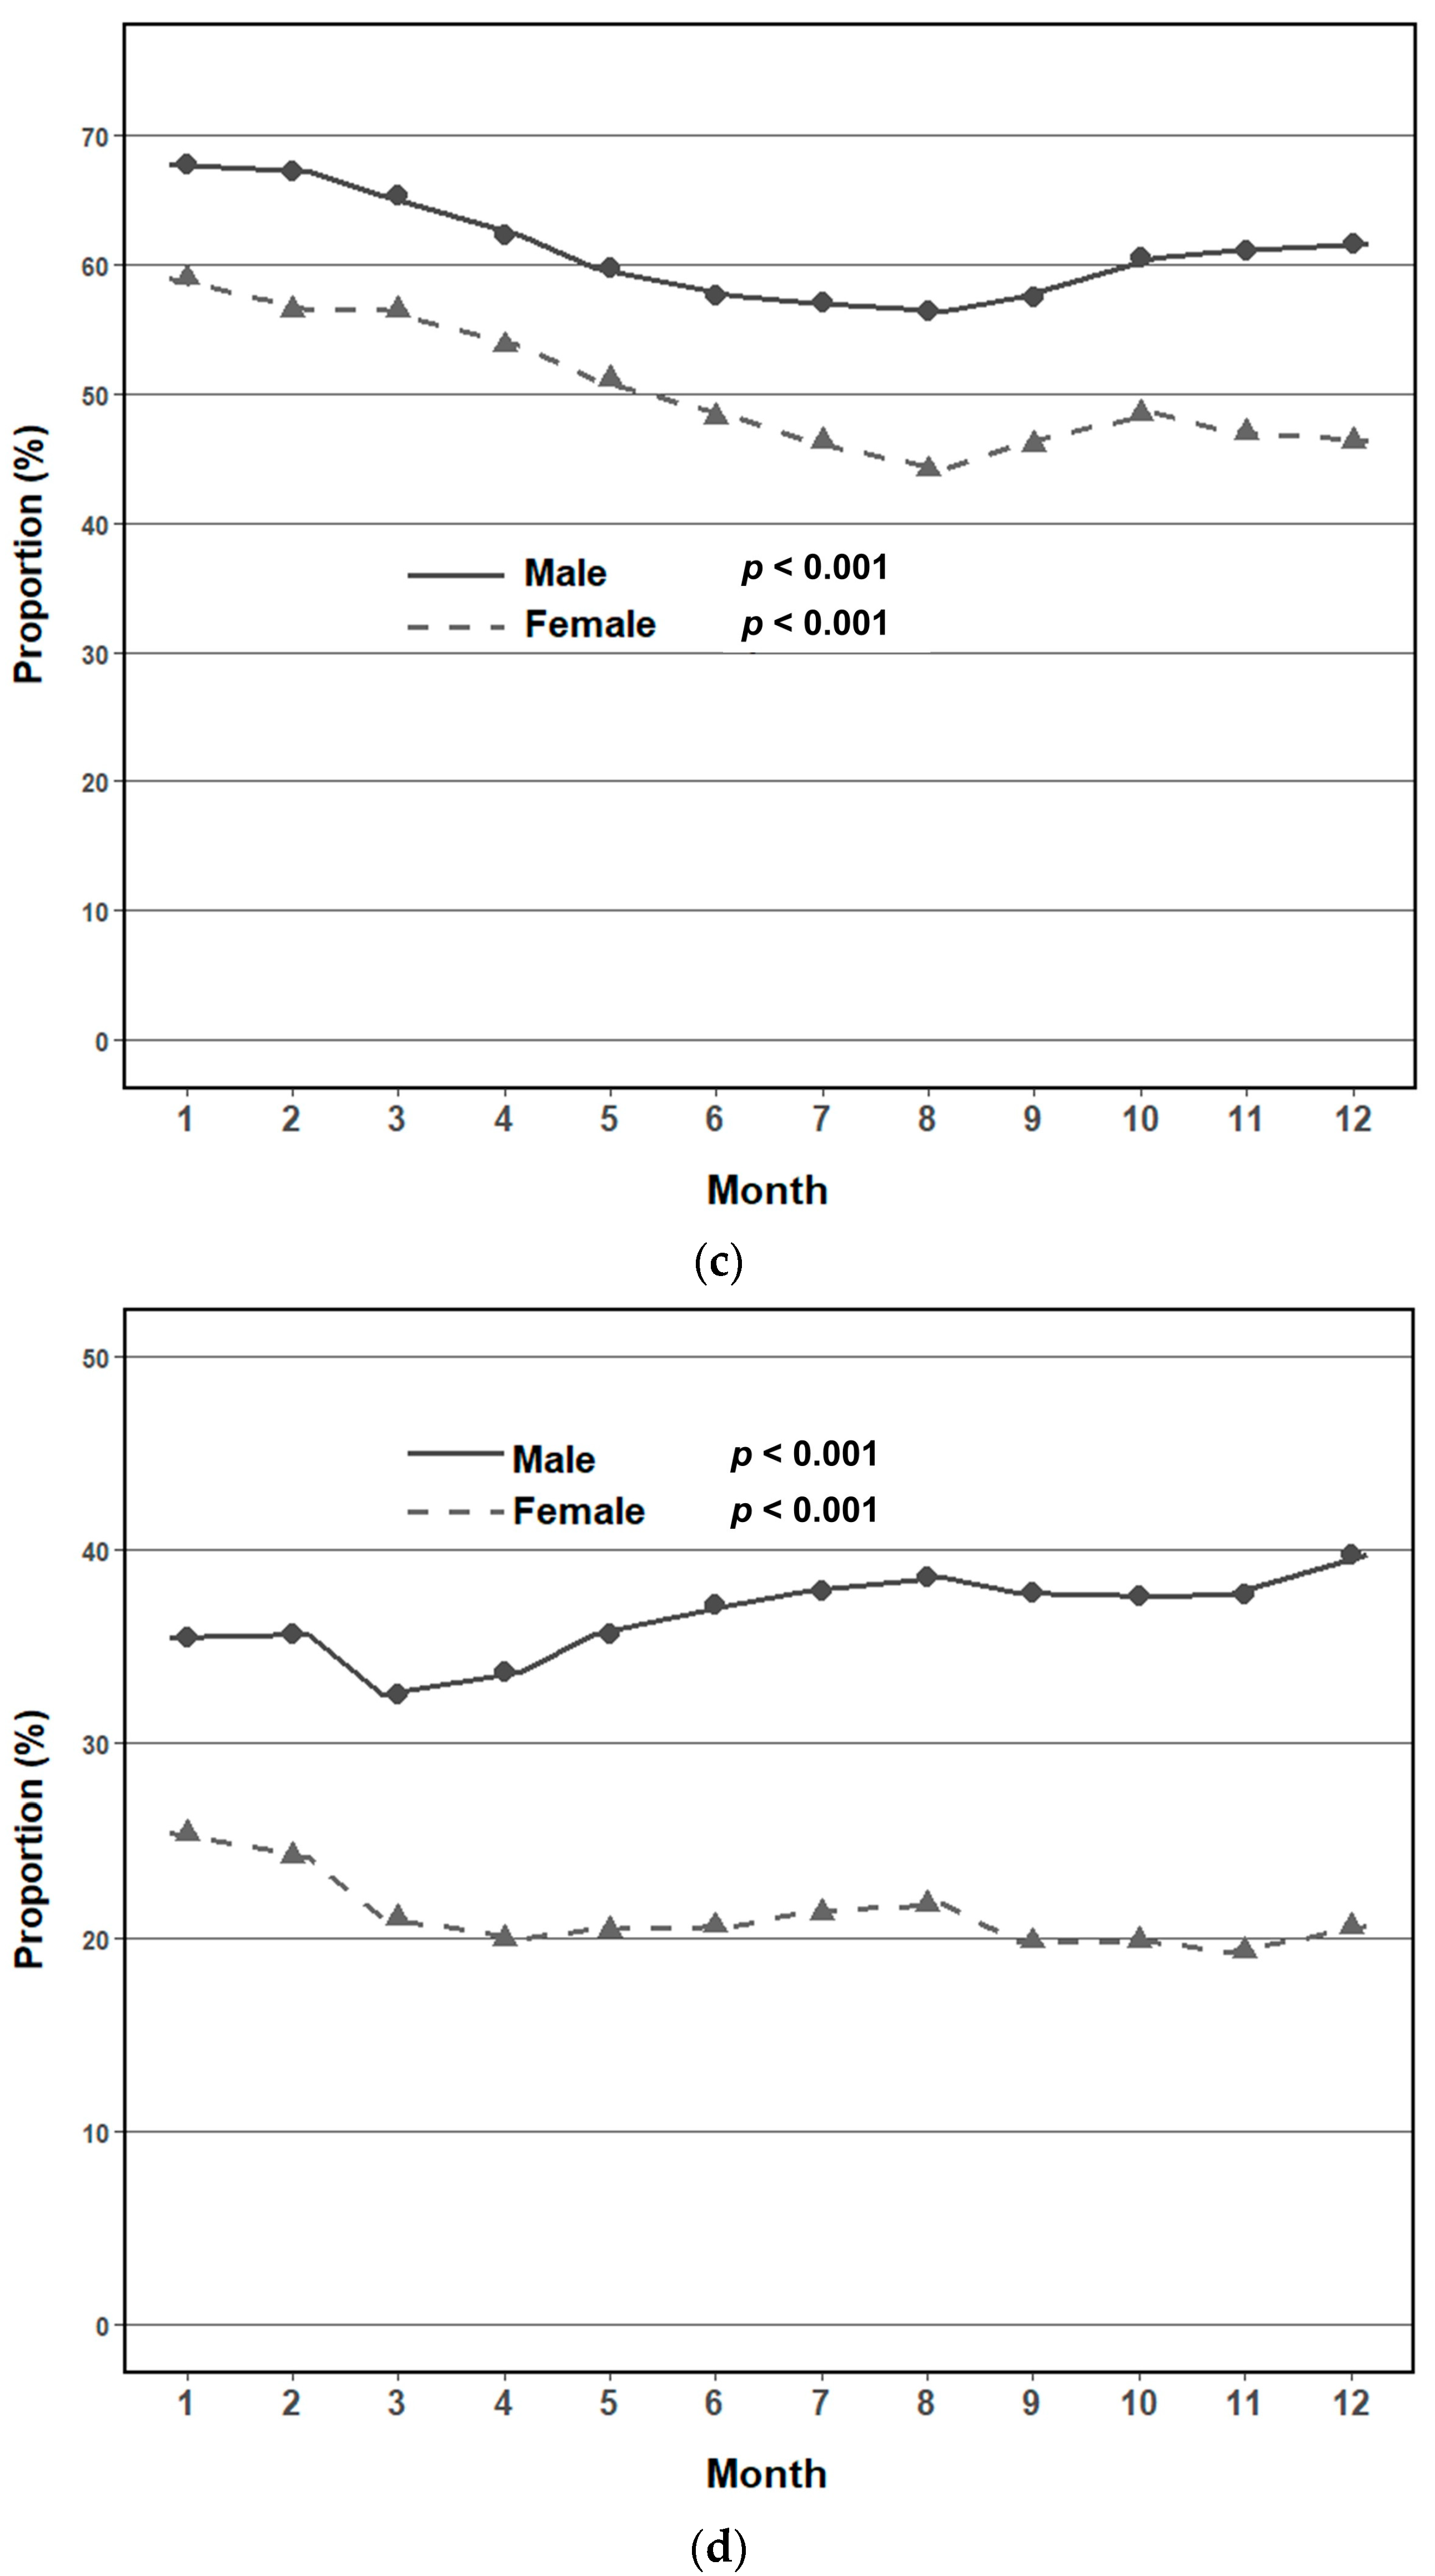
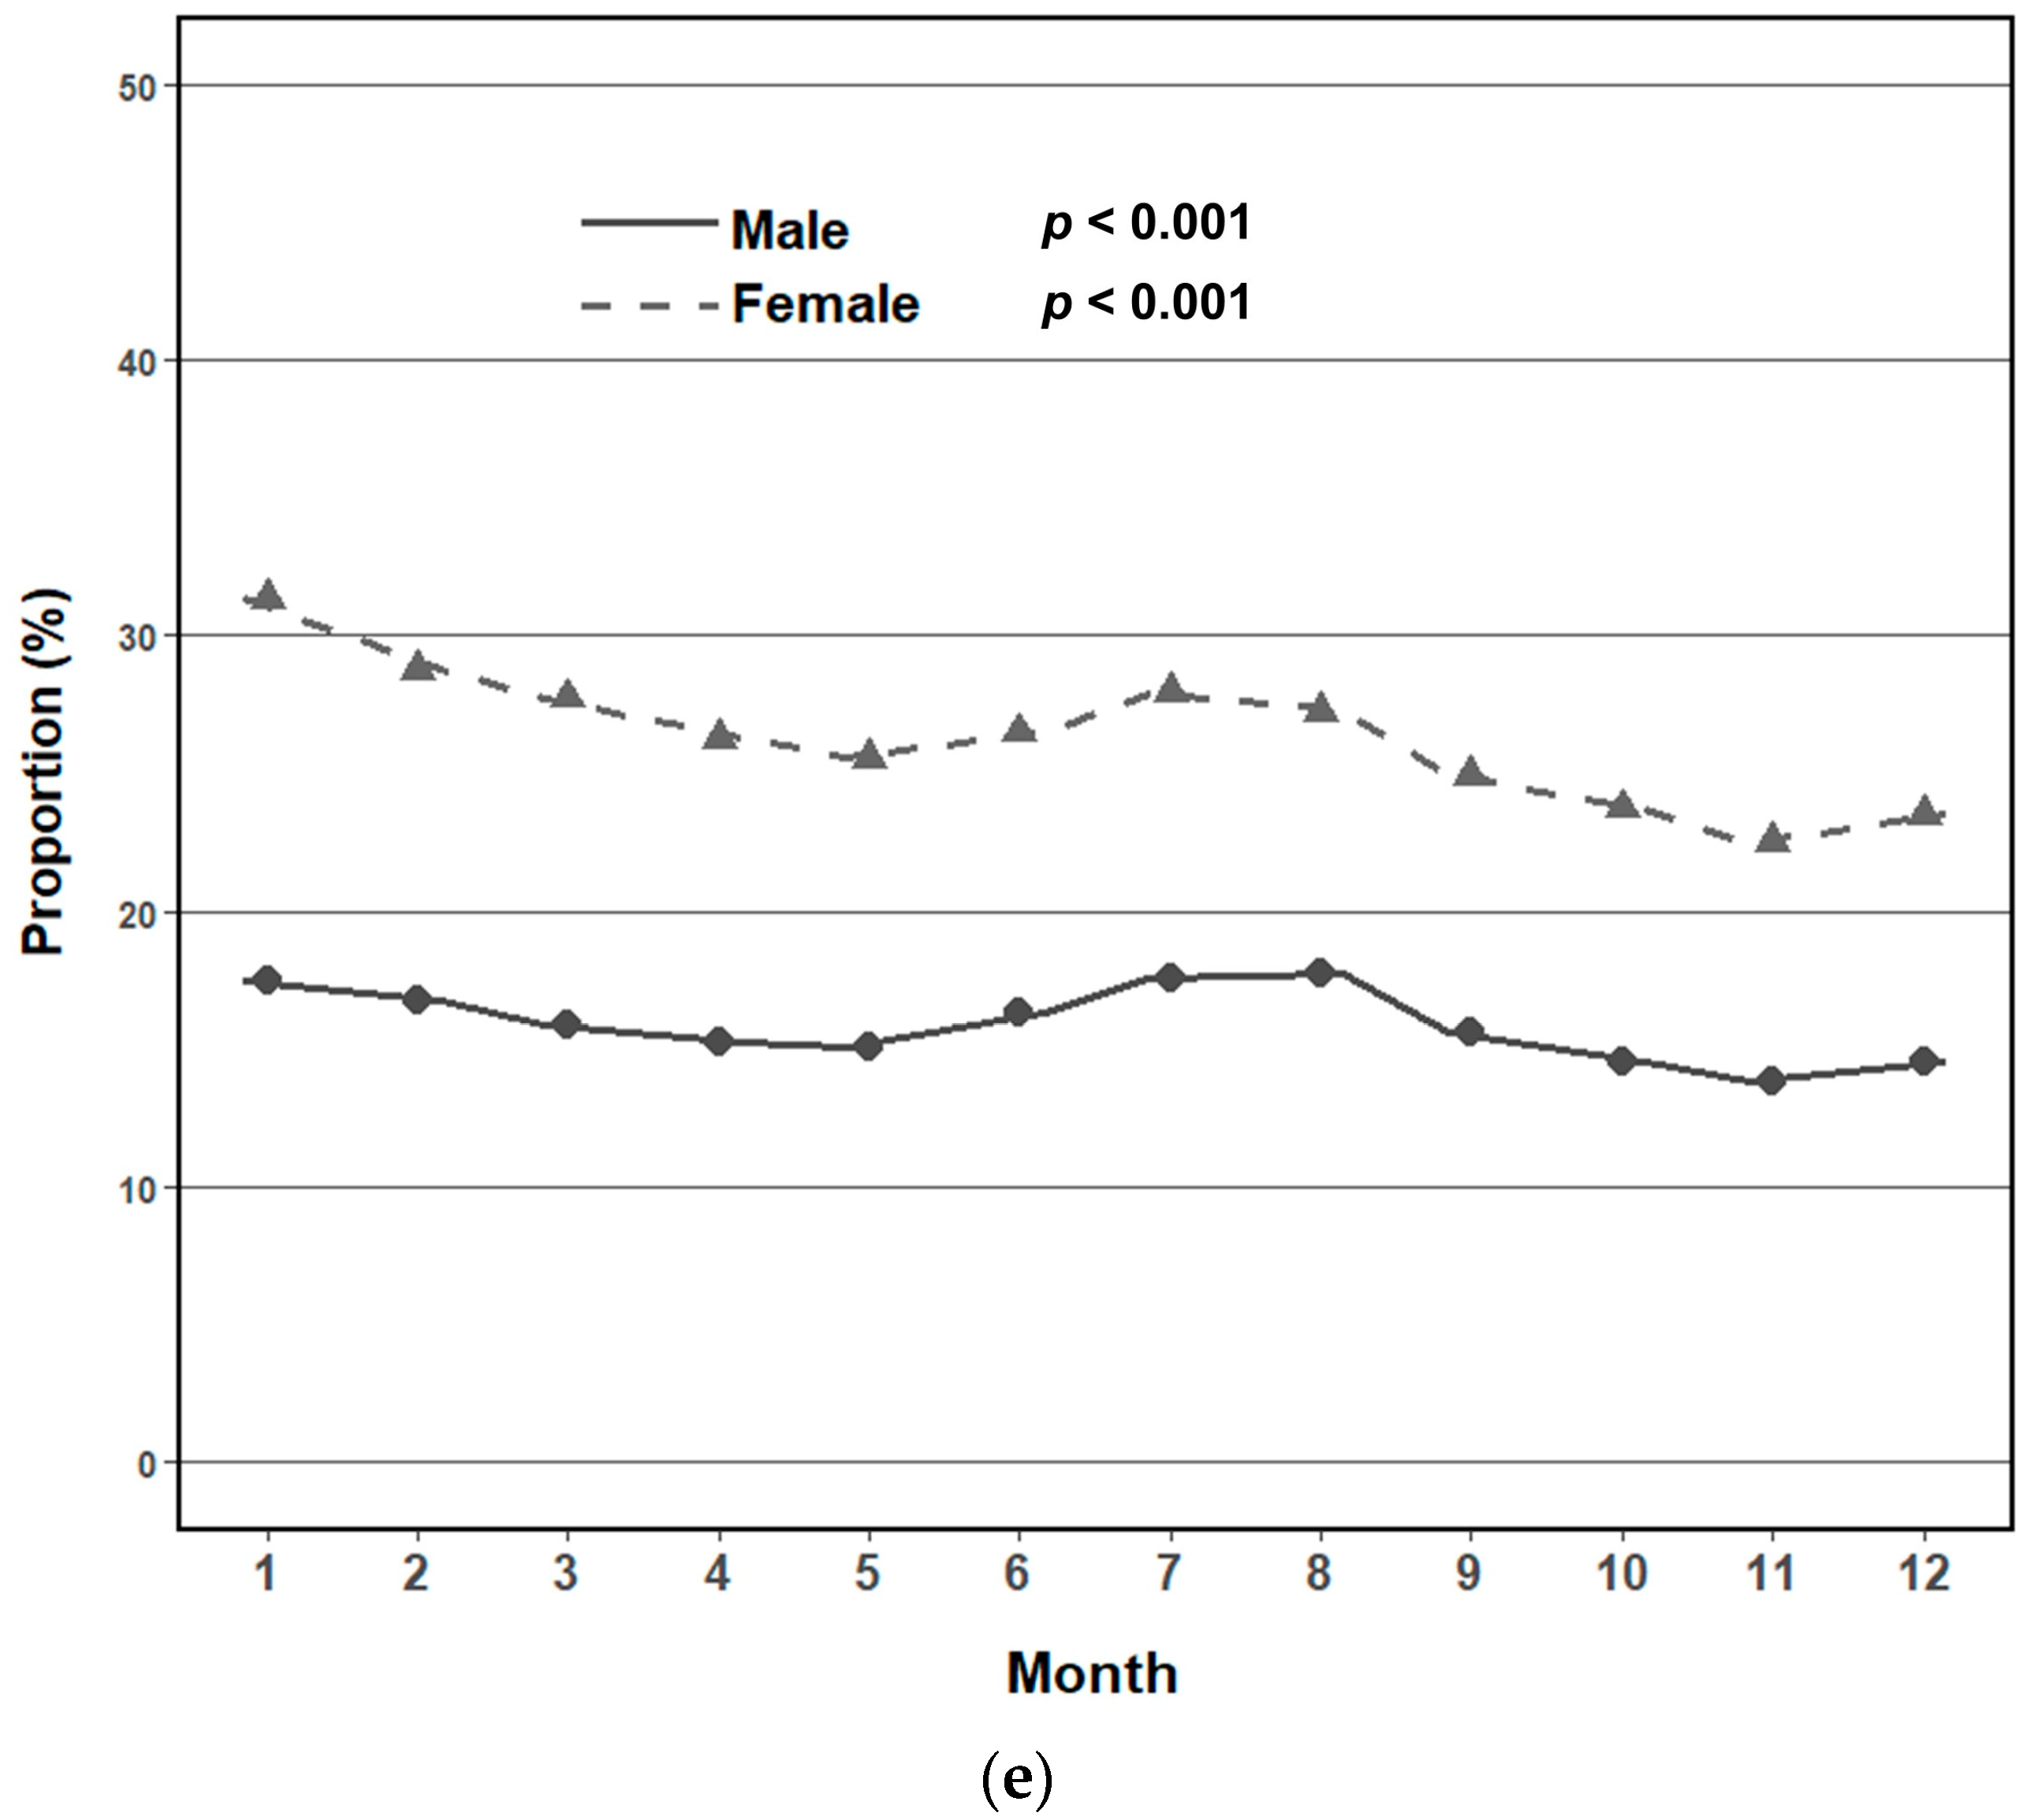
| Characteristics in Men | All | Spring | Summer | Fall | Winter | p-Value |
|---|---|---|---|---|---|---|
| Total N | 2,720,212 | 603,546 (22.2) | 610,036 (22.4) | 831,135 (30.6) | 675,495 (24.8) | |
| Age (mean ± SD) | 55.23 ± 10.86 | 57.09 ± 11.35 | 55.02 ± 10.53 | 54.12 ± 10.39 | 55.13 ± 11.06 | <0.0001 |
| Age group, n (%) | <0.0001 | |||||
| <65 years | 2,194,295 | 451,399 (74.8) | 500,976 (82.1) | 697,860 (84.0) | 544,060 (80.5) | |
| ≥65 years | 525,917 | 152,147 (25.2) | 109,060 (17.9) | 133,275 (16.0) | 131,435 (19.5) | |
| Systolic BP, mmHg | 125.71 ± 14.05 | 125.65 ± 13.91 | 123.79 ± 13.59 | 125.8 ± 13.95 | 127.37 ± 14.48 | <0.0001 |
| Diastolic BP, mmHg | 78.26 ± 9.79 | 77.88 ± 9.53 | 77.03 ± 9.59 | 78.52 ± 9.77 | 79.4 ± 10.08 | <0.0001 |
| Height, cm | 169.29 ± 6.3 | 168.73 ± 6.34 | 169.31 ± 6.26 | 169.63 ± 6.22 | 169.35 ± 6.36 | <0.0001 |
| Weight, kg | 70.56 ± 10.68 | 69.7 ± 10.44 | 70.11 ± 10.51 | 71.03 ± 10.66 | 71.15 ± 10.97 | <0.0001 |
| Waist circumference, cm | 85.2 ± 8.16 | 84.98 ± 8.27 | 84.81 ± 8.04 | 85.29 ± 8.09 | 85.62 ± 8.24 | <0.0001 |
| Household income, n (%) | <0.0001 | |||||
| Quartile 1 (1–5) | 433,981 | 100,793 (16.7) | 91,574 (15.0) | 124,331 (15.0) | 117,283 (17.4) | |
| Quartile 2 (6–10) | 463,897 | 101,391 (16.8) | 100,310 (16.4) | 137,006 (16.5) | 125,190 (18.5) | |
| Quartile 3 (11–15) | 701,126 | 150,495 (24.9) | 149,886 (24.6) | 215,716 (26.0) | 185,029 (27.4) | |
| Quartile 4 (16–20) | 1,121,208 | 250,867 (41.6) | 268,266 (44.0) | 354,082 (42.6) | 247,993 (36.7) | |
| Area of residence *, n (%) | <0.0001 | |||||
| Capital | 466,246 | 96,277 (16.0) | 100,975 (16.6) | 154,042 (18.5) | 114,952 (17.0) | |
| Metropolitan | 715,165 | 163,740 (27.1) | 163,720 (26.8) | 218,056 (26.2) | 169,649 (25.1) | |
| Provincial | 1,538,801 | 343,529 (56.9) | 345,341 (56.6) | 459,037 (55.2) | 390,894 (57.9) | |
| Comorbidities, n (%) | ||||||
| Hypertension | 825,796 | 200,400 (33.2) | 183,745 (30.1) | 241,024 (29.0) | 200,627 (29.7) | <0.0001 |
| Diabetes | 324,816 | 78,196 (13.0) | 71,812 (11.8) | 94,290 (11.3) | 80,518 (11.9) | <0.0001 |
| Dyslipidemia | 576,634 | 138,495 (22.9) | 131,561 (21.6) | 170,256 (20.5) | 136,322 (20.2) | <0.0001 |
| Medication, n (%) | ||||||
| Antihypertensive drugs | 909,740 | 222,171 (36.8) | 202,387 (33.2) | 264,015 (31.8) | 221,167 (32.7) | <0.0001 |
| Glucose-lowering drugs | 328,707 | 79,200 (13.1) | 72,659 (11.9) | 95,405 (11.5) | 81,443 (12.1) | <0.0001 |
| Lipid-lowering drugs | 580,882 | 139,705 (23.1) | 132,433 (21.7) | 171,378 (20.6) | 137,366 (20.3) | <0.0001 |
| Antiplatelet agents | 411,646 | 105,051 (17.4) | 90,395 (14.8) | 115,138 (13.9) | 101,062 (15.0) | <0.0001 |
| Smoking status, n (%) | <0.0001 | |||||
| Non-smoker | 823,935 | 191,971 (31.8) | 185,135 (30.3) | 243,195 (29.3) | 203,634 (30.1) | |
| Past smokers | 1,184,790 | 263,734 (43.7) | 273,720 (44.9) | 365,948 (44.0) | 281,388 (41.7) | |
| Current smokers | 711,487 | 147,841 (24.5) | 151,181 (24.8) | 221,992 (26.7) | 190,473 (28.2) | |
| Alcohol, n (%) | <0.0001 | |||||
| Low-risk drinking | 1,650,535 | 375,296 (62.2) | 371,822 (61.0) | 501,618 (60.4) | 401,799 (59.5) | |
| High-risk drinking | 1,069,677 | 228,250 (37.8) | 238,214 (39.0) | 329,517 (39.6) | 273,696 (40.5) | |
| Physical activity, n (%) | <0.0001 | |||||
| Non-regular exercise | 1,986,066 | 431,796 (71.5) | 435,799 (71.4) | 601,377 (72.4) | 517,094 (76.6) | |
| Regular exercise | 734,146 | 171,750 (28.5) | 174,237 (28.6) | 229,758 (27.6) | 158,401 (23.4) | |
| BMI, kg/m2, n (%) | <0.0001 | |||||
| <18.5 | 46,943 | 10,776 (1.8) | 11,820 (1.9) | 13,837 (1.7) | 10,510 (1.6) | |
| 18.5–22.9 | 766,205 | 178,117 (29.5) | 181,015 (29.7) | 227,240 (27.3) | 179,833 (26.6) | |
| 23.0–24.9 | 744,835 | 167,738 (27.8) | 169,762 (27.8) | 227,812 (27.4) | 179,523 (26.6) | |
| ≥25.0 | 1,162,229 | 246,915 (40.9) | 247,439 (40.6) | 362,246 (43.6) | 305,629 (45.2) | |
| Laboratory finding | ||||||
| Fasting glucose, mg/dL | 105.5 ± 28 | 105.41 ± 27.86 | 104 ± 26.48 | 105.11 ± 27.41 | 107.43 ± 29.99 | <0.0001 |
| Total cholesterol, mg/dL | 194.54 ± 40.56 | 192.76 ± 40.28 | 192.51 ± 39.84 | 195.99 ± 40.52 | 196.19 ± 41.35 | <0.0001 |
| LDL-C, mg/dL | 113.74 ± 39.3 | 112.99 ± 38.83 | 112.45 ± 37.36 | 114.67 ± 40.6 | 114.43 ± 39.75 | <0.0001 |
| HDL-C, mg/dL | 52.04 ± 14.73 | 52.24 ± 15.13 | 51.06 ± 14.46 | 52.35 ± 13.69 | 52.36 ± 15.77 | <0.0001 |
| Triglyceride, mg/dL | 149.12 ± 103.55 | 142.92 ± 99.97 | 150.73 ± 103.6 | 150.27 ± 103.82 | 151.79 ± 106.05 | <0.0001 |
| eGFR, mL/min/1.73 m2 | 87.94 ± 23.07 | 87.01 ± 23.76 | 87.88 ± 22.06 | 88.21 ± 23.62 | 88.43 ±22.71 | <0.0001 |
| Creatinine, mg/dL | 0.99 ± 0.56 | 0.99 ± 0.63 | 0.99 ± 0.5 | 0.99 ± 0.53 | 0.98 ± 0.57 | <0.0001 |
| Characteristics in Women | All | Spring | Summer | Fall | Winter | p-Value |
|---|---|---|---|---|---|---|
| Total N | 2,787,039 | 642,450 (23.1) | 640,302 (23.0) | 785,049 (28.2) | 719,238 (25.8) | |
| Age (mean ± SD) | 56.43 ± 11.2 | 58.87 ± 11.47 | 56.03 ± 10.77 | 55.09 ± 10.77 | 56.06 ± 11.44 | <0.0001 |
| Age group, n (%) | <0.0001 | |||||
| <65 years | 2,170,793 | 453,147 (75.1) | 513,844 (84.2) | 643,324 (77.4) | 560,478 (83.0) | |
| ≥65 years | 616,246 | 189,303 (31.4) | 126,458 (20.7) | 141,725 (17.1) | 158,760 (23.5) | |
| Systolic BP, mmHg | 122 ± 15.34 | 122.84 ± 15.39 | 120.35 ± 14.93 | 121.7 ± 15.24 | 123.05 ± 15.63 | <0.0001 |
| Diastolic BP, mmHg | 74.87 ± 9.82 | 75.08 ± 9.66 | 73.87 ± 9.67 | 74.81 ± 9.82 | 75.63 ± 9.99 | <0.0001 |
| Height, cm | 156.14 ± 6.07 | 155.39 ± 6.11 | 156.22 ± 5.99 | 156.58 ± 5.96 | 156.26 ± 6.17 | <0.0001 |
| Weight, kg | 57.89 ± 8.89 | 57.62 ± 8.75 | 57.46 ± 8.71 | 58.02 ± 8.89 | 58.38 ± 9.16 | <0.0001 |
| Waist circumference, cm | 78.07 ± 9.22 | 78.62 ± 9.27 | 77.59 ± 9.2 | 77.76 ± 9.22 | 78.36 ± 9.14 | <0.0001 |
| Household income, n (%) | <0.0001 | |||||
| Quartile 1 (1–5) | 729,637 | 172,744 (28.6) | 176,171 (28.9) | 204,631 (24.6) | 176,091 (26.1) | |
| Quartile 2 (6–10) | 585,854 | 132,223 (21.9) | 143,469 (23.5) | 168,126 (20.2) | 142,036 (21.0) | |
| Quartile 3 (11–15) | 603,794 | 139,880 (23.2) | 130,861 (21.5) | 167,482 (20.2) | 165,571 (24.5) | |
| Quartile 4 (16–20) | 867,754 | 197,603 (32.7) | 189,801 (31.1) | 244,810 (29.5) | 235,540 (34.9) | |
| Area of residence *, n (%) | <0.0001 | |||||
| Capital | 506,517 | 112,862 (18.7) | 117,066 (19.2) | 151,799 (18.3) | 124,790 (18.5) | |
| Metropolitan | 724,334 | 165,558 (27.4) | 168,039 (27.5) | 205,753 (24.8) | 184,984 (27.4) | |
| Provincial | 1,556,188 | 364,030 (60.3) | 355,197 (58.2) | 427,497 (51.4) | 409,464 (60.6) | |
| Comorbidities, n (%) | ||||||
| Hypertension | 756,357 | 205,997 (34.1) | 166,718 (27.3) | 194,600 (23.4) | 189,042 (28.0) | <0.0001 |
| Diabetes | 244,982 | 67,000 (11.1) | 53,279 (8.7) | 62,108 (7.5) | 62,595 (9.3) | <0.0001 |
| Dyslipidemia | 637,102 | 173,555 (28.8) | 145,928 (23.9) | 166,296 (20.0) | 151,323 (22.4) | <0.0001 |
| Medication, n (%) | ||||||
| Antihypertensive drugs | 861,299 | 232,616 (38.5) | 190,834 (31.3) | 221,842 (26.7) | 216,007 (32.0) | <0.0001 |
| Glucose-lowering drugs | 249,370 | 68,265 (11.3) | 54,230 (8.9) | 63,190 (7.6) | 63,685 (9.4) | <0.0001 |
| Lipid-lowering drugs | 640,982 | 174,655 (28.9) | 146,751 (24.1) | 167,195 (20.1) | 152,381 (22.6) | <0.0001 |
| Antiplatelet agents | 359,417 | 102,552 (17.0) | 77,984 (12.8) | 87,965 (10.6) | 90,916 (13.5) | <0.0001 |
| Smoking status, n (%) | <0.0001 | |||||
| Non-smoker | 2,652,037 | 613,657 (101.7) | 611,544 (100.2) | 746,400 (89.8) | 680,436 (100.7) | |
| Past smokers | 78,466 | 16,336 (2.7) | 17,037 (2.8) | 22,898 (2.8) | 22,195 (3.3) | |
| Current smokers | 56,536 | 12,457 (2.1) | 11,721 (1.9) | 15,751 (1.9) | 16,607 (2.5) | |
| Alcohol, n (%) | <0.0001 | |||||
| Low-risk drinking | 2,542,735 | 594,540 (98.5) | 583,440 (95.6) | 711,847 (85.6) | 652,908 (96.7) | |
| High-risk drinking | 244,304 | 47,910 (7.9) | 56,862 (9.3) | 73,202 (8.8) | 66,330 (9.8) | |
| Physical activity, n (%) | <0.0001 | |||||
| Non-regular exercise | 2,133,132 | 488,973 (81.0) | 479,499 (78.6) | 591,224 (71.1) | 573,436 (84.9) | |
| Regular exercise | 653,907 | 153,477 (25.4) | 160,803 (26.4) | 193,825 (23.3) | 145,802 (21.6) | |
| BMI, kg/m2, n (%) | <0.0001 | |||||
| <18.5 | 89,448 | 18,913 (3.1) | 22,802 (3.7) | 26,403 (3.2) | 21,330 (3.2) | |
| 18.5–22.9 | 1,157,374 | 255,655 (42.4) | 278,677 (45.7) | 334,566 (40.3) | 288,476 (42.7) | |
| 23.0–24.9 | 650,348 | 153,761 (25.5) | 148,744 (24.4) | 181,016 (21.8) | 166,827 (24.7) | |
| ≥25.0 | 889,869 | 214,121 (35.5) | 190,079 (31.2) | 243,064 (29.2) | 242,605 (35.9) | |
| Laboratory finding | ||||||
| Fasting glucose, mg/dL | 99.37 ± 22.29 | 100.26 ± 22.97 | 98.46 ± 21.23 | 98.66 ± 21.45 | 100.16 ± 23.39 | <0.0001 |
| Total cholesterol, mg/dL | 200.11 ± 40.51 | 199.73 ± 41.9 | 199.52 ± 40.06 | 200.57 ± 39.62 | 200.48 ± 40.59 | <0.0001 |
| LDL-C, mg/dL | 117.73 ± 38.97 | 117.82 ± 39.55 | 117.75 ± 39.73 | 117.75 ± 37.66 | 117.62 ± 39.18 | 0.0179 |
| HDL-C, mg/dL | 59.68 ± 15.98 | 59.31 ± 16.58 | 58.9 ± 15.66 | 60.56 ± 15.2 | 59.75 ± 16.48 | <0.0001 |
| Triglyceride, mg/dL | 113.99 ± 68.35 | 113.38 ± 67.66 | 114.96 ± 68.6 | 111.51 ± 66.4 | 116.37 ± 70.69 | <0.0001 |
| eGFR, mL/min/1.73 m2 | 90.05 ± 24.65 | 88.59 ± 24.91 | 89.78 ± 24.07 | 90.73 ± 24.73 | 90.78 ±24.8 | <0.0001 |
| Creatinine, mg/dL | 0.75 ± 0.55 | 0.76 ± 0.61 | 0.75 ± 0.55 | 0.75 ± 0.52 | 0.75 ± 0.5 | <0.0001 |
| Men | All | Spring | Summer | Fall | Winter | p-Value |
|---|---|---|---|---|---|---|
| Total N, n (%) | 2,720,212 | 603,546 (22.2) | 610,036 (22.4) | 831,135 (30.6) | 675,495 (24.8) | |
| Metabolic syndrome, n (%) | 861,740 | 184,522 (30.6) | 184,232 (30.2) | 260,113 (31.3) | 232,873 (34.5) | <0.0001 |
| Component of metabolic syndrome, n (%) | <0.0001 | |||||
| 0 | 377,068 | 83,114 (13.8) | 93,657 (15.4) | 118,430 (14.2) | 81,867 (12.1) | |
| 1 | 699,016 | 158,976 (26.3) | 160,469 (26.3) | 214,664 (25.8) | 164,907 (24.4) | |
| 2 | 782,388 | 176,934 (29.3) | 171,678 (28.1) | 237,928 (28.6) | 195,848 (29.0) | |
| 3 | 557,543 | 121,129 (20.1) | 118,839 (19.5) | 168,888 (20.3) | 148,687 (22.0) | |
| 4 | 251,785 | 52,436 (8.7) | 53,769 (8.8) | 75,821 (9.1) | 69,759 (10.3) | |
| 5 | 52,412 | 10,957 (1.8) | 11,624 (1.9) | 15,404 (1.9) | 14,427 (2.1) | |
| Elevated waist circumference, n (%) | 753,413 | 162,069 (26.9) | 158,444 (26.0) | 231,999 (27.9) | 200,901 (29.7) | <0.0001 |
| High fasting glucose, n (%) | 1,370,867 | 305,000 (50.5) | 291,490 (48.7) | 413,045 (49.7) | 361,332 (53.5) | <0.0001 |
| High blood pressure, n (%) | 1,650,742 | 375,648 (62.3) | 347,978 (57.0) | 498,872 (60.0) | 428,244 (63.4) | <0.0001 |
| Hypertriglyceridemia, n (%) | 1,009,035 | 205,430 (34.0) | 230,791 (37.8) | 313,058 (37.7) | 259,756 (38.5) | <0.0001 |
| Low HDL cholesterol, n (%) | 421,564 | 92,613 (15.3) | 104,835 (17.0) | 120,514 (14.5) | 103,602 (15.3) | <0.0001 |
| Women | All | Spring | Summer | Fall | Winter | p-value |
| Total N, n (%) | 2,787,039 | 642,450 (23.1) | 640,302 (23.0) | 785,049 (28.2) | 719,238 (25.8) | |
| Metabolic syndrome, n (%) | 655,161 | 164,044 (25.5) | 143,312 (22.4) | 168,826 (21.5) | 178,979 (24.9) | <0.0001 |
| Component of metabolic syndrome, n (%) | <0.0001 | |||||
| 0 | 717,290 | 147,263 (22.9) | 173,942 (27.2) | 219,346 (27.9) | 176,739 (24.6) | |
| 1 | 781,082 | 177,076 (27.6) | 181,226 (28.3) | 224,425 (28.6) | 198,355 (27.6) | |
| 2 | 633,506 | 154,067 (24.0) | 141,822 (22.1) | 172,452 (22.0) | 165,165 (23.0) | |
| 3 | 408,211 | 101,769 (15.8) | 89,362 (14.0) | 106,836 (13.6) | 110,244 (15.3) | |
| 4 | 192,302 | 48,244 (7.5) | 42,258 (6.6) | 48,478 (6.2) | 53,322 (7.4) | |
| 5 | 54,648 | 14,031 (2.2) | 11,692 (1.8) | 13,512 (1.7) | 15,413 (2.1) | |
| Elevated waist circumference, n (%) | 621,870 | 155,471 (24.2) | 132,149 (20.6) | 166,654 (21.2) | 167,596 (23.3) | <0.0001 |
| High fasting glucose, n (%) | 1,020,353 | 250,616 (39.0) | 222,140 (34.7) | 274,613 (35.0) | 272,984 (38.0) | <0.0001 |
| High blood pressure, n (%) | 1,376,848 | 345,732 (53.8) | 296,026 (46.2) | 371,549 (47.3) | 363,541 (50.6) | <0.0001 |
| Hypertriglyceridemia, n (%) | 580,333 | 131,442 (20.5) | 135,825 (21.2) | 153,885 (19.6) | 159,181 (22.1) | <0.0001 |
| Low HDL cholesterol, n (%) | 715,771 | 170,387 (26.5) | 174,308 (27.2) | 184,608 (23.5) | 186,468 (25.9) | <0.0001 |
Disclaimer/Publisher’s Note: The statements, opinions and data contained in all publications are solely those of the individual author(s) and contributor(s) and not of MDPI and/or the editor(s). MDPI and/or the editor(s) disclaim responsibility for any injury to people or property resulting from any ideas, methods, instructions or products referred to in the content. |
© 2025 by the authors. Licensee MDPI, Basel, Switzerland. This article is an open access article distributed under the terms and conditions of the Creative Commons Attribution (CC BY) license (https://creativecommons.org/licenses/by/4.0/).
Share and Cite
Kim, H.-S.; Kim, H.-J.; Kang, D.; Lee, J. Sex Differences in Seasonal Variation in Metabolic Syndrome and Its Components: A 10-Year National Health Screening Study. J. Clin. Med. 2025, 14, 5968. https://doi.org/10.3390/jcm14175968
Kim H-S, Kim H-J, Kang D, Lee J. Sex Differences in Seasonal Variation in Metabolic Syndrome and Its Components: A 10-Year National Health Screening Study. Journal of Clinical Medicine. 2025; 14(17):5968. https://doi.org/10.3390/jcm14175968
Chicago/Turabian StyleKim, Hyun-Sun, Hyun-Jin Kim, Dongwoo Kang, and Jungkuk Lee. 2025. "Sex Differences in Seasonal Variation in Metabolic Syndrome and Its Components: A 10-Year National Health Screening Study" Journal of Clinical Medicine 14, no. 17: 5968. https://doi.org/10.3390/jcm14175968
APA StyleKim, H.-S., Kim, H.-J., Kang, D., & Lee, J. (2025). Sex Differences in Seasonal Variation in Metabolic Syndrome and Its Components: A 10-Year National Health Screening Study. Journal of Clinical Medicine, 14(17), 5968. https://doi.org/10.3390/jcm14175968


