

Electrocardiographic P-Wave Indices in Metabolic Dysfunction-Associated Fatty Liver Disease and Their Relationship to Hepatic Fibrosis Risk


Abstract
1. Introduction
2. Methods
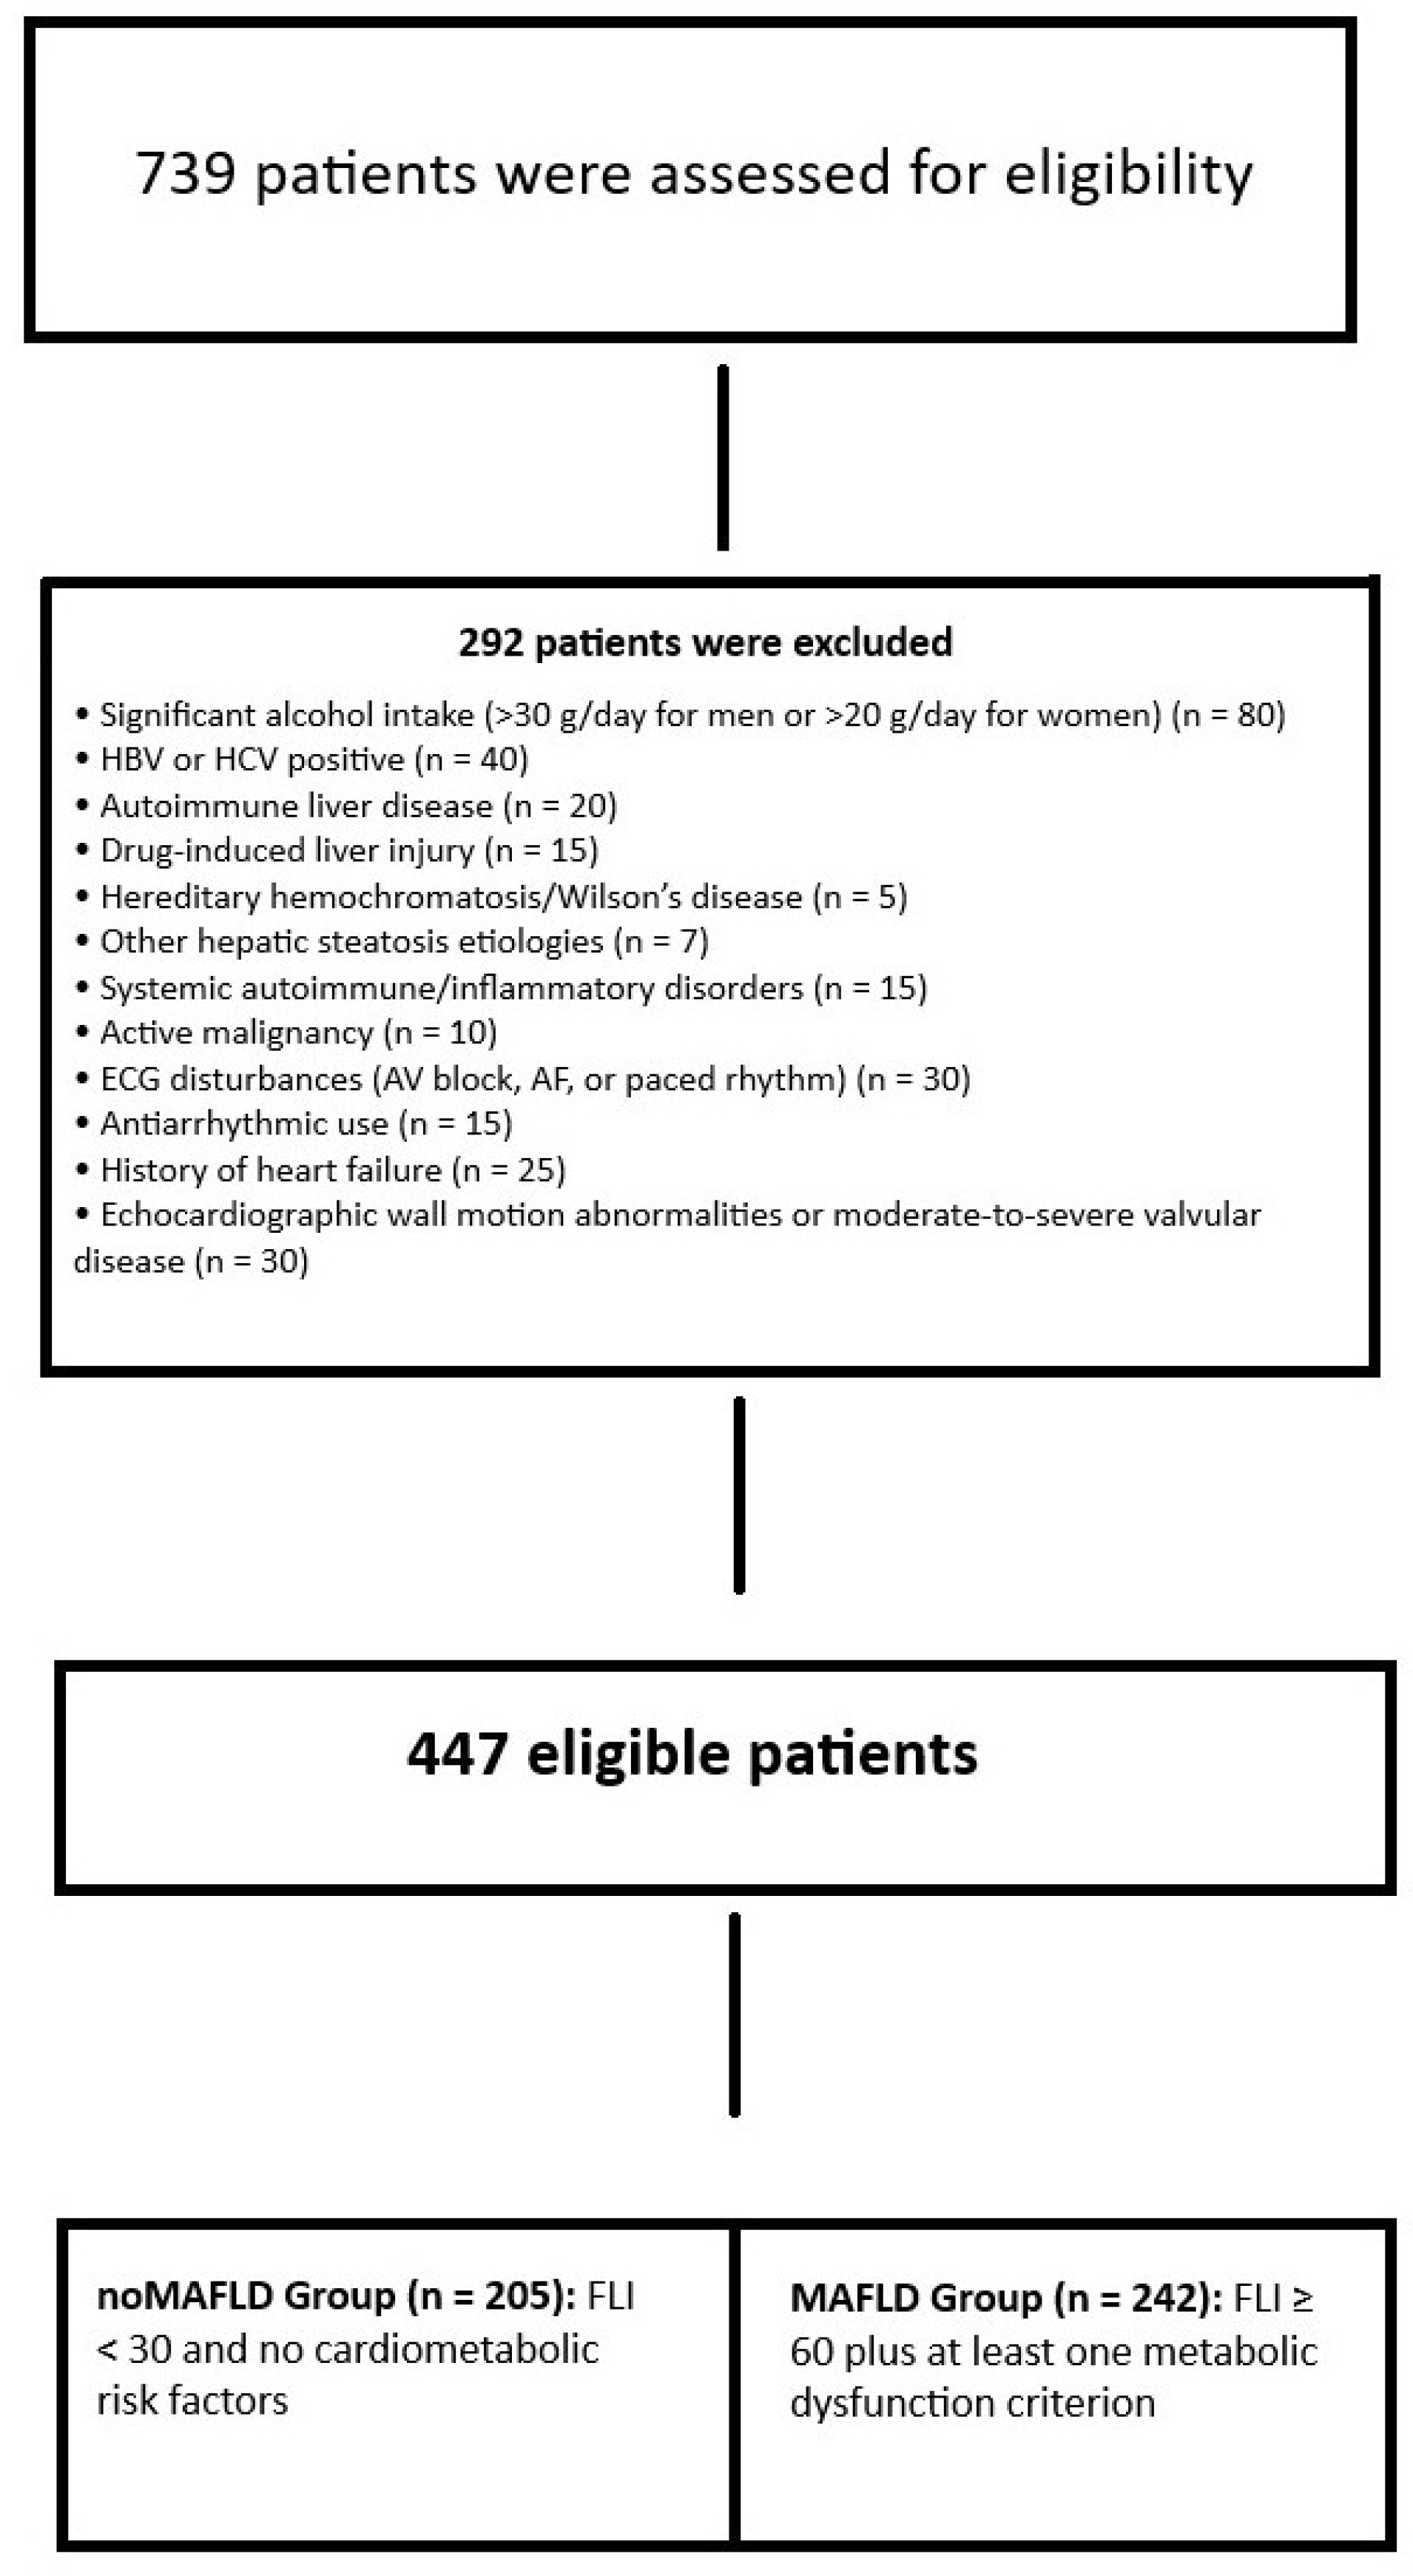
2.1. Study Population
The Diagnosis of MAFLD and the Evaluation of Hepatic Fibrosis Severity
2.2. Electrocardiographic Analysis
2.3. Echocardiography
2.4. Statistical Analysis
3. Results
4. Discussion
5. Limitations
6. Conclusions
Author Contributions
Funding
Institutional Review Board Statement
Informed Consent Statement
Data Availability Statement
Conflicts of Interest
References
- Chan, K.E.; Koh, T.J.L.; Tang, A.S.P.; Quek, J.; Yong, J.N.; Tay, P.; Tan, D.J.H.; Lim, W.H.; Lin, S.Y.; Huang, D.; et al. Global Prevalence and Clinical Characteristics of Metabolic-associated Fatty Liver Disease: A Meta-Analysis and Systematic Review of 10,739,607 Individuals. J. Clin. Endocrinol. Metab. 2022, 107, 2691–2700. [Google Scholar] [CrossRef] [PubMed]
- Fouad, Y.; Alboraie, M.; Shiha, G. Epidemiology and diagnosis of metabolic dysfunction-associated fatty liver disease. Hepatol. Int. 2024, 18, 827–833. [Google Scholar] [CrossRef]
- Habibullah, M.; Jemmieh, K.; Ouda, A.; Haider, M.Z.; Malki, M.I.; Elzouki, A.-N. Metabolic-associated fatty liver disease: A selective review of pathogenesis, diagnostic approaches, and therapeutic strategies. Front. Med. 2024, 11, 1291501. [Google Scholar] [CrossRef]
- Zhou, X.D.; Targher, G.; Byrne, C.D.; Somers, V.; Kim, S.U.; Chahal, C.A.A.; Wong, V.W.S.; Cai, J.; Shapiro, M.D.; Eslam, M.; et al. An international multidisciplinary consensus statement on MAFLD and the risk of CVD. Hepatol. Int. 2023, 17, 773–791. [Google Scholar] [CrossRef]
- Zhou, X.D.; Cai, J.; Targher, G.; Byrne, C.D.; Shapiro, M.D.; Sung, K.C.; Somers, V.K.; Chahal, C.A.A.; George, J.; Chen, L.L.; et al. Metabolic dysfunction-associated fatty liver disease and implications for cardiovascular risk and disease prevention. Cardiovasc. Diabetol. 2022, 21, 270. [Google Scholar] [CrossRef]
- Clayton-Chubb, D.; Roberts, S.K.; Majeed, A.; Woods, R.L.; Tonkin, A.M.; Nelson, M.R.; Chan, A.T.; Ryan, J.; Tran, C.; Hodge, A.; et al. Associations between MASLD, atrial fibrillation, cardiovascular events, mortality and aspirin use in older adults. GeroScience 2025, 47, 1303–1318. [Google Scholar] [CrossRef]
- Mantovani, A.; Morandin, R.; Sani, E.; Fiorio, V.; Shtembari, E.; Bonapace, S.; Petta, S.; Polyzos, S.A.; Byrne, C.D.; Targher, G. MASLD Is Associated with an Increased Long-Term Risk of Atrial Fibrillation: An Updated Systematic Review and Meta-Analysis. Liver Int. 2025, 45, e16218. [Google Scholar] [CrossRef]
- Hung, C.S.; Tseng, P.H.; Tu, C.H.; Chen, C.C.; Liao, W.C.; Lee, Y.C.; Chiu, H.M.; Lin, H.J.; Ho, Y.L.; Yang, W.S.; et al. Nonalcoholic Fatty Liver Disease Is Associated with QT Prolongation in the General Population. J. Am. Heart Assoc. 2015, 4, e001820. [Google Scholar] [CrossRef]
- Naderi, A.; Farjam, M.; Mojarrad Sani, M.; Abdollahi, A.; Alkamel, A.; Keshavarzian, O.; Tabrizi, R. The association between nonalcoholic fatty liver disease and corrected QT interval prolongation among generally healthy Iranian population: Fasa Cohort Study (FACS). Clin. Cardiol. 2023, 46, 615–621. [Google Scholar] [CrossRef]
- Sahin, K.E.; Karatas, M.; Barutcu, S.; Inanc, I.H. Evaluation of the Electrocardiographic Tp-e, Tp-e/QT, and Tp-e/QTc Parameters in Patients with Non-Alcoholic Liver Disease. Medicina 2025, 61, 766. [Google Scholar] [CrossRef]
- Nezami, Z.; Jujic, A.; Holm Isholth, H.; Magnusson, M.; Platonov, P. Associations between biomarkers and P-wave indices in patients with heart failure. Eur. Heart J. 2024, 45 (Suppl. S1), ehae666.978. [Google Scholar] [CrossRef]
- Chen, L.Y.; Ribeiro, A.L.P.; Platonov, P.G.; Cygankiewicz, I.; Soliman, E.Z.; Gorenek, B.; Ikeda, T.; Vassilikos, V.P.; Steinberg, J.S.; Varma, N.; et al. P Wave Parameters and Indices: A Critical Appraisal of Clinical Utility, Challenges, and Future Research—A Consensus Document Endorsed by the International Society of Electrocardiology and the International Society for Holter and Noninvasive Electrocardiology. Circ. Arrhythm. Electrophysiol. 2022, 15, e010435. [Google Scholar] [PubMed]
- Çinar, T.; Hayiroğlu, M.İ.; Selçuk, M.; Cinier, G.; Çiçek, V.; Doğan, S.; Kiliç, Ş.; Asal, S.; Atmaca, M.M.; Orhan, A.L. Evaluation of electrocardiographic P wave parameters in predicting long-term atrial fibrillation in patients with acute ischemic stroke. Arq. Neuro-Psiquiatr. 2022, 80, 877–884. [Google Scholar] [CrossRef] [PubMed]
- Cagdas, M.; Celik, A.I.; Bezgin, T.; Baytugan, N.Z.; Dagli, M.; Zengin, A.; Ozmen, C.; Karakoyun, S. Predictive value of P wave parameters, indices, and a novel electrocardiographic marker for silent cerebral infarction and future cerebrovascular events. J. Electrocardiol. 2023, 81, 186–192. [Google Scholar] [CrossRef]
- Yıldız, İ.; Özmen Yildiz, P.; Burak, C.; Rencüzoğulları, İ.; Karaveli Gursoy, G.; Kaya, B.; Karabağ, Y.; Çağdaş, M. P Wave Peak Time for Predicting an Increased Left Atrial Volume Index in Hemodialysis Patients. Med. Princ. Pract. 2020, 29, 262–269. [Google Scholar] [CrossRef]
- Yang, K.; Song, M. New Insights into the Pathogenesis of Metabolic-Associated Fatty Liver Disease (MAFLD): Gut-Liver-Heart Crosstalk. Nutrients 2023, 15, 3970. [Google Scholar] [CrossRef]
- Decoin, R.; Butruille, L.; Defrancq, T.; Robert, J.; Destrait, N.; Coisne, A.; Aghezzaf, S.; Woitrain, E.; Gouda, Z.; Schino, S.; et al. High liver fibrosis scores in metabolic dysfunction-associated fatty liver disease patients are associated with adverse atrial remodeling and atrial fibrillation recurrence following catheter ablation. Front. Endocrinol. 2022, 13, 957245. [Google Scholar] [CrossRef]
- European Association for the Study of the Liver (EASL); European Association for the Study of Diabetes (EASD); European Association for the Study of Obesity (EASO). EASL-EASD-EASO Clinical Practice Guidelines on the management of metabolic dysfunction-associated steatotic liver disease (MASLD). J. Hepatol. 2024, 81, 492–542. [Google Scholar]
- Bedogni, G.; Bellentani, S.; Miglioli, L.; Masutti, F.; Passalacqua, M.; Castiglione, A.; Tiribelli, C. The Fatty Liver Index: A simple and accurate predictor of hepatic steatosis in the general population. BMC Gastroenterol. 2006, 6, 33. [Google Scholar] [CrossRef]
- Vamja, R.; Vala, V.; Ramachandran, A.; Nagda, J. Diagnostic accuracy of Fatty Liver Index (FLI) for detecting Metabolic Associated Fatty Liver Disease (MAFLD) in adults attending a tertiary care hospital, a cross-sectional study. Clin. Diabetes Endocrinol. 2024, 10, 46. [Google Scholar] [CrossRef]
- European Association for the Study of the Liver; European Association for the Study of Diabetes. Publisher Correction: EASL-EASD-EASO Clinical Practice Guidelines on the management of metabolic dysfunction-associated steatotic liver disease (MASLD): Executive Summary. Diabetologia 2024, 67, 2608. [Google Scholar] [CrossRef] [PubMed]
- Wu, Y.L.; Kumar, R.; Wang, M.F.; Singh, M.; Huang, J.F.; Zhu, Y.Y.; Lin, S. Validation of conventional non-invasive fibrosis scoring systems in patients with metabolic associated fatty liver disease. World J. Gastroenterol. 2021, 27, 5753–5763. [Google Scholar] [CrossRef] [PubMed]
- Angulo, P.; Hui, J.M.; Marchesini, G.; Bugianesi, E.; George, J.; Farrell, G.C.; Enders, F.; Saksena, S.; Burt, A.D.; Bida, J.P.; et al. The NAFLD fibrosis score: A noninvasive system that identifies liver fibrosis in patients with NAFLD. Hepatology 2007, 45, 846–854. [Google Scholar] [CrossRef] [PubMed]
- Targher, G.; Valbusa, F.; Bonapace, S.; Bertolini, L.; Zenari, L.; Rodella, S.; Zoppini, G.; Mantovani, W.; Barbieri, E.; Byrne, C.D. Non-alcoholic fatty liver disease is associated with an increased incidence of atrial fibrillation in patients with type 2 diabetes. PLoS ONE 2013, 8, e57183. [Google Scholar] [CrossRef]
- Perseghin, G.; Lattuada, G.; De Cobelli, F.; Esposito, A.; Belloni, E.; Ntali, G.; Ragogna, F.; Canu, T.; Scifo, P.; Del Maschio, A.; et al. Increased mediastinal fat and impaired left ventricular energy metabolism in young men with newly found fatty liver. Hepatology 2008, 47, 51–58. [Google Scholar] [CrossRef]
- El Sharkawy, S.I.; Aboulenien, Y.; Elnagar, B.; Elkhalawany, W.; Badawi, R. Assessment of left atrial function by two-dimensional speckle tracking echocardiography in patients with metabolic-associated fatty liver disease. Egypt. Heart J. 2024, 76, 42. [Google Scholar] [CrossRef]
- Niederreiter, L.; Tilg, H. Cytokines and fatty liver diseases. Liver Res. 2018, 2, 14–20. [Google Scholar] [CrossRef]
- Targher, G.; Mantovani, A.; Grander, C.; Foco, L.; Motta, B.; Byrne, C.D.; Pramstaller, P.P.; Tilg, H. Association between non-alcoholic fatty liver disease and impaired cardiac sympathetic/parasympathetic balance in subjects with and without type 2 diabetes—The Cooperative Health Research in South Tyrol (CHRIS)-NAFLD sub-study. Nutr. Metab. Cardiovasc. Dis. 2021, 31, 3464–3473. [Google Scholar] [CrossRef]
- Karakayali, M.; Artac, I.; Omar, T.; Rencuzogullari, I.; Karabag, Y.; Hamideyin, S. Assessment of the efficacy of the electrocardiographic P-wave peak time in predicting atrial high rate episode in patients with cardiac implantable electronic devices. J. Electrocardiol. 2023, 80, 40–44. [Google Scholar] [CrossRef]
- Çetinarslan, Ö.; Yazıcı, S.E.; Atasever, A.; Uçar, F.M. Post-Liver Transplantation Atrial Fibrillation: Insights into Clinical and ECG Predictors. Ann. Transplant. 2025, 30, e948243. [Google Scholar] [CrossRef]
- Burak, C.; Çağdaş, M.; Rencüzoğulları, I.; Karabağ, Y.; Artac, I.; Yesin, M.; Çınar, T.; Yıldız, I.; Suleymanoglu, M.; Tanboğa, H.I. Association of P wave peak time with left ventricular end-diastolic pressure in patients with hypertension. J. Clin. Hypertens. 2019, 21, 608–615. [Google Scholar] [CrossRef] [PubMed]
- Gomaa, M.M.M.; Elsafty, E.E.A.; Gomaa, H.M.M.; Abdulrahim, M.M.; Eladawy, A.H.H. Study of P wave dispersion in patients with paroxysmal atrial fibrillation and its role in prediction of atrial fibrillation recurrence. Egypt. Heart J. 2024, 76, 80. [Google Scholar] [CrossRef] [PubMed]
- Perzanowski, C.; Ho, A.T.; Jacobson, A.K. Increased P-wave dispersion predicts recurrent atrial fibrillation after cardioversion. J. Electrocardiol. 2005, 38, 43–46. [Google Scholar] [CrossRef]


| noMAFLD (n = 205) | MAFLD (n = 242) | p | |
|---|---|---|---|
| Demographics/Clinic | |||
| Age (years), mean ± SD | 56.8 ± 10.9 | 55.5 ± 10.8 | 0.180 |
| Female, n (%) | 98 (47.8%) | 110 (45.5%) | 0.622 |
| BMI (kg/m2), mean ± SD | 24.6 ± 3.2 | 29.8 ± 4.7 | <0.001 |
| Smoker, n (%) | 44 (21.5%) | 45 (18.6%) | 0.450 |
| Diabetes Mellitus, n (%) | 25 (12.2%) | 75 (31.0%) | <0.001 |
| Hypertension, n (%) | 51 (24.9%) | 85 (35.1%) | 0.018 |
| Chronic Alcohol, n (%) | 18 (8.8%) | 25 (10.3%) | 0.572 |
| Waist Circumference (cm), mean ± SD | 91.1 ± 6.4 | 111.8 ± 12.0 | <0.001 |
| Laboratory | |||
| Fasting Glucose (mg/dL), median [IQR] | 96 [71–177] | 100 [77–188] | 0.240 |
| Total Cholesterol (mg/dL), mean ± SD | 189.5 ± 36.0 | 193.2 ± 38.3 | 0.290 |
| Triglycerides (mg/dL), mean ± SD | 154.1 ± 70.5 | 180.5 ± 100.8 | 0.004 |
| LDL (mg/dL), mean ± SD | 110.2 ± 29.5 | 111.8 ± 36.2 | 0.620 |
| HDL (mg/dL), mean ± SD | 47.5 ± 10.1 | 46.2 ± 10.0 | 0.180 |
| AST (U/L), median [IQR] | 18 [9–45] | 25 [14–82] | <0.001 |
| ALT (U/L), median [IQR] | 19 [7–95] | 26 [13–152] | <0.001 |
| Bilirubin Total (mg/dL), median [IQR] | 0.56 [0.18–1.30] | 0.60 [0.24–2.00] | 0.430 |
| Bilirubin Direct (mg/dL), median [IQR] | 0.13 [0.04–0.42] | 0.15 [0.06–0.59] | 0.230 |
| ALP (U/L), mean ± SD | 72.3 ± 18.5 | 75.1 ± 21.4 | 0.125 |
| GGT (U/L), median [IQR] | 24 [9–60] | 36 [11–92] | 0.010 |
| LDH (U/L), mean ± SD | 185.1 ± 29.2 | 191.3 ± 36.5 | 0.110 |
| INR, mean ± SD | 0.99 ± 0.14 | 1.03 ± 0.11 | 0.192 |
| Creatinine (mg/dL), mean ± SD | 0.87 ± 0.18 | 0.85 ± 0.19 | 0.130 |
| GFR (mL/min/1.73 m2), mean ± SD | 85.5 ± 22.8 | 86.5 ± 19.3 | 0.550 |
| Total Protein (g/dL), mean ± SD | 75.1 ± 4.4 | 74.4 ± 4.8 | 0.120 |
| Albumin (g/dL), mean ± SD | 42.2 ± 2.7 | 42.1 ± 3.0 | 0.720 |
| Sodium (mmol/L), mean ± SD | 139.3 ± 3.2 | 139.0 ± 3.2 | 0.310 |
| Potassium (mmol/L), mean ± SD | 4.39 ± 0.37 | 4.38 ± 0.37 | 0.560 |
| WBC (×103/L), mean ± SD | 7.45 ± 1.80 | 7.42 ± 2.00 | 0.620 |
| Neutrophil (×103/L), mean ± SD | 4.38 ± 1.28 | 4.35 ± 1.32 | 0.530 |
| Lymphocyte (×103/L), mean ± SD | 2.38 ± 0.70 | 2.40 ± 0.74 | 0.800 |
| Monocyte (×103/L), mean ± SD | 0.55 ± 0.16 | 0.54 ± 0.15 | 0.530 |
| Hemoglobin (g/dL), mean ± SD | 14.25 ± 1.48 | 13.98 ± 1.46 | 0.065 |
| Platelet (×103/L), mean ± SD | 249.0 ± 67.7 | 258.1 ± 77.5 | 0.240 |
| Sedimentation, mean ± SD | 13.8 ± 11.2 | 15.5 ± 11.5 | 0.140 |
| CRP (mg/dL), mean ± SD | 3.85 ± 3.70 | 4.65 ± 5.90 | 0.160 |
| Echocardiographic Parameters | |||
| LVEF (%), mean ± SD | 62.1 ± 4.8 | 61.8 ± 5.0 | 0.520 |
| Left Atrium Area (cm2), median [IQR] | 22.8 [18.9–25.7] | 28.3 [24.2–31.5] | <0.001 |
| E/e’ lateral, mean ± SD | 8.2 ± 2.1 | 10.5 ± 3.3 | <0.001 |
| E/e’ medial, mean ± SD | 6.5 ± 1.8 | 8.9 ± 2.7 | <0.001 |
| E/A Ratio, mean ± SD | 1.02 ± 0.31 | 0.98 ± 0.29 | 0.210 |
| Deceleration Time (ms), median [IQR] | 180 [150–210] | 190 [160–220] | 0.150 |
| LVEDD (mm), mean ± SD | 47.2 ± 3.8 | 48.3 ± 4.2 | 0.131 |
| IVS Thickness (mm), mean ± SD | 9.7 ± 1.2 | 9.8 ± 1.4 | 0.294 |
| PWT (mm), mean ± SD | 8.9 ± 1.1 | 9.2 ± 1.3 | 0.372 |
| Medications | |||
| Oral Antidiabetics, n (%) | 22 (10.7%) | 30 (12.4%) | 0.612 |
| Insulin, n (%) | 8 (3.9%) | 12 (5.0%) | 0.652 |
| Statins, n (%) | 35 (17.1%) | 48 (19.8%) | 0.478 |
| Beta Blockers, n (%) | 42 (20.5%) | 55 (22.7%) | 0.642 |
| Calcium Channel Blockers, n (%) | 28 (13.7%) | 38 (15.7%) | 0.589 |
| ACEI/ARBs, n (%) | 45 (22.0%) | 60 (24.8%) | 0.532 |
| MAFLD with Lower Fibrosis Risk (n = 170) (NFS Score < −1.455) | MAFLD with Higher Fibrosis Risk (n = 72) (NFS Score > −1.455) | p | |
|---|---|---|---|
| NFS score, median [IQR] | −1.9 [−2.4–−1.5] | 0.4 [−0.8–1.6] | <0.001 |
| Demographic/Clinic | |||
| Age (years), mean ± SD | 53.2 ± 10.4 | 59.7 ± 9.8 | <0.001 |
| Female, n (%) | 78 (45.9%) | 32 (44.4%) | 0.842 |
| BMI (kg/m2), mean ± SD | 29.1 ± 4.5 | 31.5 ± 4.9 | 0.002 |
| Waist circumference (cm), mean ± SD | 110.2 ± 11.5 | 115.3 ± 12.8 | 0.013 |
| Diabetes, n (%) | 45 (26.5%) | 30 (41.7%) | 0.018 |
| Hypertension, n (%) | 53 (31.2%) | 32 (44.4%) | 0.049 |
| Smoker, n (%) | 32 (18.8%) | 13 (18.1%) | 0.892 |
| Chronic alcohol, n (%) | 16 (9.4%) | 9 (12.5%) | 0.452 |
| Laboratory | |||
| AST (U/L), median [IQR] | 23 [16–38] | 42 [28–68] | <0.001 |
| ALT (U/L), median [IQR] | 28 [18–44] | 48 [32–130] | <0.001 |
| GGT (U/L), median [IQR] | 32 [18–76] | 58 [35–115] | <0.001 |
| ALP (U/L), mean ± SD | 74.3 ± 20.1 | 77.2 ± 24.3 | 0.352 |
| Bilirubin total (mg/dL), median [IQR] | 0.58 [0.22–1.95] | 0.65 [0.28–2.20] | 0.128 |
| INR, mean ± SD | 1.02 ± 0.10 | 1.05 ± 0.13 | 0.064 |
| Fasting glucose (mg/dL), median [IQR] | 98 [75–182] | 108 [85–210] | 0.005 |
| Triglycerides (mg/dL), mean ± SD | 175.3 ± 95.2 | 193.8 ± 112.4 | 0.032 |
| HDL (mg/dL), mean ± SD | 46.5 ± 9.8 | 45.2 ± 10.5 | 0.382 |
| LDL (mg/dL), mean ± SD | 110.8 ± 35.1 | 114.2 ± 38.7 | 0.512 |
| CRP (mg/dL), mean ± SD | 4.2 ± 5.1 | 5.8 ± 7.3 | 0.048 |
| Platelets (×103/L), mean ± SD | 255.1 ± 72.3 | 235.8 ± 68.9 | 0.046 |
| Echocardiography | |||
| LVEF (%), mean ± SD | 62.0 ± 4.9 | 61.4 ± 5.2 | 0.410 |
| E/e’ lateral, mean ± SD | 9.5 ± 2.6 | 12.2 ± 3.5 | <0.001 |
| E/e’ medial, mean ± SD | 7.8 ± 2.3 | 9.6 ± 3.0 | <0.001 |
| Left atrium area (cm2), median [IQR] | 27.1 [23.5–30.0] | 30.5 [26.8–34.0] | <0.001 |
| LVEDD (mm), mean ± SD | 48.1 ± 4.0 | 49.8 ± 4.5 | 0.008 |
| IVS thickness (mm), mean ± SD | 9.8 ± 1.3 | 10.2 ± 1.5 | 0.041 |
| PWT (mm), mean ± SD | 9.2 ± 1.2 | 9.7 ± 1.4 | 0.009 |
| Medications | |||
| Oral antidiabetics, n (%) | 20 (11.8%) | 10 (13.9%) | 0.682 |
| Insulin, n (%) | 10 (5.9%) | 16 (22.2%) | <0.001 |
| Statins, n (%) | 32 (18.8%) | 21 (29.2%) | 0.074 |
| Beta blockers, n (%) | 38 (22.4%) | 17 (23.6%) | 0.832 |
| ACEI/ARBs, n (%) | 40 (23.5%) | 20 (27.8%) | 0.482 |
| noMAFLD (n = 205) | MAFLD (n = 242) | p | |
|---|---|---|---|
| Heart rate (bpm) | 72 ± 13 | 75 ± 14 | 0.089 |
| P-wave duration D2 (ms) | 92 ± 13 | 94 ± 12 | 0.245 |
| P-wave max (ms) | 118 ± 15 | 121 ± 14 | 0.189 |
| P-wave min (ms) | 72 ± 9 | 74 ± 10 | 0.157 |
| P-wave dispersion (ms) | 46 ± 11 | 55 ± 13 | 0.010 |
| P-wave terminal force V1 (mm·ms) | 28 [22–34] | 38 [31–46] | 0.021 |
| P-wave peak time D2 (ms) | 52 ± 10 | 63 ± 12 | 0.003 |
| P-wave peak time V1 (ms) | 60 ± 13 | 68 ± 14 | 0.005 |
| QRS duration (ms) | 96 ± 16 | 98 ± 15 | 0.351 |
| QT interval (ms) | 380 ± 32 | 400 ± 36 | <0.001 |
| QTc (Bazett, ms) | 410 ± 25 | 430 ± 30 | <0.001 |
| PR interval (ms) | 152 ± 22 | 155 ± 24 | 0.287 |
| P-wave morphology in V1 | 0.901 | ||
| Negative, n (%) | 4 (2.0%) | 5 (2.1%) | |
| Positive, n (%) | 56 (27.3%) | 68 (28.1%) | |
| Biphasic (±), n (%) | 145 (70.7%) | 169 (69.8%) |
| NFS < −1.455 (Lower Fibrosis) | NFS ≥ −1.455 (Higher Fibrosis) | p-Value | |
|---|---|---|---|
| Heart rate (bpm) | 74 ± 13 | 77 ± 15 | 0.152 |
| RR interval (ms) | 811 ± 148 | 780 ± 151 | 0.138 |
| P-wave duration D2 (ms) | 92 ± 12 | 95 ± 13 | 0.201 |
| P-wave max (ms) | 119 ± 14 | 122 ± 15 | 0.183 |
| P-wave min (ms) | 73 ± 9 | 75 ± 10 | 0.241 |
| P-wave dispersion (ms) | 52 ± 12 | 58 ± 14 | 0.006 |
| P-wave terminal force V1 (mm·ms) | 35 [29–42] | 42 [35–50] | 0.015 |
| P-wave peak time D2 (ms) | 60 ± 11 | 66 ± 13 | 0.008 |
| P-wave peak time V1 (ms) | 65 ± 13 | 71 ± 15 | 0.010 |
| P-wave morphology in V1 | 0.887 | ||
| Negative, n (%) | 3 (1.8%) | 2 (2.8%) | |
| Positive, n (%) | 48 (28.2%) | 20 (27.8%) | |
| Biphasic (±), n (%) | 119 (70.0%) | 50 (69.4%) | |
| QRS duration (ms) | 97 ± 15 | 99 ± 16 | 0.387 |
| QT interval (ms) | 395 ± 34 | 412 ± 38 | 0.002 |
| QTc (Bazett, ms) | 425 ± 28 | 440 ± 32 | 0.001 |
| PR interval (ms) | 154 ± 23 | 157 ± 25 | 0.421 |
| Unadjusted OR (95% CI) p-Value | Model 1 OR (95% CI) p-Value | Model 2 OR (95% CI) p-Value | Model 3 OR (95% CI) p-Value | |||
|---|---|---|---|---|---|---|
| P-wave duration D2 (ms) | 1.02 (1.00–1.04) p = 0.042 * | 1.01 (0.99–1.03) p = 0.198 | 1.00 (0.98–1.02) p = 0.712 | 0.99 (0.97–1.01) p = 0.382 | ||
| P-wave dispersion (ms) | 1.05 (1.02–1.08) p = 0.001 ** | 1.04 (1.01–1.07) p = 0.009 ** | 1.03 (1.00–1.06) p = 0.039 * | 1.03 (1.00–1.06) p = 0.048 * | ||
| P-wave terminal force V1 (mm·ms) | 1.02 (1.00–1.04) p = 0.085 | 1.01 (0.99–1.03) p = 0.324 | 1.00 (0.98–1.02) p = 0.512 | 0.99 (0.97–1.01) p = 0.287 | ||
| P-wave peak time D2 (ms) | 1.08 (1.05–1.11) p < 0.001 *** | 1.07 (1.04–1.10) p < 0.001 *** | 1.06 (1.03–1.09) p < 0.001 *** | 1.05 (1.02–1.08) p = 0.002 ** | ||
| P-wave peak time V1 (ms) | 1.04 (1.01–1.07) p = 0.004 ** | 1.03 (1.00–1.06) p = 0.023 * | 1.02 (0.99–1.05) p = 0.157 | 1.01 (0.98–1.04) p = 0.421 | ||
| Model Fit Statistics for MAFLD Prediction Models | ||||||
| Fit Metric | Model 1 (Demographics + Obesity) | Model 2 (+ Metabolic Factors) | Model 3 (+ Cardiac Remodeling) | |||
| Omnibus Test (χ2, p-value) | 38.6, p < 0.001 *** | 52.3, p < 0.001 *** | 61.8, p < 0.001 *** | |||
| Nagelkerke R2 | 0.28 | 0.36 | 0.41 | |||
| Hosmer–Lemeshow Test (χ2, p-value) | 6.24, p = 0.398 | 5.87, p = 0.438 | 4.92, p = 0.553 | |||
| Classification Accuracy (%) | 72.3% | 75.1% | 77.6% | |||
| AUC (95% CI) | 0.75 (0.70–0.80) | 0.80 (0.76–0.84) | 0.83 (0.79–0.87) | |||
| AIC | 538.2 | 522.7 | 513.9 | |||
| BIC | 572.4 | 576.1 | 584.8 | |||
| Univariate | Multivariate | |||||||
|---|---|---|---|---|---|---|---|---|
| B (SE) | β | t | p-Value | B (SE) | β | t | p-Value | |
| P-wave dispersion (ms) | 0.32 (0.08) | 0.12 | 4.00 | <0.001 | 0.27 (0.10) | 0.09 | 2.70 | 0.007 |
| P-wave duration in D2 (ms) | 0.11 (0.09) | 0.04 | 1.22 | 0.222 | 0.05 (0.11) | 0.02 | 0.45 | 0.650 |
| P-wave terminal force in V1 (mm·ms) | −0.14 (0.12) | −0.05 | −1.17 | 0.243 | −0.12 (0.15) | −0.04 | −0.80 | 0.425 |
| P-wave peak time in D2 (ms) | 0.45 (0.10) | 0.17 | 4.50 | <0.001 | 0.31 (0.13) | 0.12 | 2.38 | 0.018 |
| P-wave peak time in V1 (ms) | 0.08 (0.11) | 0.03 | 0.73 | 0.468 | 0.03 (0.14) | 0.01 | 0.21 | 0.832 |
Disclaimer/Publisher’s Note: The statements, opinions and data contained in all publications are solely those of the individual author(s) and contributor(s) and not of MDPI and/or the editor(s). MDPI and/or the editor(s) disclaim responsibility for any injury to people or property resulting from any ideas, methods, instructions or products referred to in the content. |
© 2025 by the authors. Licensee MDPI, Basel, Switzerland. This article is an open access article distributed under the terms and conditions of the Creative Commons Attribution (CC BY) license (https://creativecommons.org/licenses/by/4.0/).
Share and Cite
Ateş, M.S.; Sökmen, E. Electrocardiographic P-Wave Indices in Metabolic Dysfunction-Associated Fatty Liver Disease and Their Relationship to Hepatic Fibrosis Risk. J. Clin. Med. 2025, 14, 4650. https://doi.org/10.3390/jcm14134650
Ateş MS, Sökmen E. Electrocardiographic P-Wave Indices in Metabolic Dysfunction-Associated Fatty Liver Disease and Their Relationship to Hepatic Fibrosis Risk. Journal of Clinical Medicine. 2025; 14(13):4650. https://doi.org/10.3390/jcm14134650
Chicago/Turabian StyleAteş, Muhammet Salih, and Erdoğan Sökmen. 2025. "Electrocardiographic P-Wave Indices in Metabolic Dysfunction-Associated Fatty Liver Disease and Their Relationship to Hepatic Fibrosis Risk" Journal of Clinical Medicine 14, no. 13: 4650. https://doi.org/10.3390/jcm14134650
APA StyleAteş, M. S., & Sökmen, E. (2025). Electrocardiographic P-Wave Indices in Metabolic Dysfunction-Associated Fatty Liver Disease and Their Relationship to Hepatic Fibrosis Risk. Journal of Clinical Medicine, 14(13), 4650. https://doi.org/10.3390/jcm14134650