Article

Transitional Lesions, One More Step Towards Understanding the Pathogenesis of Adenomyosis

by
Emilie Wacheul
1,2,
Marie-Madeleine Dolmans
1,3,
Jérôme Ambroise
4,
Jacques Donnez
5 and
Alessandra Camboni
1,2,*
1
Gynecology Research Unit, Institut de Recherche Expérimentale et Clinique, Université Catholique de Louvain, 1200 Brussels, Belgium
2
Anatomopathology Department, Cliniques Universitaires Saint-Luc, 1200 Brussels, Belgium
3
Gynecology Department, Cliniques Universitaires Saint-Luc, 1200 Brussels, Belgium
4
Centre des Technologies Moléculaires Appliquées (CTMA), Institut de Recherche Expérimentale et Clinique, Université Catholique de Louvain, 1200 Brussels, Belgium
5
Society for Research into Infertility, 1150 Brussels, Belgium
*
Author to whom correspondence should be addressed.
J. Clin. Med. 2025, 14(13), 4578; https://doi.org/10.3390/jcm14134578 (registering DOI)
Submission received: 28 March 2025 / Revised: 10 June 2025 / Accepted: 23 June 2025 / Published: 27 June 2025
(This article belongs to the Section Obstetrics & Gynecology)

Abstract

Background/Objectives: Adenomyosis is a benign gynecological disorder associated with abnormal uterine bleeding, dysmenorrhea, and subfertility. Its pathogenesis has not yet been elucidated. The most widely accepted theory points to repeated mechanical or hormonal stress at the endometrial–myometrial interface, leading to activation of the tissue injury and repair (TIAR) mechanism. Studies suggest that the immune system may play a role in disease pathogenesis, but inconsistencies persist due to differences in studied samples and evaluated menstrual cycle phases. The goal of our study was to apply a novel technique (multiplex) to investigate different immune cell phenotypes in uteri from adenomyosis patients according to the cycle phase. Methods: This study analyzed immune cell populations in adenomyotic uteri using immunohistochemistry and multiplex immunofluorescence on 30 adenomyotic and 15 healthy hysterectomy samples. Results: Compared to eutopic endometrium, transitional and adenomyotic lesions displayed reduced immune infiltrates, particularly T cells, NK cells, B cells, macrophages, and dendritic cells. Conversely, mast cells were significantly elevated in transitional lesions. Conclusions: The present study suggests mast cell implication in adenomyosis development and pain, through their implication in tissue remodeling, angiogenesis, and neurogenic inflammation. Transitional lesions highlighted the progressive nature of adenomyosis, supporting the TIAR hypothesis. These findings emphasize the importance of mast cells in disease progression and underscore the need for further studies to explore immune-targeted therapies.

1. Introduction

Adenomyosis is a benign gynecological disorder associated with abnormal uterine bleeding, dysmenorrhea, and subfertility. Histologically, it is defined as foci of glands and stromal cells invading the myometrium by more than 2.5 mm, surrounded by hyperplastic smooth muscle [1,2]. Its pathogenesis has not yet been elucidated. The most widely accepted theory points to repeated mechanical or hormonal stress at the endometrial–myometrial interface, leading to activation of the tissue injury and repair (TIAR) mechanism, subsequently triggering cellular and molecular responses that remodel the junctional zone [3]. This process facilitates the invagination of endometrial tissue into the myometrium. A number of studies suggest that the immune system may play a role in disease pathogenesis [4,5], but inconsistencies persist due to differences in studied samples and evaluated menstrual cycle phases. The goal of our study was to apply a novel technique (multiplex) to investigate different immune cell phenotypes in uteri from adenomyosis patients according to the cycle phase.

2. Materials and Methods

2.1. Study Participants and Tissue Collection

Human tissues used in this study were obtained in accordance with the Declaration of Helsinki and approved by the Ethics Committee of the Cliniques Universitaires Saint-Luc (CUSL) and Université Catholique de Louvain on 31 August 2020 (ref: 2020/14AOU/410).
A total of forty-five hysterectomy samples, fixed in 4% formaldehyde and embedded in paraffin blocks for histological analysis, were collected from the anatomopathology archives of CUSL. The adenomyosis group comprised thirty patients diagnosed via magnetic resonance imaging or transvaginal ultrasound (TVUS), with histological confirmation from surgical specimens. Morphological Uterus Sonographic Assessment (MUSA) criteria were used for the TVUS diagnosis of adenomyosis, and Bazot and Darai’s classification for the MRI diagnosis [6].
The healthy control group consisted of fifteen patients with no signs of adenomyosis, endometriosis, or any endometrial pathology. They had a hysterectomy for uterine fibroids or prolapsus (see Table 1). Samples were selected based on menstrual phases, with one-third derived from each phase.
All patients were premenopausal and had not received hormones or selective steroid receptor modulators for at least three months prior to the intervention.

2.2. Immunohistochemistry

Neutrophils, B cells, and mast cells were immunostained against specific surface receptors: CD15, CD20, and CD117, respectively.
Serial Sections (5 µm) were cut from each paraffin block using a microtome. After deparaffinization and rehydration, sections were incubated for 20 min in a 3% H2O2 solution to inhibit endogenous peroxidase activity. For heat-induced epitope retrieval (HIER), slides were heated in Tris-EDTA (pH 9) in a microwave for 20 min. Following cooling, 5% BSA was applied to block non-specific protein binding sites. Slides were then incubated at room temperature for one hour with primary antibodies: CD15 (Mouse anti-human, 1:300, BD Pharmingen (San Diego, CA, USA), clone MMA), CD20 (Mouse anti-human, 1:200, Biocare Medical (Pacheco, CA, USA), clone L26), and CD117 (Rabbit anti-human, 1:800, Dako (Carpinteria, CA, USA), A4502).
After rinsing, slides were incubated with EnVision anti-rabbit (Agilent (Santa Clara, CA, USA) K4003) or anti-mouse (Agilent K4001) secondary antibodies for 60 min. Bound antibody complexes were visualized using diaminobenzidine (DAB) (Dako K3468) staining, followed by counterstaining with hematoxylin (Dako S3301). Finally, the slides were dehydrated and mounted.

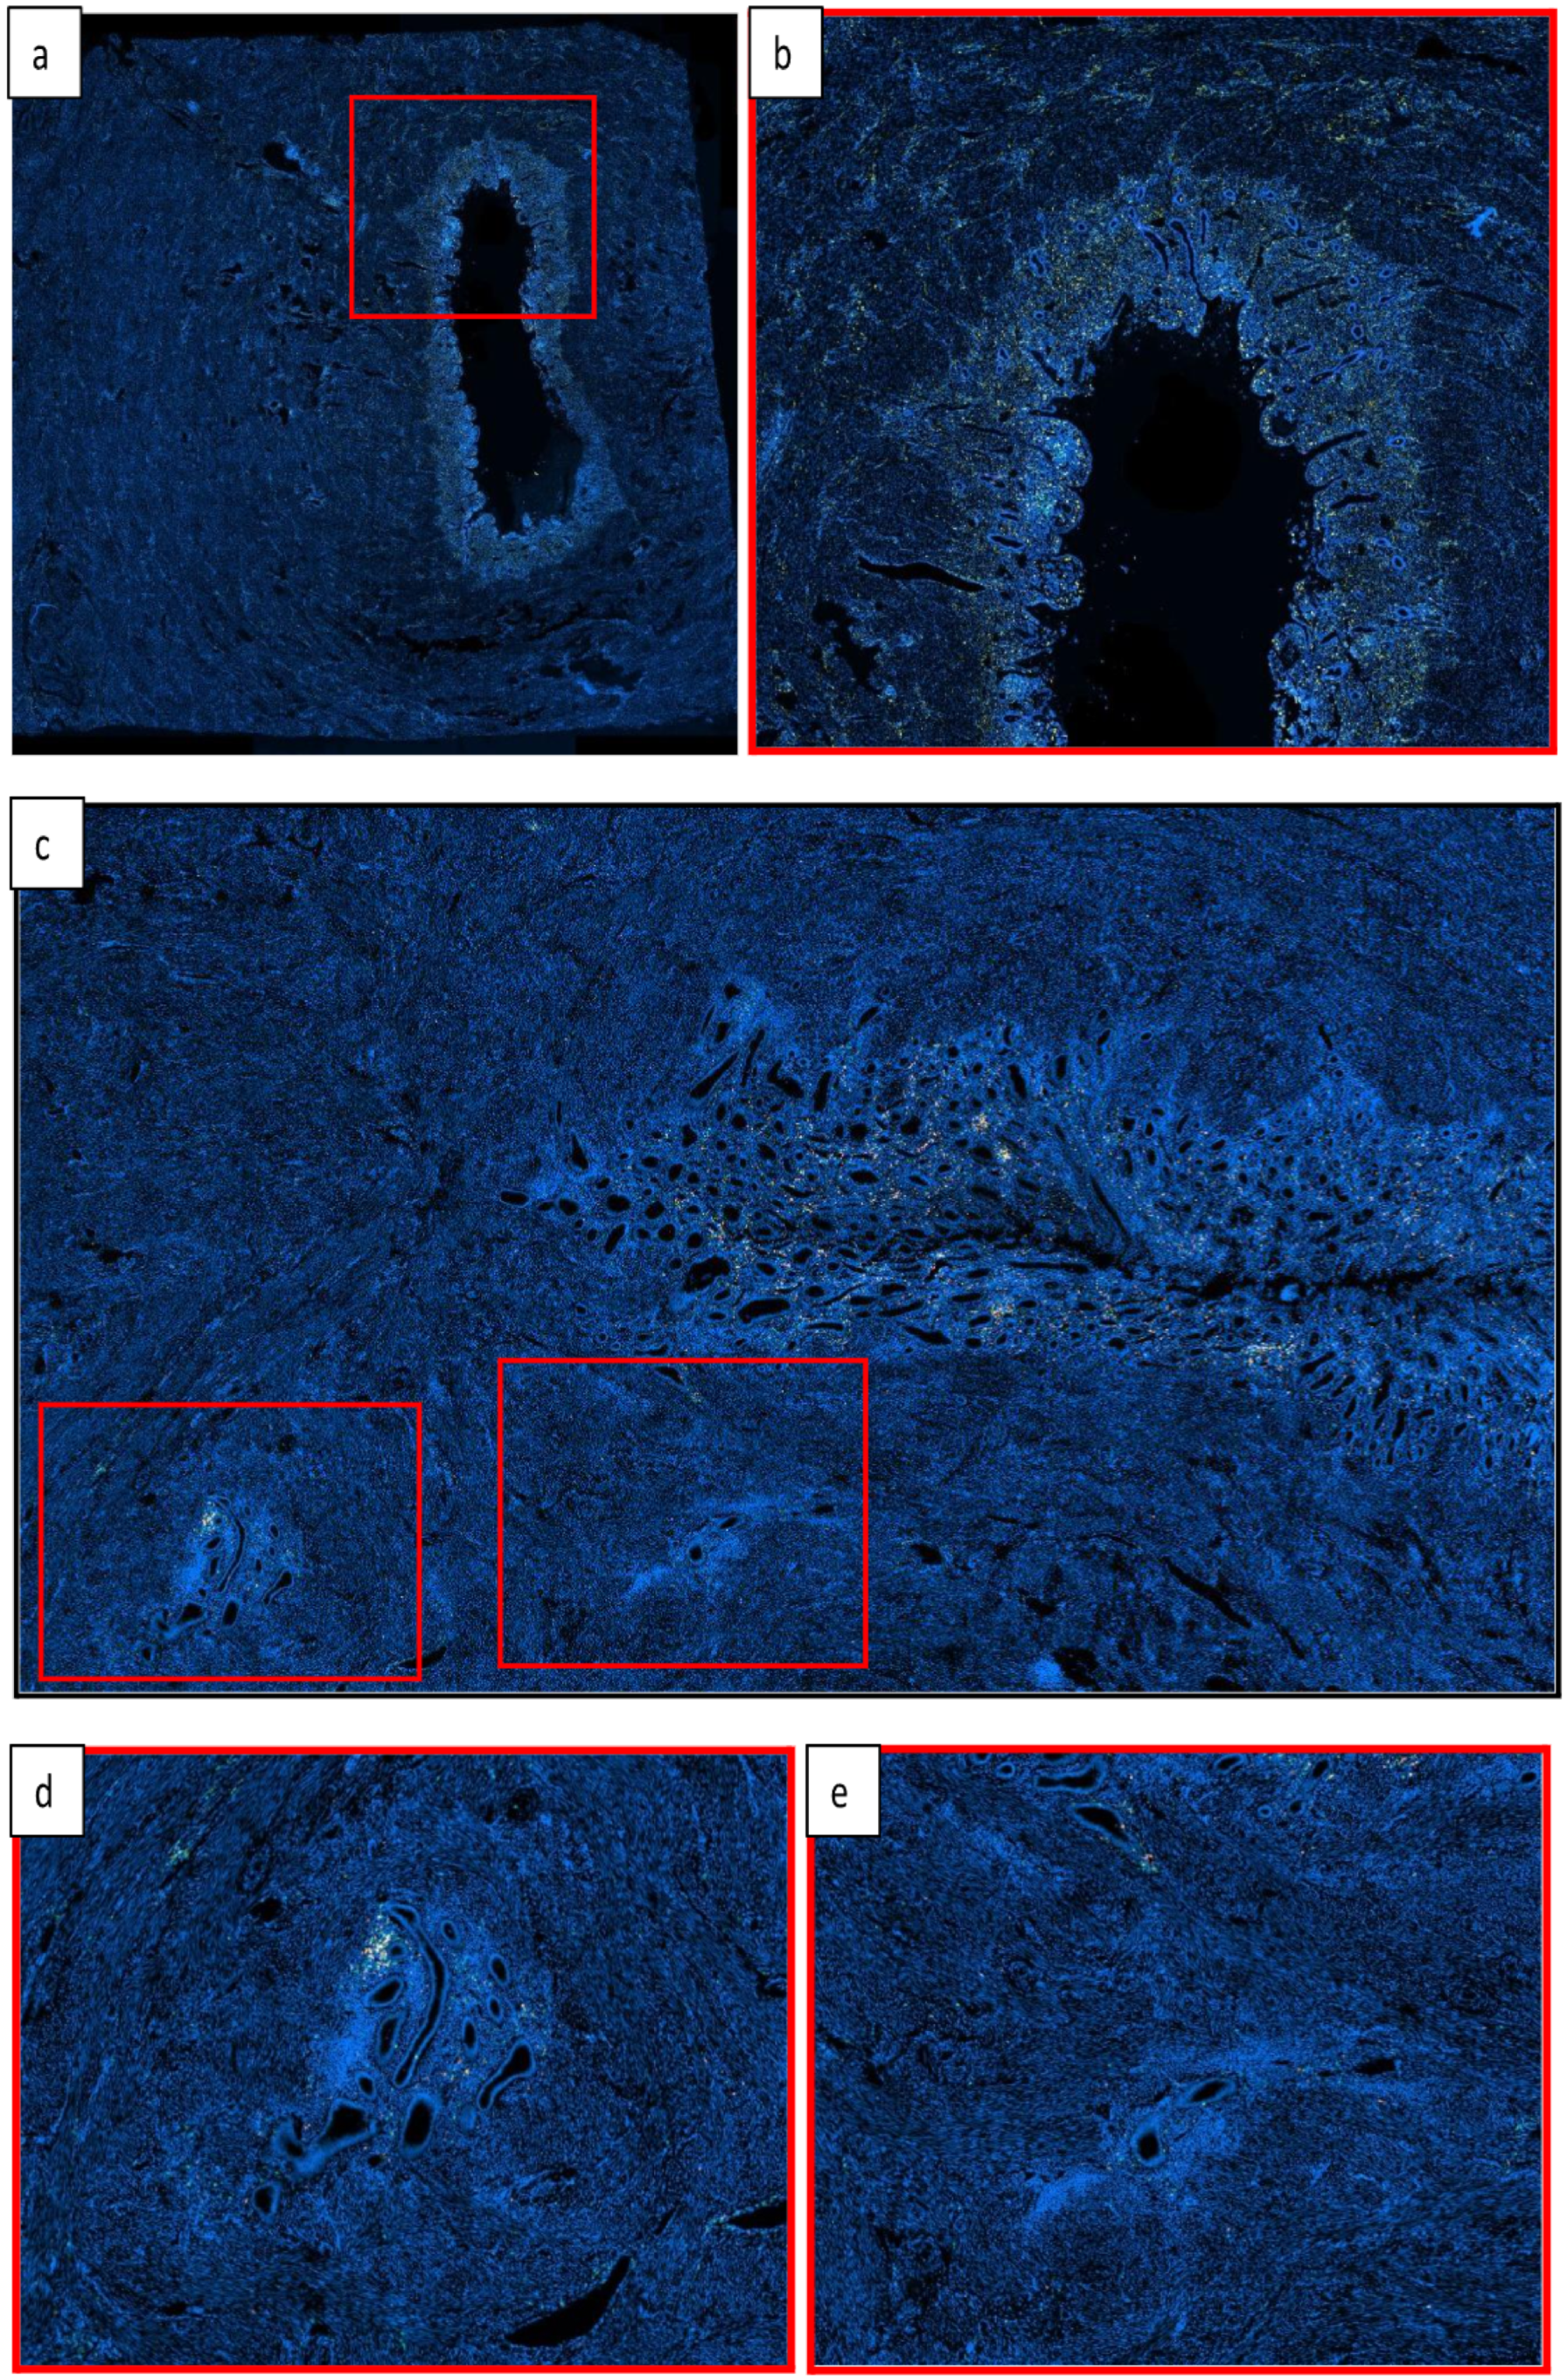
2.3. Immunofluorescence

T cells (panel A, see Appendix A Table A1) and macrophages (panel B, see Appendix A Table A2) were analyzed using a multiplex fluorescence technique based on tyramide amplification with fluorophores, enabling simultaneous detection of various cell subtypes on the same paraffin slide [7].
T cell characterization involved CD3 (T cells), CD8 (cytotoxic T cells), T-bet (type 1 T-helper cells), and GATA-3 (type 2 T-helper cells), alongside NKp46 for natural killer cells detection. For macrophage characterization, CD68 (monocytic cells), CD86 (M1 macrophages), and CD163 (M2 macrophages) were included in the same panel, along with CD1a for dendritic cell identification.
The same procedural steps as for immunohistochemistry were followed, except that the slides were incubated with a fluorochrome–tyramide reagent for 10 min instead of DAB. The sequence was repeated until all antibodies from each panel had been applied. Nuclei were counterstained with Hoechst (10 mg/mL, dilution 1:1000), and a DAKO fluorescence mounting medium was used for slide mounting.
Positive controls included tissue samples known to express the markers of interest, such as appendix for CD15, CD117, CD20, CD3, CD8, T-bet, CD68, CD86, CD163, tonsil for CD1a, lung cancer for NKp46, and placenta for GATA-3. Negative controls consisted of endometrial sections incubated with 1% BSA instead of primary antibodies.
A complete list of antibodies and specific experimental conditions is provided in Appendix A Table A1 and Table A2.

2.4. Analysis

Whole sections were digitized using the Zeiss Axioscan Z1 (Zeiss, Oberkochen, Germany). Analyses were performed using QuPath 0.5.1 software. In the control group, we separated manually the endometrium (called “healthy endometrium”) from the myometrium. In the study group, sections were divided into areas of interest, including eutopic endometrium (called “disease endometrium”), myometrium, adenomyotic lesions, and transitional lesions, as explained further. The endometrium was defined as the continuous glandular surface composed of glands and stromal cells. Adenomyotic lesions were defined as foci of glands and stromal cells invading the myometrium by more than 2.5 mm from the junctional zone. Transitional lesions were characterized as foci separated from eutopic endometrium, but invading the myometrium by less than 2.5 mm (see Figure 1 and Supplementary Materials Figure S1). Areas were manually encircled, and classification was double-checked by two pathologists (see Figure 2). Using the “Cell Detection” tool in the QuPath software, we developed a script to identify individual cells and their corresponding nuclei within areas of interest. Optimization was performed on Hoechst-stained images, with various parameters adjusted—including pixel size, nuclear size, and cell expansion—to achieve a satisfactory balance of sensitivity and specificity (see Supplementary Materials Figure S2). For the detection of cells labeled with specific antibodies, we employed the “Single Measurement Classifier” tool to establish intensity thresholds for each fluorochrome individually. These thresholds were eye-calibrated to distinguish positive cells based on the desired signal intensity (see Supplementary Materials Figure S3). The quantity of inflammatory cells was calculated as the number of stained cells divided by the total number of cells in the area.

2.5. Statistical Analysis

Immune cell populations were quantitatively compared within the endometrium and myometrium, assessing differences between control subjects and patients with endometriosis and adenomyosis. These comparisons were performed using linear models within the limma (version 3.64.0) Bioconductor package. Furthermore, limma was employed to analyze differences in immune cell populations between ectopic lesions and eutopic endometrium within the endometriosis and adenomyosis cohorts. Statistical significance was determined after adjusting p-values using the Benjamini–Hochberg method, with an FDR threshold of 0.10. The threshold of 0.10 was used to refer to adjusted p-values (e.g., after multiple testing corrections) rather than raw p-values. All statistical computations were performed using R (version 4.5.0).

3. Results

3.1. Comparison of Endometrium Between Controls and DISEASE GRoups

In eutopic endometrium, no significant differences were observed in lymphoid lineage immune cell populations between healthy and disease groups. However, within the myeloid lineage, mast cell concentration was significantly decreased in the endometrium of the transitional group compared to healthy controls (logFC = −1.48; adjusted p-value = 0.028) (see Figure 3).

3.2. Comparison of Myometrium Between Controls and Disease Groups

No significant differences were observed in myometrial immune cell populations when comparing disease groups (adenomyosis and transition) to the control group.

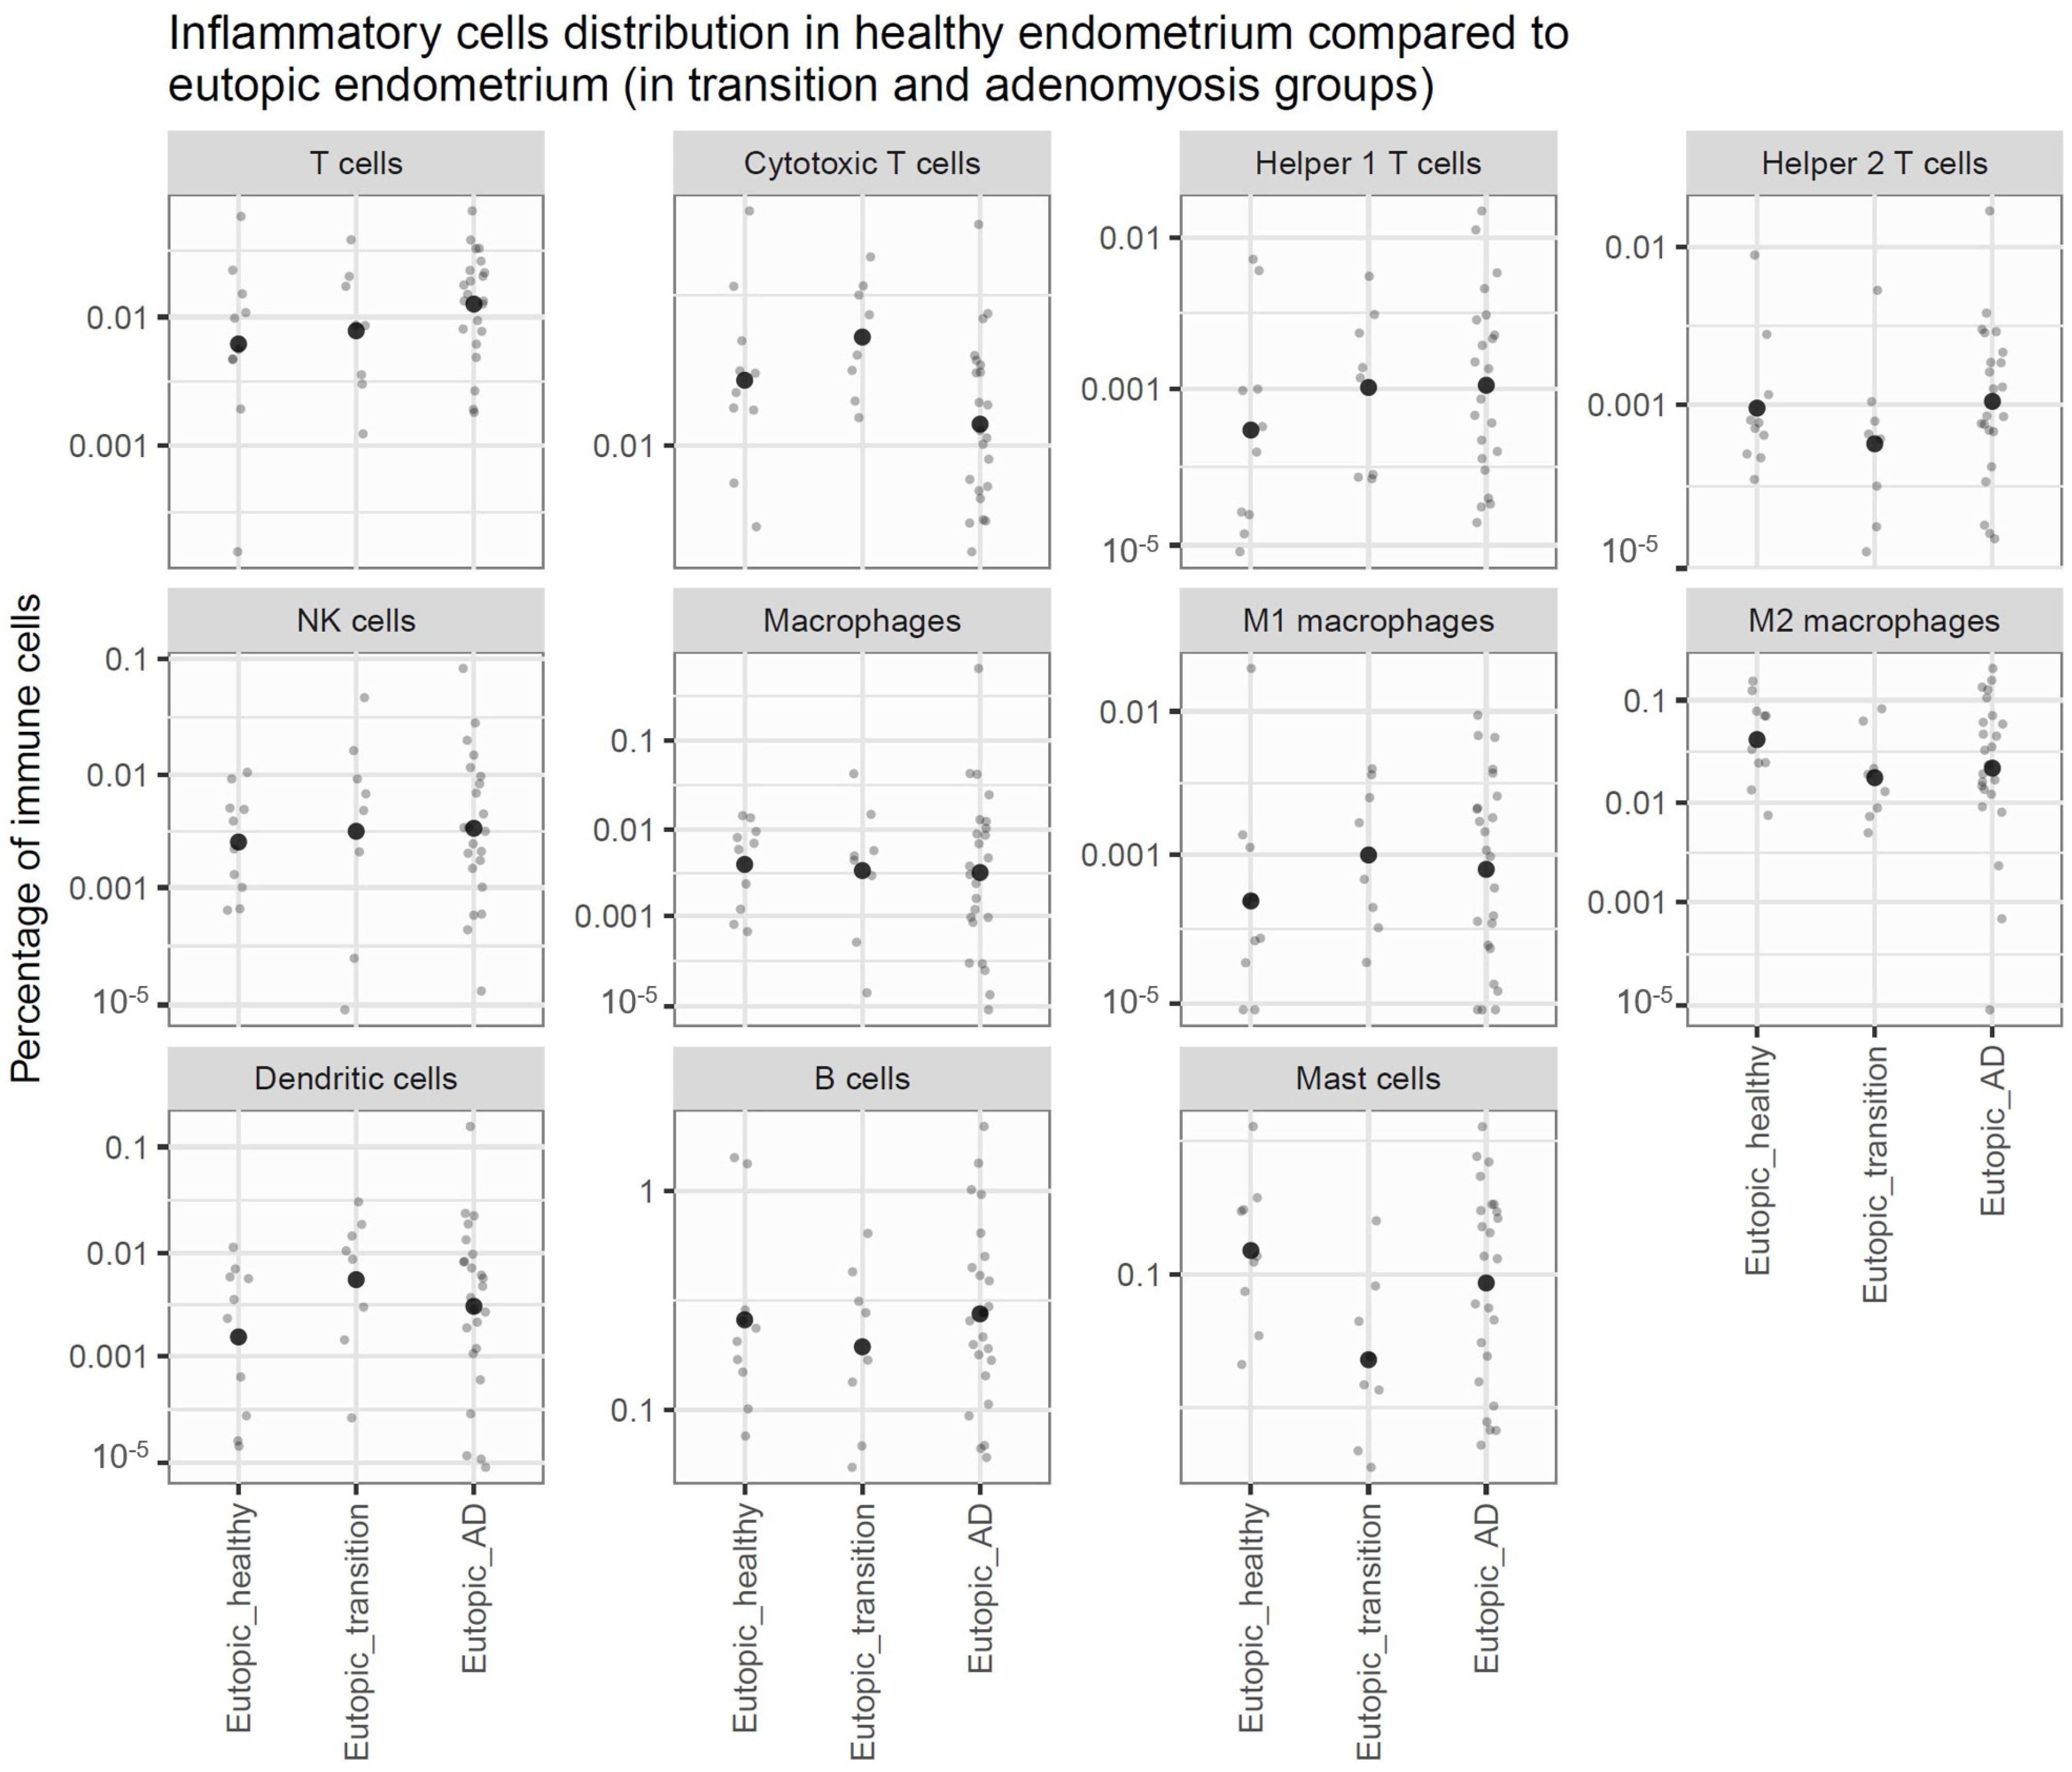
3.3. Comparison of Lesions to Eutopic Endometrium Within Disease Groups

To investigate immune modifications during the development of adenomyosis lesions, we compared immune cell populations between lesions and eutopic endometrium in both disease groups.
In the transitional group, significant modifications were observed between lesions and eutopic endometrium, including a reduced concentration of NK cells, dendritic cells, M1 and M2 macrophages, and helper 1 and 2 T cells. Conversely, mast cells appeared to be increased in the transitional lesions compared to the eutopic endometrium of the same group (logFC = 1.31; adjusted p-value = 0.048) (see Figure 4).
In the adenomyosis group, significant modifications were observed between lesions and eutopic endometrium, including a reduced concentration of T cells, NK cells, dendritic cells, M1 and M2 macrophages, B cells, and Helper 2 T cells (see Figure 4).

3.4. Phases of the Menstrual Cycle

All the analyses were performed with the phases merged. Indeed, when studying the interaction effect of the phases, it appears to not add information to the distribution of the immune cells.

4. Discussion

The identification of transitional lesions sheds light on their critical role and particularly the impact of mast cells on adenomyosis development. Mast cells may act as key facilitators by releasing inflammatory mediators like prostaglandins and cytokines, which promote tissue invasion through remodeling of uterine tissue, as has been demonstrated in endometriosis [8]. Furthermore, their secretion of vascular endothelial growth factor may contribute to enhanced angiogenesis, creating a supportive environment for the progression of adenomyotic lesions. As is well known, mast cells mediate neurogenic inflammation and pain. Anaf et al. identified an increased number of activated mast cells near the endometriosis lesions, located close to the nerve fibers [9]. Che et al. showed that activated mast cells may play a role in the pathogenesis of adenomyosis and particularly adenomyosis-related dysmenorrhea. In their study, the use of a drug that inhibits mast cell activation and suppresses mast cell degranulation (Mifepristone) relieved the dysmenorrhea symptom of adenomyosis patients by inhibiting the infiltration and the activity of degranulation of mast cells in eutopic and ectopic endometria [10].
Transitional lesions also underscore the dynamic nature of adenomyosis development, consistent with the TIAR mechanism’s emphasis on chronic injury and repair processes driving the condition’s progression [11]. These lesions likely form in original sites of microtrauma and repair, reflecting early invagination and supporting the hypothesis that adenomyosis develops progressively as a continuum rather than a binary condition.

5. Conclusions

Immunohistochemistry and immunofluorescence staining revealed a significantly reduced inflammatory infiltrate in both transitional and adenomyotic lesions compared to eutopic endometrium. This decline was observed across several immune cell types, including T cells, NK cells, B cells, macrophages, and dendritic cells. By contrast, mast cells appeared to be increased in transitional lesions compared to eutopic endometrium and adenomyotic lesions. No significant differences were noted in inflammatory cell populations of eutopic endometrium and myometrium between patients and healthy controls.
Our findings emphasize the need for further exploration of immune cell interactions, particularly within transitional lesions, to better understand the mechanisms underlying tissue invasion and immune evasion. Insights into these processes could provide valuable targets for early therapeutic interventions in adenomyosis.

Supplementary Materials

The following supporting information can be downloaded at https://www.mdpi.com/article/10.3390/jcm14134578/s1, Figure S1: Microscopic comparison of healthy and adenomyotic uteri; Figure S2: Cell detection tool; Figure S3: Single measurement classifier.

Author Contributions

Conceptualization, A.C. and E.W.; methodology, E.W.; validation, A.C., M.-M.D. and J.D.; formal analysis, E.W. and J.A.; resources, A.C.; data curation, E.W. and J.A.; writing—original draft preparation, E.W.; writing—review and editing, A.C., M.-M.D., J.A. and J.D.; supervision, A.C., M.-M.D. and J.D.; funding acquisition, A.C. All authors have read and agreed to the published version of the manuscript.

Funding

This study was supported by grants from the Fondation Saint-Luc awarded to E.W., A.C., and M.-M.D., and funds from the Fonds National de la Recherche Scientifique de Belgique (FNRS) (PDR T.0171.21 to A.C.).

Institutional Review Board Statement

The study was conducted in accordance with the Declaration of Helsinki, and approved by the Ethics Committee of the Cliniques Universitaires Saint-Luc (CUSL) and Université Catholique de Louvain on 31 August 2020 (ref: 2020/14AOU/410).

Informed Consent Statement

Informed consent from patients was not asked since the study was carried out with residual material from the archives of the Cliniques Universitaires Saint-Luc (CUSL).

Data Availability Statement

Data supporting reported results will be made available to the editors of the journal pre- and/or post-publication for review or query upon request.

Acknowledgments

The authors thank Mira Hryniuk for reviewing the English language of the manuscript, and Deborah Godefroidt for her administrative assistance.

Conflicts of Interest

The authors declare no conflicts of interest.

Appendix A

Table A1. Panel A.
Table A1. Panel A.
Primary AntibodyDilutionAntigen RetrievalSecondary AntibodyFluorochromePanel Position
GATA-3
(CST (Danvers, MA, USA) D13C9)
1/800Citrate (pH 6)Anti-rabbitCF7541
NKp46
(Abcam (Cambridge, UK) EPR22403-57)
1/100Citrate (pH 6)Anti-rabbitCF5552
T-bet
(CST D6N8B)
1/300EDTA (pH 9)Anti-rabbitAF5943
CD8
(Dako clone C8/144B)
1/25EDTA (pH 9)Anti-mouseCF4884
CD3
(Invitrogen (Waltham, MA, USA) clone SP7)
1/150Citrate (pH 6)Anti-mouseCF6475
Table A2. Panel B.
Table A2. Panel B.
Primary AntibodyDilutionAntigen RetrievalSecondary AntibodyFluorochromePanel Position
CD86
(Abcam E2G8P)
1/100EDTA (pH 9)Anti-rabbitCF4881
CD1a
(Agilent clone 010)
1/50EDTA (pH 9)Anti-mouseCF7542
CD163
(Sanbio Mob460-05)
1/40Citrate (pH 6)Anti-mouseCF5553
CD68
(Abcam ab955)
1/100Citrate (pH 6)Anti-mouseCF6474
Fluorochromes: Alexa Fluor Tyramide Reagent (Invitrogen): diluted 200-fold in borate buffer. CF Tyramide Reagent (ThermoFischer (Waltham, MA, USA)): diluted 1000-fold in borate buffer.

References

  1. Camboni, A.; Marbaix, E. Ectopic Endometrium: The Pathologist’s Perspective. Int. J. Mol. Sci. 2021, 22, 10974. [Google Scholar] [CrossRef] [PubMed]
  2. Stratopoulou, C.A.; Donnez, J.; Dolmans, M.-M. Origin and Pathogenic Mechanisms of Uterine Adenomyosis: What Is Known So Far. Reprod. Sci. 2021, 28, 2087–2097. [Google Scholar] [CrossRef] [PubMed]
  3. García-Solares, J.; Donnez, J.; Donnez, O.; Dolmans, M.-M. Pathogenesis of Uterine Adenomyosis: Invagination or Metaplasia? Fertil. Steril. 2018, 109, 371–379. [Google Scholar] [CrossRef] [PubMed]
  4. Maclean, A.; Barzilova, V.; Patel, S.; Bates, F.; Hapangama, D.K. Characterising the Immune Cell Phenotype of Ectopic Adenomyosis Lesions Compared with Eutopic Endometrium: A Systematic Review. J. Reprod. Immunol. 2023, 157, 103925. [Google Scholar] [CrossRef] [PubMed]
  5. Bourdon, M.; Santulli, P.; Jeljeli, M.; Vannuccini, S.; Marcellin, L.; Doridot, L.; Petraglia, F.; Batteux, F.; Chapron, C. Immunological Changes Associated with Adenomyosis: A Systematic Review. Human Reprod. Update 2021, 27, 108–129. [Google Scholar] [CrossRef] [PubMed]
  6. Bazot, M.; Daraï, E. Role of transvaginal sonography and magnetic resonance imaging in the diagnosis of uterine adenomyosis. Fertil. Steril. 2018, 109, 389–397. [Google Scholar] [CrossRef] [PubMed]
  7. Huyghe, N.; Benidovskaya, E.; Beyaert, S.; Daumerie, A.; Maestre Osorio, F.; Aboubakar Nana, F.; Bouzin, C.; Van den Eynde, M. Multiplex Immunofluorescence Combined with Spatial Image Analysis for the Clinical and Biological Assessment of the Tumor Microenvironment. J. Vis. Exp. 2023, 196, e65220. [Google Scholar] [CrossRef] [PubMed]
  8. Binda, M.M.; Donnez, J.; Dolmans, M.-M. Targeting Mast Cells: A New Way to Treat Endometriosis. Expert Opin. Ther. Targets 2017, 21, 67–75. [Google Scholar] [CrossRef] [PubMed]
  9. Anaf, V.; Chapron, C.; El Nakadi, I.; De Moor, V.; Simonart, T.; Noël, J.C. Pain, mast cells, and nerves in peritoneal, ovarian, and deep infiltrating endometriosis. Fertil. Steril. 2006, 86, 1336–1343. [Google Scholar] [CrossRef] [PubMed]
  10. Che, X.; Wang, J.; He, J.; Guo, X.; Li, T.; Zhang, X. The New Application of Mifepristone in the Relief of Adenomyosis-Caused Dysmenorrhea. Int. J. Med. Sci. 2020, 17, 224–233. [Google Scholar] [CrossRef] [PubMed]
  11. Habiba, M.; Benagiano, G.; Guo, S.W. An Appraisal of the Tissue Injury and Repair (TIAR) Theory on the Pathogenesis of Endometriosis and Adenomyosis. Biomolecules 2023, 13, 975. [Google Scholar] [CrossRef] [PubMed]
Figure 1. Microscopic comparison of healthy and adenomyotic uteri. This figure shows immunofluorescence staining with a multiplex technique to identify monocytic cells (a,b) and lymphocytes (c,d,e) on the same slide. (a) Histopathological image of a healthy uterus showing a regular and well-defined endo-myometrial junction (10× magnification). (b) Higher magnification view (20×) highlighting the sharply demarcated endo-myometrial junction in the healthy uterus. (c) Histopathological image of an adenomyotic uterus displaying an irregular and disrupted endo-myometrial junction. (d,e) High-power views of the adenomyotic uterus. These images reveal ectopic endometrial glands and stroma, separated from the eutopic endometrium and surrounded by hyperplastic myometrium. (d) The lesion is located at a depth exceeding 2.5 mm, corresponding to an adenomyotic lesion. The inflammatory infiltrate observed in the lesion appeared to be less dense than that seen in the eutopic endometrium. (e) The lesion is situated below 2.5 mm within the myometrium, classified as a “transitional lesion”. The inflammatory infiltrate observed in the lesion appeared to be less dense than that seen in the eutopic endometrium.
Jcm 14 04578 g001
Figure 2. Isolation of areas of interest in an adenomyotic uterus. Eutopic endometrium showing an irregular and disrupted endo-myometrial junction (pink), myometrium (violet), adenomyotic lesions located > 2.5 mm from the endomyometrial junction (blue), and transitional lesions located < 2.5 mm from the endomyometrial junction (orange).
Jcm 14 04578 g002
Figure 3. Inflammatory cell concentration in healthy endometrium compared to eutopic endometrium (in transitional lesions and adenomyotic groups). Graph showing the concentration of inflammatory cells in different areas studied. Each graph represents a cell type. Each dot represents a patient, and the large spot in the center shows the mean concentration of the group. There are no significant differences observed regarding the lymphoïde lineage. In the myeloïde lineage, we observed a significant decrease in the mast cell concentration in the disease endometrium of the transitional group.
Jcm 14 04578 g003
Figure 4. Inflammatory cell concentration in eutopic endometrium compared to transitional lesions and adenomyotic lesions. Graph showing the concentration of inflammatory cells in different areas studied. Each graph represents a cell type. Each dot represents a patient, and the large spot in the center shows the mean concentration of the group. We observed a general decrease in all immune cell types, except for mast cells, which exhibited increased concentrations in transitional lesions.
Jcm 14 04578 g004
Table 1. Patient characteristics.
PathologyMenstrual PhaseAgeBMIParitySymptoms
AdenomyosisMenstrual4630.1G3P3Menorrhagia and dysmenorrhea
AdenomyosisMenstrual4928.5G3P2Menorrhagia and dysmenorrhea
AdenomyosisMenstrual4337.9G2P2Menorrhagia
AdenomyosisMenstrual42Not foundG4P4Menorrhagia
AdenomyosisMenstrual48Not foundG1P0Menorrhagia
AdenomyosisMenstrual5426.7Not foundNot found
AdenomyosisMenstrual4820.8G1P1Menorrhagia and dysmenorrhea
AdenomyosisMenstrual4421.8G2P2Menorrhagia and dysmenorrhea
AdenomyosisMenstrual5325.4G2P2Menorrhagia and dysmenorrhea
AdenomyosisProliferative4845.0G3P3Menorrhagia and dysmenorrhea
AdenomyosisProliferative4724.8G2P0Not found
AdenomyosisProliferative5031.6Not foundMenorrhagia
AdenomyosisProliferative4628.3G4P4Menorrhagia and dysmenorrhea
AdenomyosisProliferative4230.3G3P3Menorrhagia
AdenomyosisProliferative55Not foundG5P3Not found
AdenomyosisProliferative43Not foundNot foundNot found
AdenomyosisProliferative5130.8G4P3Menorrhagia
AdenomyosisProliferative40Not foundG3P3Menorrhagia and dysmenorrhea
AdenomyosisSecretory47Not foundG2P2Menorrhagia and dysmenorrhea
AdenomyosisSecretory5031.2G4P3Not found
AdenomyosisSecretory4630.5G5P2Menorrhagia and dysmenorrhea
AdenomyosisSecretory3740.1G4P3Menorrhagia and dysmenorrhea
AdenomyosisSecretory4536.3G1P1Menorrhagia
AdenomyosisSecretory4130.6G6P5Menorrhagia and dysmenorrhea
AdenomyosisSecretory45Not foundG2P2Menorrhagia
AdenomyosisSecretory4220.6G4P2Menorrhagia and dysmenorrhea
AdenomyosisSecretory40Not foundG3P2Menorrhagia
LeiomyomaMenstrual3921.1G2P2Not found
LeiomyomaMenstrual4829.0G6P4Not found
LeiomyomaMenstrual4423.7G4P4Not found
LeiomyomaMenstrual3822.6G4P4Not found
LeiomyomaMenstrual42Not foundNot foundMenorrhagia
LeiomyomaProliferative4450.2Not foundNot found
LeiomyomaProliferative4228.7G4P2Not found
ProlapsusProliferative5620.8GXP3Not found
LeiomyomaProliferative3521.1NANot found
LeiomyomaProliferative4939.0G3P2Menorrhagia
LeiomyomaSecretory4124.3G2P2Menorrhagia
LeiomyomaSecretory37Not foundG6P4Menorrhagia and dysmenorrhea
LeiomyomaSecretory47NAG4PXNot found
LeiomyomaSecretory4028.3G3P2Menorrhagia and dysmenorrhea
LeiomyomaSecretory4324.7G3P2Menorrhagia
Disclaimer/Publisher’s Note: The statements, opinions and data contained in all publications are solely those of the individual author(s) and contributor(s) and not of MDPI and/or the editor(s). MDPI and/or the editor(s) disclaim responsibility for any injury to people or property resulting from any ideas, methods, instructions or products referred to in the content.

