

Combining Predictive Models of Mortality and Time-to-Discharge for Improved Outcome Assessment in Intensive Care Units
 , , , ,
  and
and
Abstract
1. Background
2. Methods
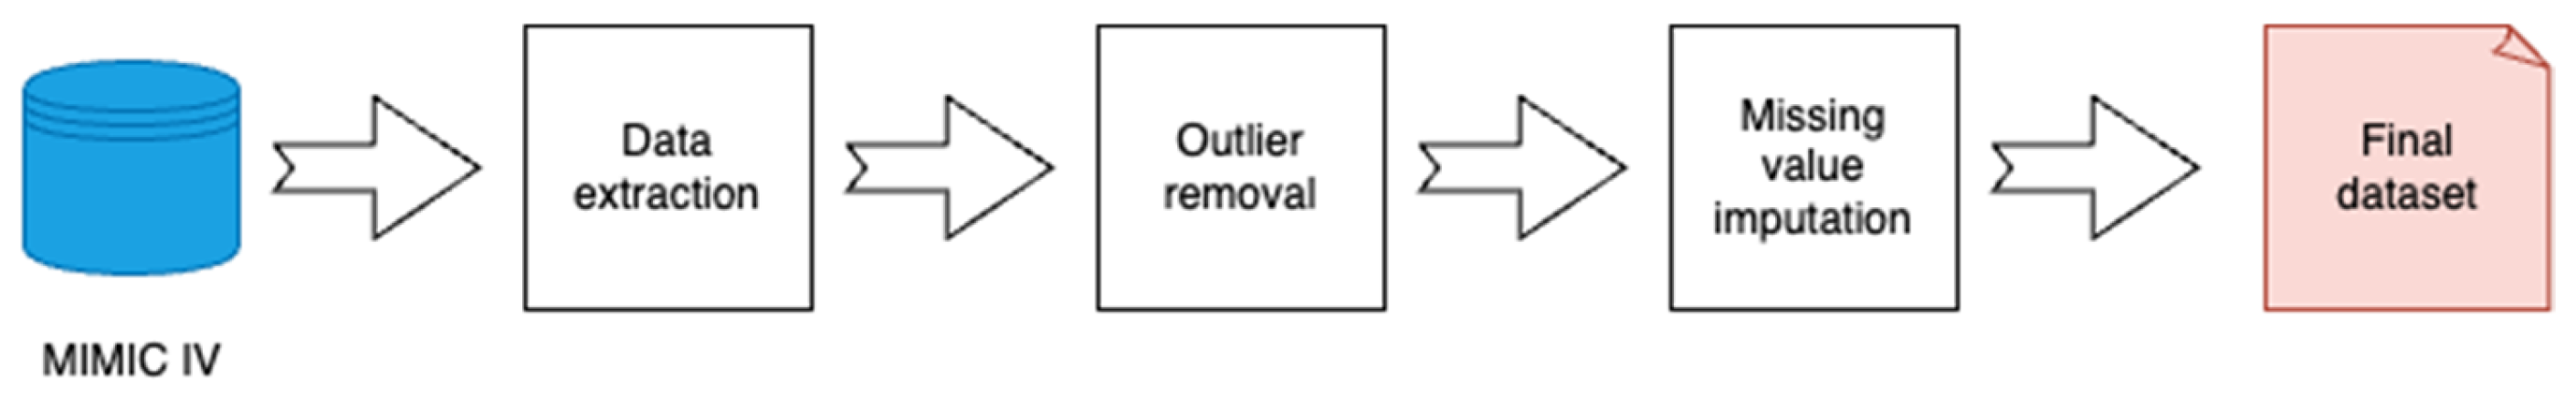
2.1. Data Sources
2.2. Variables and Features
2.3. Libraries Used
- ▪
- Python 3.11.11
- ▪
- joblib == 1.3.2
- ▪
- keras == 3.10.0
- ▪
- matplotlib == 3.8.2
- ▪
- numpy == 1.26.2
- ▪
- pandas == 2.2.3
- ▪
- scikit_learn == 1.4.2
- ▪
- tensorflow == 2.18.0
- ▪
- tqdm == 4.67.1
2.4. Model Development
2.5. Model Training
2.6. Use of Generative AI Tools
3. Results
4. Discussion
5. Conclusions
Supplementary Materials
Author Contributions
Funding
Institutional Review Board Statement
Informed Consent Statement
Data Availability Statement
Acknowledgments
Conflicts of Interest
References
- Johnson, A.E.W.; Mark, R.G. Real-time mortality prediction in the Intensive Care Unit. AMIA Annu. Symp. Proc. 2017, 2017, 994–1003. [Google Scholar] [PubMed]
- Zhao, S.; Tang, G.; Liu, P.; Wang, Q.; Li, G.; Ding, Z. Improving mortality risk prediction with routine clinical data: A practical machine learning model based on eICU patients. Int. J. Gen. Med. 2023, 16, 3151–3161. [Google Scholar] [CrossRef]
- Majhi, B.; Kashyap, A. Wavelet based ensemble models for early mortality prediction using imbalance ICU big data. Smart Health 2023, 28, 100374. [Google Scholar] [CrossRef]
- Jiang, J.; Yu, X.; Wang, B.; Ma, L.; Guan, Y. DECAF: An interpretable deep cascading framework for ICU mortality prediction. Artif. Intell. Med. 2023, 138, 102437. [Google Scholar] [CrossRef]
- Caicedo-Torres, W.; Gutierrez, J. ISeeU: Visually interpretable deep learning for mortality prediction inside the ICU. J. Biomed. Inform. 2019, 98, 103269. [Google Scholar] [CrossRef]
- Liu, M.; Guo, C.; Guo, S. An explainable knowledge distillation method with XGBoost for ICU mortality prediction. Comput. Biol. Med. 2023, 152, 106466. [Google Scholar] [CrossRef]
- Ishii, E.; Nawa, N.; Hashimoto, S.; Shigemitsu, H.; Fujiwara, T. Development, validation, and feature extraction of a deep learning model predicting in-hospital mortality using Japan’s largest national ICU database: A validation framework for transparent clinical Artificial Intelligence (cAI) development. Anaesth. Crit. Care Pain Med. 2023, 42, 101167. [Google Scholar] [CrossRef]
- Thorsen-Meyer, H.C.; Nielsen, A.B.; Nielsen, A.P.; Kaas-Hansen, B.S.; Toft, P.; Schierbeck, J.; Strøm, T.; Chmura, P.J.; Heimann, M.; Dybdahl, L.; et al. Dynamic and explainable machine learning prediction of mortality in patients in the intensive care unit: A retrospective study of high-frequency data in electronic patient records. Lancet Digit. Health 2020, 2, e179–e191. [Google Scholar] [CrossRef]
- Lajevardi-Khosh, A.; Jalali, A.; Rajput, K.S.; Selvaraj, N. Novel Dynamic Prediction of Daily Patient Discharge in Acute and Critical Care. Conf. Proc. IEEE Eng. Med. Biol. Soc. 2021, 2021, 2347–2352. [Google Scholar] [CrossRef]
- Hasan, M.N.; Hamdan, S.; Poudel, S.; Vargas, J.; Poudel, K. Prediction of length-of-stay at intensive care unit (ICU) using machine learning based on MIMIC-III database. In Proceedings of the 2023 IEEE Conference on Artificial Intelligence (CAI), Santa Clara, CA, USA, 5–6 June 2023; IEEE: New York, NY, USA, 2023; pp. 321–323. [Google Scholar] [CrossRef]
- Ma, X.; Si, Y.; Wang, Z.; Wang, Y. Length of stay prediction for ICU patients using individualized single classification algorithm. Comput. Methods Programs Biomed. 2020, 186, 105224. [Google Scholar] [CrossRef]
- Iwase, S.; Nakada, T.A.; Shimada, T.; Oami, T.; Shimazui, T.; Takahashi, N.; Yamabe, J.; Yamao, Y.; Kawakami, E. Prediction algorithm for ICU mortality and length of stay using machine learning. Sci. Rep. 2022, 12, 12912. [Google Scholar] [CrossRef] [PubMed]
- Juraev, F.; El-Sappagh, S.; Abdukhamidov, E.; Ali, F.; Abuhmed, T. Multilayer dynamic ensemble model for intensive care unit mortality prediction of neonate patients. J. Biomed. Inform. 2022, 135, 104216. [Google Scholar] [CrossRef] [PubMed]
- Al-Dailami, A.; Kuang, H.; Wang, J. Predicting length of stay in ICU and mortality with temporal dilated separable convolutionand context-aware feature fusion. Comput. Biol. Med. 2022, 151, 106278. [Google Scholar] [CrossRef] [PubMed]
- Lim, L.; Gim, U.; Cho, K.; Yoo, D.; Ryu, H.G.; Lee, H.C. Real-time machine learning model to predict short-term mortality in critically ill patients: Development and international validation. Crit. Care 2024, 28, 76. [Google Scholar] [CrossRef]
- Saadatmand, S.; Salimifard, K.; Mohammadi, R.; Kuiper, A.; Marzban, M.; Farhadi, A. Using machine learning in prediction of ICU admission, mortality, and length of stay in the early stage of admission of COVID-19 patients. Ann. Oper. Res. 2023, 328, 1043–1071. [Google Scholar] [CrossRef]
- Alghatani, K.; Ammar, N.; Rezgui, A.; Shaban-Nejad, A. Predicting Intensive Care Unit Length of Stay and Mortality Using Patient Vital Signs: Machine Learning Model Development and Validation. JMIR Med. Inform. 2021, 9, e21347. [Google Scholar] [CrossRef]
- Pianykh, O.S.; Guitron, S.; Parke, D.; Zhang, C.; Pandharipande, P.; Brink, J.; Rosenthal, D. Improving healthcare operations management with machine learning. Nat. Mach. Intell. 2020, 2, 266–273. [Google Scholar] [CrossRef]
- Wei, J.; Zhou, J.; Zhang, Z.; Yuan, K.; Gu, Q.; Luk, A.; Brent, A.J.; Clifton, D.A.; Walker, A.S.; Eyre, D.W. Predicting individual patient and hospital-level discharge using machine learning. Commun. Med. 2024, 4, 236. [Google Scholar] [CrossRef]
- Cho, Y.S.; Hong, P.C. Applying machine learning to healthcare operations management: CNN-based model for malaria diagnosis. Healthcare 2023, 11, 1779. [Google Scholar] [CrossRef]
- Han, Y.; Li, Y.; Li, Y.; Yang, B.; Cao, L. Digital twinning for smart hospital operations: Framework and proof of concept. Technol. Soc. 2023, 74, 102317. [Google Scholar] [CrossRef]
- Zimmerman, J.E.; Kramer, A.A.; McNair, D.S.; Malila, F.M. Acute Physiology and Chronic Health Evaluation (APACHE) IV: Hospital mortality assessment for today’s critically ill patients. Crit. Care Med. 2006, 34, 1297–1310. [Google Scholar] [CrossRef]
- Le Gall, J.R.; Lemeshow, S.; Saulnier, F. A new Simplified Acute Physiology Score (SAPS II) based on a European/North American multicenter study. JAMA 1993, 270, 2957–2963. [Google Scholar] [CrossRef] [PubMed]
- Johnson, A.E.W.; Kramer, A.A.; Clifford, G.D. A new severity of illness scale using a subset of Acute Physiology And Chronic Health Evaluation data elements shows comparable predictive accuracy. Crit. Care Med. 2013, 41, 1711–1718. [Google Scholar] [CrossRef] [PubMed]
- Johnson, A.E.W.; Bulgarelli, L.; Shen, L.; Gayles, A.; Shammout, A.; Horng, S.; Pollard, T.J.; Hao, S.; Moody, B.; Gow, B.; et al. MIMIC-IV, a freely accessible electronic health record dataset. Sci. Data 2023, 10, 1. [Google Scholar] [CrossRef] [PubMed]
- Goldberger, A.L.; Amaral, L.A.; Glass, L.; Hausdorff, J.M.; Ivanov, P.C.; Mark, R.G.; Mietus, J.E.; Moody, G.B.; Peng, C.K.; Stanley, H.E. PhysioBank, PhysioToolkit, and PhysioNet: Components of a new research resource for complex physiologic signals. Circulation 2000, 101, E215–E220. [Google Scholar] [CrossRef]
- Charlson, M.E.; Pompei, P.; Ales, K.L.; MacKenzie, C.R. A new method of classifying prognostic comorbidity in longitudinal studies: Development and validation. J. Chronic Dis. 1987, 40, 373–383. [Google Scholar] [CrossRef]
- Hochreiter, S.; Schmidhuber, J. Long short-term memory. Neural Comput. 1997, 9, 1735–1780. [Google Scholar] [CrossRef]
- Zeng, G.; Zhuang, J.; Huang, H.; Tian, M.; Gao, Y.; Liu, Y.; Yu, X. Use of deep learning for continuous prediction of mortality for all admissions in intensive care units. Tsinghua Sci. Technol. 2023, 28, 639–648. [Google Scholar] [CrossRef]
- Matheny, M.E.; Goldsack, J.C.; Saria, S.; Shah, N.H.; Gerhart, J.; Cohen, I.G.; Price, W.N.; Patel, B.; Payne, P.R.O.; Embí, P.J.; et al. Artificial Intelligence In Health And Health Care: Priorities For Action. Health Affairs 2025, 44, 163–170. [Google Scholar] [CrossRef] [PubMed]
- Wardi, G.; Owens, R.; Josef, C.; Malhotra, A.; Longhurst, C.; Nemati, S. Bringing the Promise of Artificial Intelligence to Critical Care: What the Experience With Sepsis Analytics Can Teach Us. Crit. Care Med. 2023, 51, 985–991. [Google Scholar] [CrossRef]
- Shickel, B.; Tighe, P.J.; Bihorac, A.; Rashidi, P. Deep EHR: A survey of recent advances in deep learning techniques for electronic health record (EHR) analysis. IEEE J. Biomed. Health Inform. 2018, 22, 1589–1604. [Google Scholar] [CrossRef]
- Rajkomar, A.; Oren, E.; Chen, K.; Dai, A.M.; Hajaj, N.; Hardt, M.; Liu, P.J.; Liu, X.; Marcus, J.; Sun, M.; et al. Scalable and accurate deep learning with electronic health records. NPJ Digit. Med. 2018, 1, 18. [Google Scholar] [CrossRef] [PubMed]
- Li, S.; Li, X.; Yu, K.; Miao, D.; Zhu, M.; Yan, M.; Ke, Y.; D’Agostino, D.; Ning, Y.; Wu, Q.; et al. Bridging data gaps in healthcare: A scoping review of transfer learning in biomedical data analysis. arXiv 2024, arXiv:2407.11034. [Google Scholar]
- Rieke, N.; Hancox, J.; Li, W.; Milletarì, F.; Roth, H.R.; Albarqouni, S.; Bakas, S.; Galtier, M.N.; Landman, B.A.; Maier-Hein, K.; et al. The future of digital health with federated learning. NPJ Digit. Med. 2020, 3, 119. [Google Scholar] [CrossRef]
- Miotto, R.; Wang, F.; Wang, S.; Jiang, X.; Dudley, J.T. Deep learning for healthcare: Review, opportunities and challenges. Brief. Bioinform. 2018, 19, 1236–1246. [Google Scholar] [CrossRef] [PubMed]


| Missing Value Imputation | Outlier Removal | Outlier Removal Result | ||||||
|---|---|---|---|---|---|---|---|---|
| Variable | Unit | Method | Physiological Range | Mean | Std | |||
| Min | Max | Before | After | Before | After | |||
| Epinephrine rate | mcg/kg/min | Zero | 0 | 10 | 0.060 | 0.060 | 0.148 | 0.148 |
| Norepinephrine rate | mcg/kg/min | Zero | 0 | 5 | 0.128 | 0.128 | 0.136 | 0.128 |
| Dopamine rate | mcg/kg/min | Zero | 0 | 50 | 6.335 | 6.140 | 15.125 | 4.342 |
| Dobutamine rate | mcg/kg/min | Zero | 0 | 40 | 4.550 | 4.550 | 2.529 | 2.529 |
| Mean blood pressure (min. value) | mmHg | Last known value | 10 | 150 | 78.744 | 78.707 | 15.711 | 15.441 |
| PaO2/FiO2 Ratio (non-ventilated) | mmHg | Zero | 50 | 600 | 248.921 | 247.347 | 113.810 | 105.835 |
| PaO2/FiO2 Ratio (ventilated) | mmHg | Zero | 50 | 600 | 248.711 | 244.400 | 134.976 | 114.530 |
| Bilirubin (max. value) | mg/dL | Last known value | 0.1 | 70 | 3.880 | 3.878 | 7.176 | 7.163 |
| Creatinine (max. value) | mg/dL | Last known value | 0.2 | 20 | 1.574 | 1.574 | 1.513 | 1.502 |
| Platelets (min. value) | K/uL | Last known value | 5.0 | 2000 | 202.572 | 202.570 | 134.076 | 134.047 |
| Glasgow coma score | -- | Last known value | -- | -- | 14.32 | 1.71 | 14.32 | 1.71 |
| Admission age | years | -- | -- | -- | 63.86 | 16.16 | 63.86 | 16.16 |
| Admission type | -- | -- | -- | -- | -- | -- | -- | -- |
| Charlson comorbidity index | -- | -- | -- | -- | 5.89 | 2.98 | 5.89 | 2.98 |
| Groundtruth | |||||
|---|---|---|---|---|---|
| Alive <= 48 h | Alive > 48 h | Dead <= 48 h | Dead > 48 h | ||
| Prediction | Alive <= 48 h | 0 | 1 | 2 | 3 |
| Alive > 48 h | 1 | 0 | 1 | 2 | |
| Dead <= 48 h | 2 | 1 | 0 | 1 | |
| Dead > 48 h | 3 | 2 | 1 | 0 | |
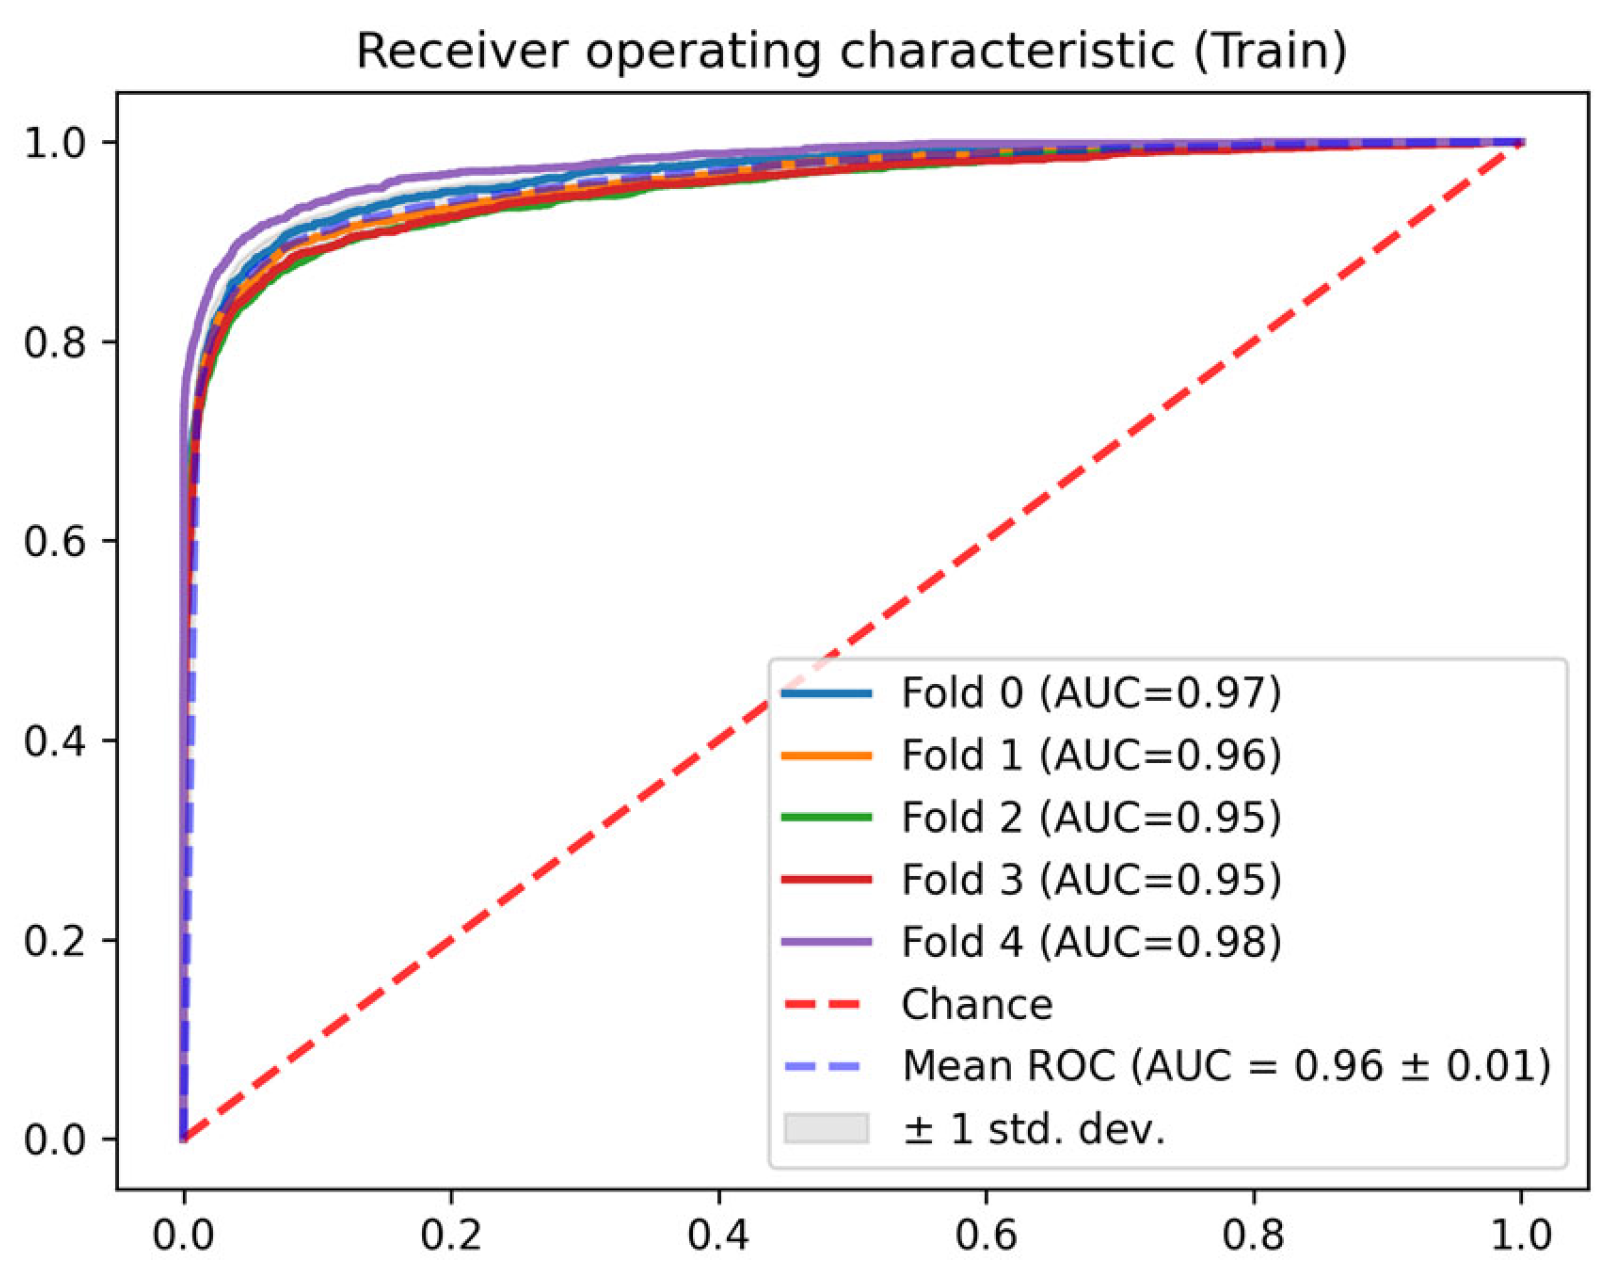
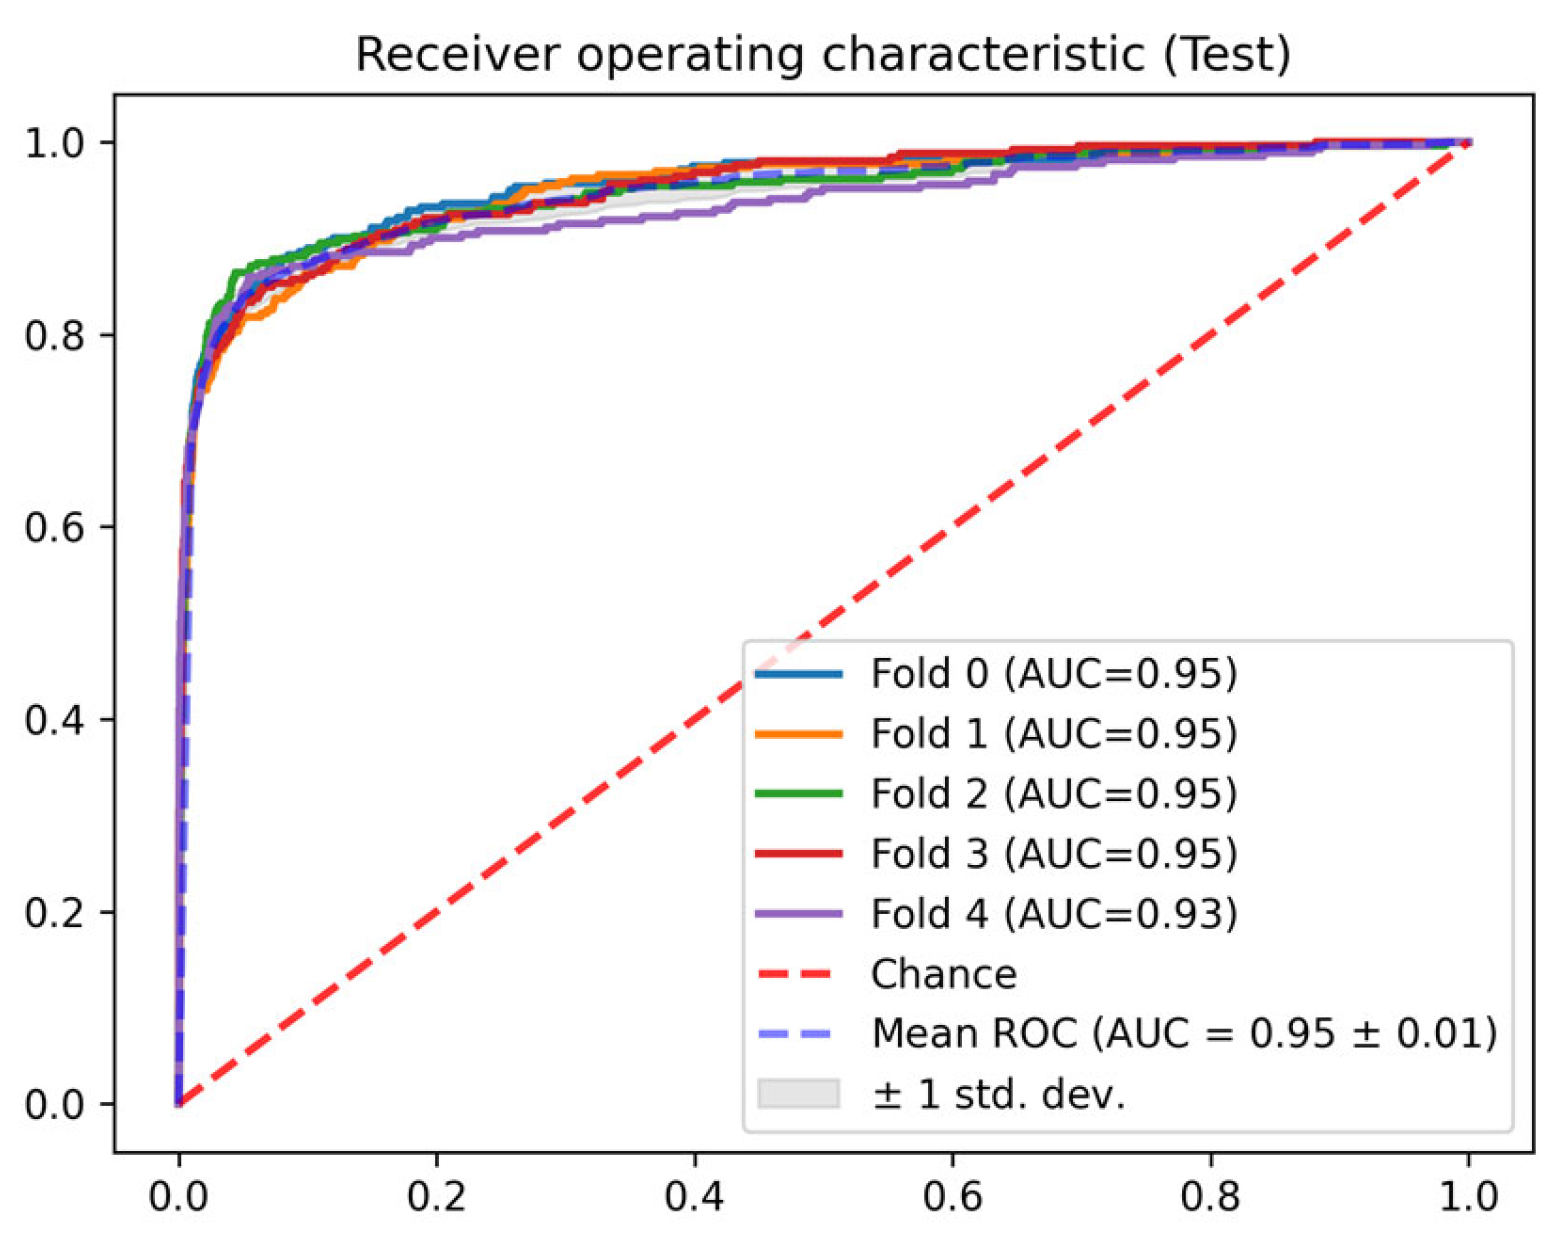
| Fold | AUC ROC | Precision | Recall | F1-Score | Accuracy | Brier Score | |
|---|---|---|---|---|---|---|---|
| Train | 0 | 0.968 | 0.765 | 0.987 | 0.784 | 0.972 | 0.039 |
| 1 | 0.961 | 0.770 | 0.985 | 0.781 | 0.971 | 0.043 | |
| 2 | 0.953 | 0.730 | 0.988 | 0.772 | 0.971 | 0.049 | |
| 3 | 0.953 | 0.735 | 0.988 | 0.773 | 0.971 | 0.055 | |
| 4 | 0.979 | 0.763 | 0.998 | 0.850 | 0.982 | 0.029 | |
| Test | 0 | 0.954 | 0.762 | 0.984 | 0.775 | 0.969 | 0.041 |
| 1 | 0.949 | 0.739 | 0.984 | 0.754 | 0.968 | 0.046 | |
| 2 | 0.949 | 0.742 | 0.985 | 0.768 | 0.968 | 0.051 | |
| 3 | 0.951 | 0.694 | 0.990 | 0.754 | 0.972 | 0.055 |
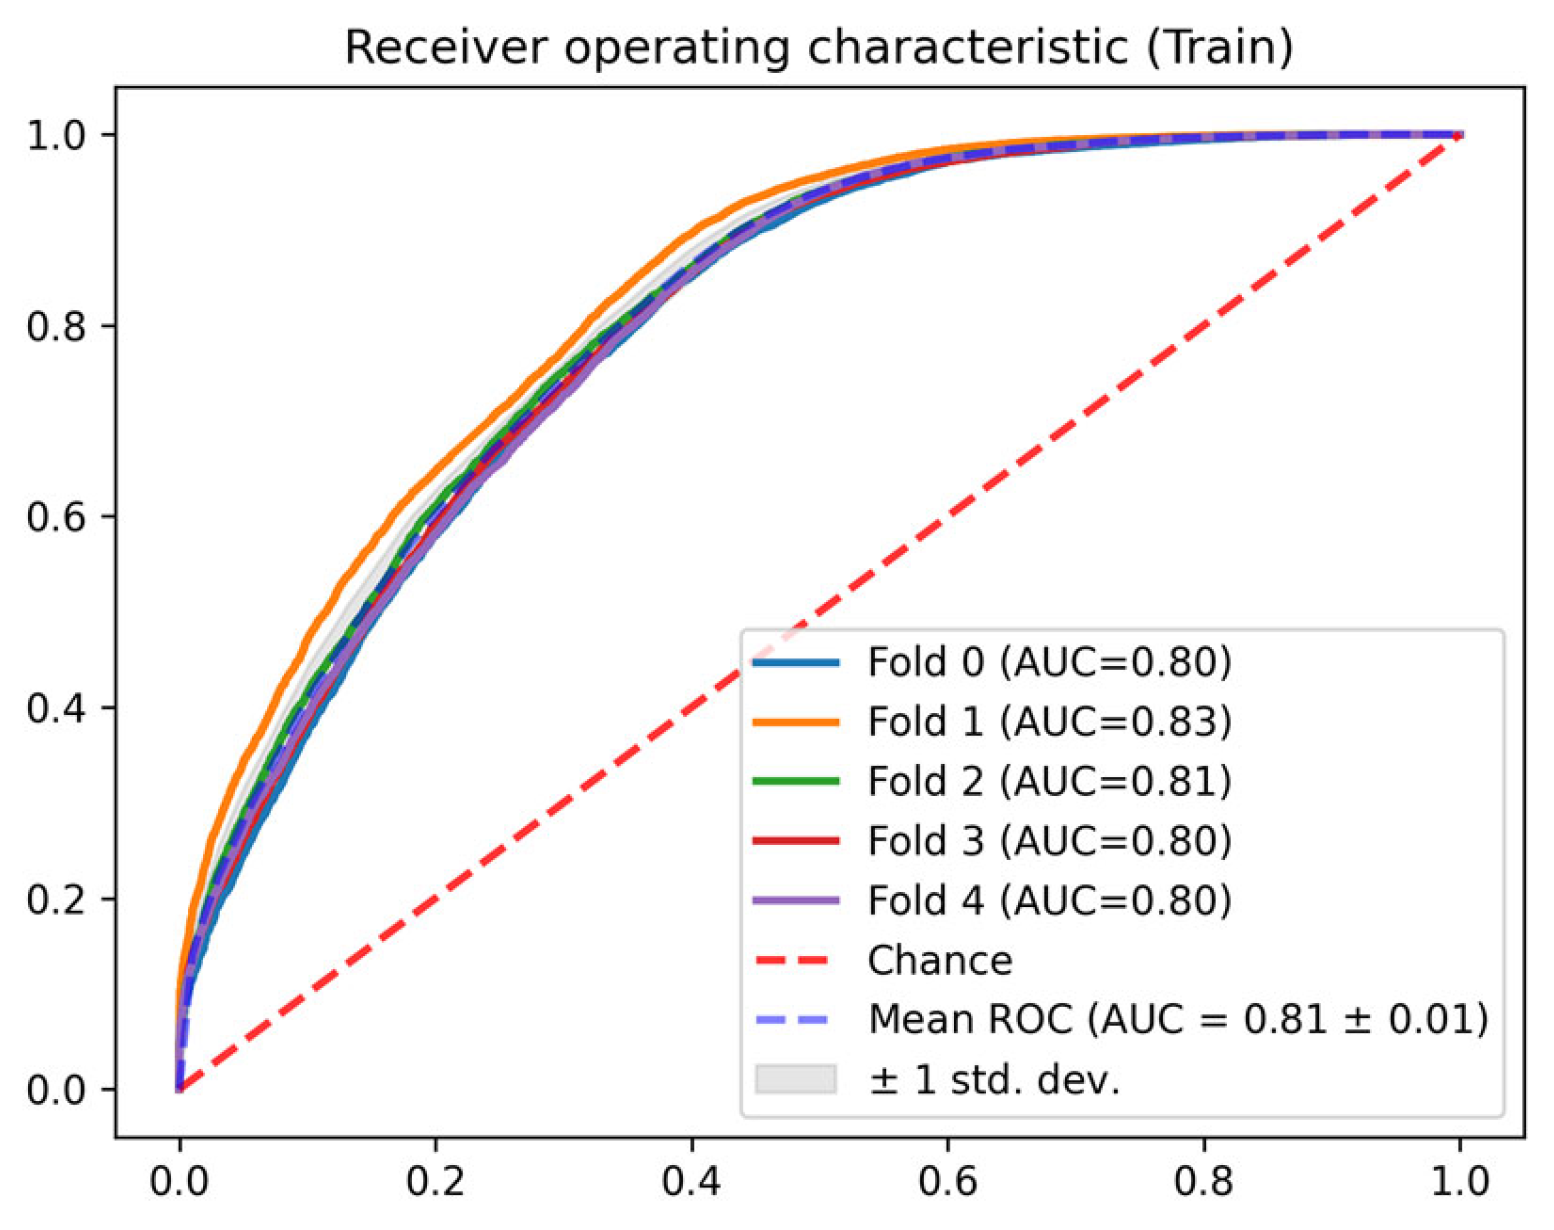
| Fold | AUC ROC | Precision | Recall | F1-Score | Accuracy | Brier Score | |
|---|---|---|---|---|---|---|---|
| Train | 0 | 0.799 | 0.944 | 0.475 | 0.817 | 0.751 | 0.184 |
| 1 | 0.833 | 0.943 | 0.531 | 0.828 | 0.771 | 0.172 | |
| 2 | 0.812 | 0.948 | 0.483 | 0.817 | 0.753 | 0.169 | |
| 3 | 0.804 | 0.937 | 0.499 | 0.815 | 0.753 | 0.173 | |
| 4 | 0.804 | 0.944 | 0.491 | 0.817 | 0.755 | 0.178 | |
| Test | 0 | 0.710 | 0.894 | 0.401 | 0.772 | 0.691 | 0.227 |
| 1 | 0.690 | 0.883 | 0.410 | 0.770 | 0.689 | 0.237 | |
| 2 | 0.726 | 0.902 | 0.449 | 0.788 | 0.715 | 0.209 | |
| 3 | 0.739 | 0.884 | 0.460 | 0.793 | 0.719 | 0.206 |
| LOS (h) | APS III | OASIS | SAPS II | LSTM 12 h Before Discharge |
|---|---|---|---|---|
| (0, 24] | 63.48% | 60.84% | 77.13% | |
| (24, 36] | 68.17% | 65.54% | 82.62% | |
| (36, 48] | 64.92% | 63.41% | 76.04% | |
| (48, 60] | 65.40% | 60.42% | 69.31% | 75.94% |
| (60, 72] | 64.49% | 59.97% | 69.02% | 72.31% |
| (72, 84] | 64.19% | 60.01% | 64.94% | 70.07% |
| (84, 96] | 66.46% | 60.67% | 64.59% | 74.16% |
| (96, 108] | 64.10% | 58.28% | 64.31% | 78.46% |
| (108, 120] | 65.39% | 59.25% | 65.08% | 78.74% |
| [120, inf) | 63.08% | 59.65% | 61.40% | 75.53% |
Disclaimer/Publisher’s Note: The statements, opinions and data contained in all publications are solely those of the individual author(s) and contributor(s) and not of MDPI and/or the editor(s). MDPI and/or the editor(s) disclaim responsibility for any injury to people or property resulting from any ideas, methods, instructions or products referred to in the content. |
© 2025 by the authors. Licensee MDPI, Basel, Switzerland. This article is an open access article distributed under the terms and conditions of the Creative Commons Attribution (CC BY) license (https://creativecommons.org/licenses/by/4.0/).
Share and Cite
Pardo, À.; Gómez, J.; Berrueta, J.; García, A.; Manrique, S.; Rodríguez, A.; Bodí, M. Combining Predictive Models of Mortality and Time-to-Discharge for Improved Outcome Assessment in Intensive Care Units. J. Clin. Med. 2025, 14, 4515. https://doi.org/10.3390/jcm14134515
Pardo À, Gómez J, Berrueta J, García A, Manrique S, Rodríguez A, Bodí M. Combining Predictive Models of Mortality and Time-to-Discharge for Improved Outcome Assessment in Intensive Care Units. Journal of Clinical Medicine. 2025; 14(13):4515. https://doi.org/10.3390/jcm14134515
Chicago/Turabian StylePardo, Àlex, Josep Gómez, Julen Berrueta, Alejandro García, Sara Manrique, Alejandro Rodríguez, and María Bodí. 2025. "Combining Predictive Models of Mortality and Time-to-Discharge for Improved Outcome Assessment in Intensive Care Units" Journal of Clinical Medicine 14, no. 13: 4515. https://doi.org/10.3390/jcm14134515
APA StylePardo, À., Gómez, J., Berrueta, J., García, A., Manrique, S., Rodríguez, A., & Bodí, M. (2025). Combining Predictive Models of Mortality and Time-to-Discharge for Improved Outcome Assessment in Intensive Care Units. Journal of Clinical Medicine, 14(13), 4515. https://doi.org/10.3390/jcm14134515