
Heart Failure, Kidney Function, and Elderly Age, Rather than Levofloxacin Therapy, Are Associated with QTc Prolongation in COVID-19 Patients
 ,
,  , ,
, ,
Abstract

1. Introduction
2. Materials and Methods
3. Statistical Analysis
4. Results
4.1. Univariate Analysis
4.2. Multivariate Analysis
4.3. Nonparametric Statistical Analysis
5. Discussion
6. Conclusions
7. Study Limitations
Supplementary Materials
Author Contributions
Funding
Institutional Review Board Statement
Informed Consent Statement
Data Availability Statement
Conflicts of Interest
References
- Wilk-Sledziewska, K.; Sielatycki, P.J.; Uscinska, N.; Bujno, E.; Rosolowski, M.; Kakareko, K.; Sledziewski, R.; Rydzewska-Rosolowska, A.; Hryszko, T.; Zbroch, E. The Impact of Cardiovascular Risk Factors on the Course of COVID-19. J. Clin. Med. 2022, 11, 2250. [Google Scholar] [CrossRef] [PubMed]
- Ssentongo, P.; Ssentongo, A.E.; Heilbrunn, E.S.; Ba, D.M.; Chinchilli, V.M. Association of cardiovascular disease and 10 other pre-existing comorbidities with COVID-19 mortality: A systematic review and meta-analysis. PLoS ONE 2020, 15, e0238215. [Google Scholar] [CrossRef]
- Zhang, H.; Wu, Y.; He, Y.; Liu, X.; Liu, M.; Tang, Y.; Li, X.; Yang, G.; Liang, G.; Xu, S.; et al. Age-Related Risk Factors and Complications of Patients With COVID-19: A Population-Based Retrospective Study. Front. Med. 2022, 8, 757459. [Google Scholar] [CrossRef] [PubMed] [PubMed Central]
- Bonato, F.O.B.; Canziani, M.E.F. Ventricular arrhythmia in chronic kidney disease patients. J. Bras. Nephrol. 2017, 39, 186–195. [Google Scholar] [CrossRef] [PubMed]
- Anastasio, P.; Cirillo, M.; Spitali, L.; Frangiosa, A.; Pollastro, R.M.; De Santo, N.G. Level of hydration and renal function in healthy humans. Kidney Int. 2001, 60, 748–756. [Google Scholar] [CrossRef] [PubMed]
- Satpathy, S.; Satpathy, S.; Nayak, P. Correlation of blood pressure and QT interval. Natl. J. Physiol. Pharm. Pharmacol. 2018, 8, 207–210. [Google Scholar] [CrossRef]
- Kang, J.; Wang, L.; Chen, X.-L.; Triggle, D.J.; Rampe, D. Interactions of a series of fluoroquinolone antibacterial drugs with the human cardiac K+ channel HERG. Mol. Pharmacol. 2001, 59, 122–126. [Google Scholar]
- Mönnig, G.; Eckardt, L.; Wedekind, H.; Haverkamp, W.; Gerss, J.; Milberg, P.; Wasmer, K.; Kirchhof, P.; Assmann, G.; Breithardt, G.; et al. Electrocardiographic risk stratification in families with congenital long QT syndrome. Eur. Heart J. 2006, 27, 2074–2080. [Google Scholar] [CrossRef]
- Nachimuthu, S.; Assar, M.D.; Schussler, J.M. Drug-induced QT interval prolongation: Mechanisms and clinical management. Ther. Adv. Drug Saf. 2012, 3, 241–253. [Google Scholar] [CrossRef] [PubMed] [PubMed Central]
- Algra, A.; Tijssen, J.G.; Roelandt, J.R.; Pool, J.; Lubsen, J. QTc prolongation measured by standard 12-lead electrocardiography is an independent risk factor for sudden death due to cardiac arrest. Circulation 1991, 83, 1888–1894. [Google Scholar] [CrossRef] [PubMed]
- Kervezee, L.; Gotta, V.; Stevens, J.; Birkhoff, W.; Kamerling, I.; Danhof, M.; Meijer, J.; Burggraaf, J. Levofloxacin-Induced QTc Prolongation Depends on the Time of Drug Administration. CPT Pharmacomet. Syst. Pharmacol. 2016, 5, 466–474. [Google Scholar] [CrossRef] [PubMed] [PubMed Central]
- Rubinstein, E.; Camm, J. Cardiotoxicity of fluoroquinolones. J. Antimicrob. Chemother. 2002, 49, 593–596. [Google Scholar] [CrossRef]
- Ball, P. Quinolone-induced QT interval prolongation: A not-so-unexpected class effect. J. Antimicrob. Chemother. 2000, 45, 557–559. [Google Scholar] [CrossRef] [PubMed]
- Liu, W.; Shao, R.; Zhang, S.; Jin, L.; Liu, R.; Chen, P.; Hu, J.; Ma, H.; Wu, B.; Liang, W.; et al. Characteristics, predictors and outcomes of new-onset QT prolongation in sepsis: A multicenter retrospective study. Crit. Care 2024, 28, 115. [Google Scholar] [CrossRef] [PubMed] [PubMed Central]
- Kuribayashi, T. Elimination half-lives of interleukin-6 and cytokine-induced neutrophil chemoattractant-1 synthesized in response to inflammatory stimulation in rats. Lab. Anim. Res. 2018, 34, 80–83. [Google Scholar] [CrossRef] [PubMed] [PubMed Central]
- Nilsonne, G.; Lekander, M.; Åkerstedt, T.; Axelsson, J.; Ingre, M. Diurnal Variation of Circulating Interleukin-6 in Humans: A Meta-Analysis. PLoS ONE 2016, 11, e0165799. [Google Scholar] [CrossRef] [PubMed] [PubMed Central]
- Sun, G.-Z.; Zhou, Y.; Ye, N.; Wu, S.-J.; Sun, Y.-X. Independent Influence of Blood Pressure on QTc Interval: Results from a General Chinese Population. BioMed Res. Int. 2019, 2019, 1656123. [Google Scholar] [CrossRef] [PubMed] [PubMed Central]
- Schillaci, G.; Pirro, M.; Pasqualini, L.; Vaudo, G.; Ronti, T.; Gemelli, F.; Marchesi, S.; Reboldi, G.; Porcellati, C.; Mannarino, E. Prognostic significance of isolated, non-specific left ventricular repolarization abnormalities in hypertension. J. Hypertens. 2004, 22, 407–414. [Google Scholar] [CrossRef] [PubMed]
- Rabkin, S.W.; Cheng, X.J.; Thompson, D.J. Detailed analysis of the impact of age on the QT interval. J. Geriatr. Cardiol. 2016, 13, 740–748. [Google Scholar] [CrossRef] [PubMed] [PubMed Central]
- Mandyam, M.C.; Soliman, E.Z.; Alonso, A.; Dewland, T.A.; Heckbert, S.R.; Vittinghoff, E.; Cummings, S.R.; Ellinor, P.T.; Chaitman, B.R.; Stocke, K.; et al. The QT interval and risk of incident atrial fibrillation. Heart Rhythm. 2013, 10, 1562–1568. [Google Scholar] [CrossRef] [PubMed] [PubMed Central]
- Hoshino, T.; Nagao, T.; Shiga, T.; Maruyama, K.; Toi, S.; Mizuno, S.; Ishizuka, K.; Shimizu, S.; Uchiyama, S.; Kitagawa, K. Prolonged QTc Interval Predicts Poststroke Paroxysmal Atrial Fibrillation. Stroke 2015, 46, 71–76. [Google Scholar] [CrossRef] [PubMed]
- Kario, K.; Abe, T.; Kanegae, H. Impact of pre-existing hypertension and control status before atrial fibrillation onset on cardiovascular prognosis in patients with non-valvular atrial fibrillation: A real-world database analysis in Japan. J. Clin. Hypertens. 2020, 22, 431–437. [Google Scholar] [CrossRef] [PubMed]
- Huang, C.-Y.; Overholser, B.R.; Sowinski, K.M.; Jaynes, H.A.; Kovacs, R.J.; Tisdale, J.E. Drug-induced QT interval prolongation in patients with heart failure with preserved ejection fraction. PLoS ONE 2024, 19, e0308999. [Google Scholar] [CrossRef] [PubMed] [PubMed Central]
- Breidthardt, T.; Christ, M.; Matti, M.; Schrafl, D.; Laule, K.; Noveanu, M.; Boldanova, T.; Klima, T.; Hochholzer, W.; Perruchoud, A.P.; et al. QRS and QTc interval prolongation in the prediction of long-term mortality of patients with acute destabilised heart failure. Heart 2007, 93, 1093–1097. [Google Scholar] [CrossRef] [PubMed] [PubMed Central]
- Widimsky, P. Hypokalemia and the heart. J. Cardiol. Pract. 2008, 7, 9–12. [Google Scholar]
- Trimarchi, G.; Pizzino, F. An in-depth look at electrolytes in acute heart failure: The role of sodium-to-chloride ratio. Int. J. Cardiol. 2024, 417, 132585. [Google Scholar] [CrossRef] [PubMed]
- Sonaglioni, A.; Lonati, C.; Tescaro, L.; Nicolosi, G.L.; Proietti, M.; Lombardo, M.; Harari, S. Prevalence and clinical outcome of main echocardiographic and hemodynamic heart failure phenotypes in a population of hospitalized patients 70 years old and older. Aging Clin. Exp. Res. 2022, 34, 1081–1094. [Google Scholar] [CrossRef] [PubMed]
- Tedeschi, A.; Palazzini, M.; Trimarchi, G.; Conti, N.; Di Spigno, F.; Gentile, P.; D’angelo, L.; Garascia, A.; Ammirati, E.; Morici, N.; et al. Heart Failure Management through Telehealth: Expanding Care and Connecting Hearts. J. Clin. Med. 2024, 13, 2592. [Google Scholar] [CrossRef] [PubMed] [PubMed Central]

| Parameter | Group | n |
|---|---|---|
| Levofloxacin therapy | Yes | 78 |
| No (control group) | 15 | |
| Sex | Female | 44 |
| Male | 49 | |
| Smoking | Yes | 11 |
| No | 79 | |
| Hypertension | Yes | 73 |
| No | 20 | |
| Diabetes Mellitus | Yes | 33 |
| No | 59 | |
| Atrial Fibrillation (paroxysmal) | Yes | 16 |
| No | 74 | |
| Heart Failure | Yes | 20 |
| No | 67 | |
| COVID-19 severity | Mild | 39 |
| Moderate/Severe | 54 | |
| Resting dyspnea | Yes | 47 |
| No | 46 |
| Parameter | npairs | Distribution a |
|---|---|---|
| Il-6, pg/mL | 69 | 73.20 (40.80, 130.80) |
| CRP, mg/L | 92 | 84.32 (36.60, 141.54) |
| BMI, kg/m2 | 66 | 27.89 (24.55, 32.31) |
| Patient’s age, years | 93 | 69.00 (60.00, 81.00) |
| Saturation, % | 87 | 90.00 (83.50, 93.00) |
| SBP, mmHg | 93 | 120.00 (110.00, 134.00) |
| DBP, mmHg | 93 | 75.00 (67.00, 81.00) |
| HR, beats/min | 92 | 80.00 (71.00, 94.25) |
| ALT, μ/L | 85 | 37.00 (22.00, 64.00) |
| AST, μ/L | 75 | 30.00 (22.50, 46.50) |
| WBC, 103/μL | 92 | 7.08 (5.13, 9.27) |
| NEU, 103/μL | 90 | 4.98 (3.35, 7.27) |
| LYM, 103/μL | 89 | 0.98 (0.61, 1.36) |
| HGB, g/dL | 92 | 13.00 (11.60, 14.13) |
| MCV, fL | 92 | 86.30 (82.78, 90.13) |
| PLT, 103/μL | 92 | 179.50 (144.74, 291.50) |
| Creatinine, mg/dL | 89 | 0.93 (0.79, 1.17) |
| eGFR, mL/min/1.73 m2 | 89 | 75.00 (60.10, 95.90) |
| Potassium, mmol/L | 93 | 4.54 (3.97, 5.01) |
| Sodium, mmol/L | 92 | 139.00 (136.00, 141.00) |
| Ferritin, μg/L | 66 | 876.10 (541.35, 1478.00) |
| Fibrinogen, mg/dL | 81 | 527.00 (364.00, 663.00) |
| D-dimers. mg/L FEU | 88 | 1298.50 (682.25, 2143.50) |
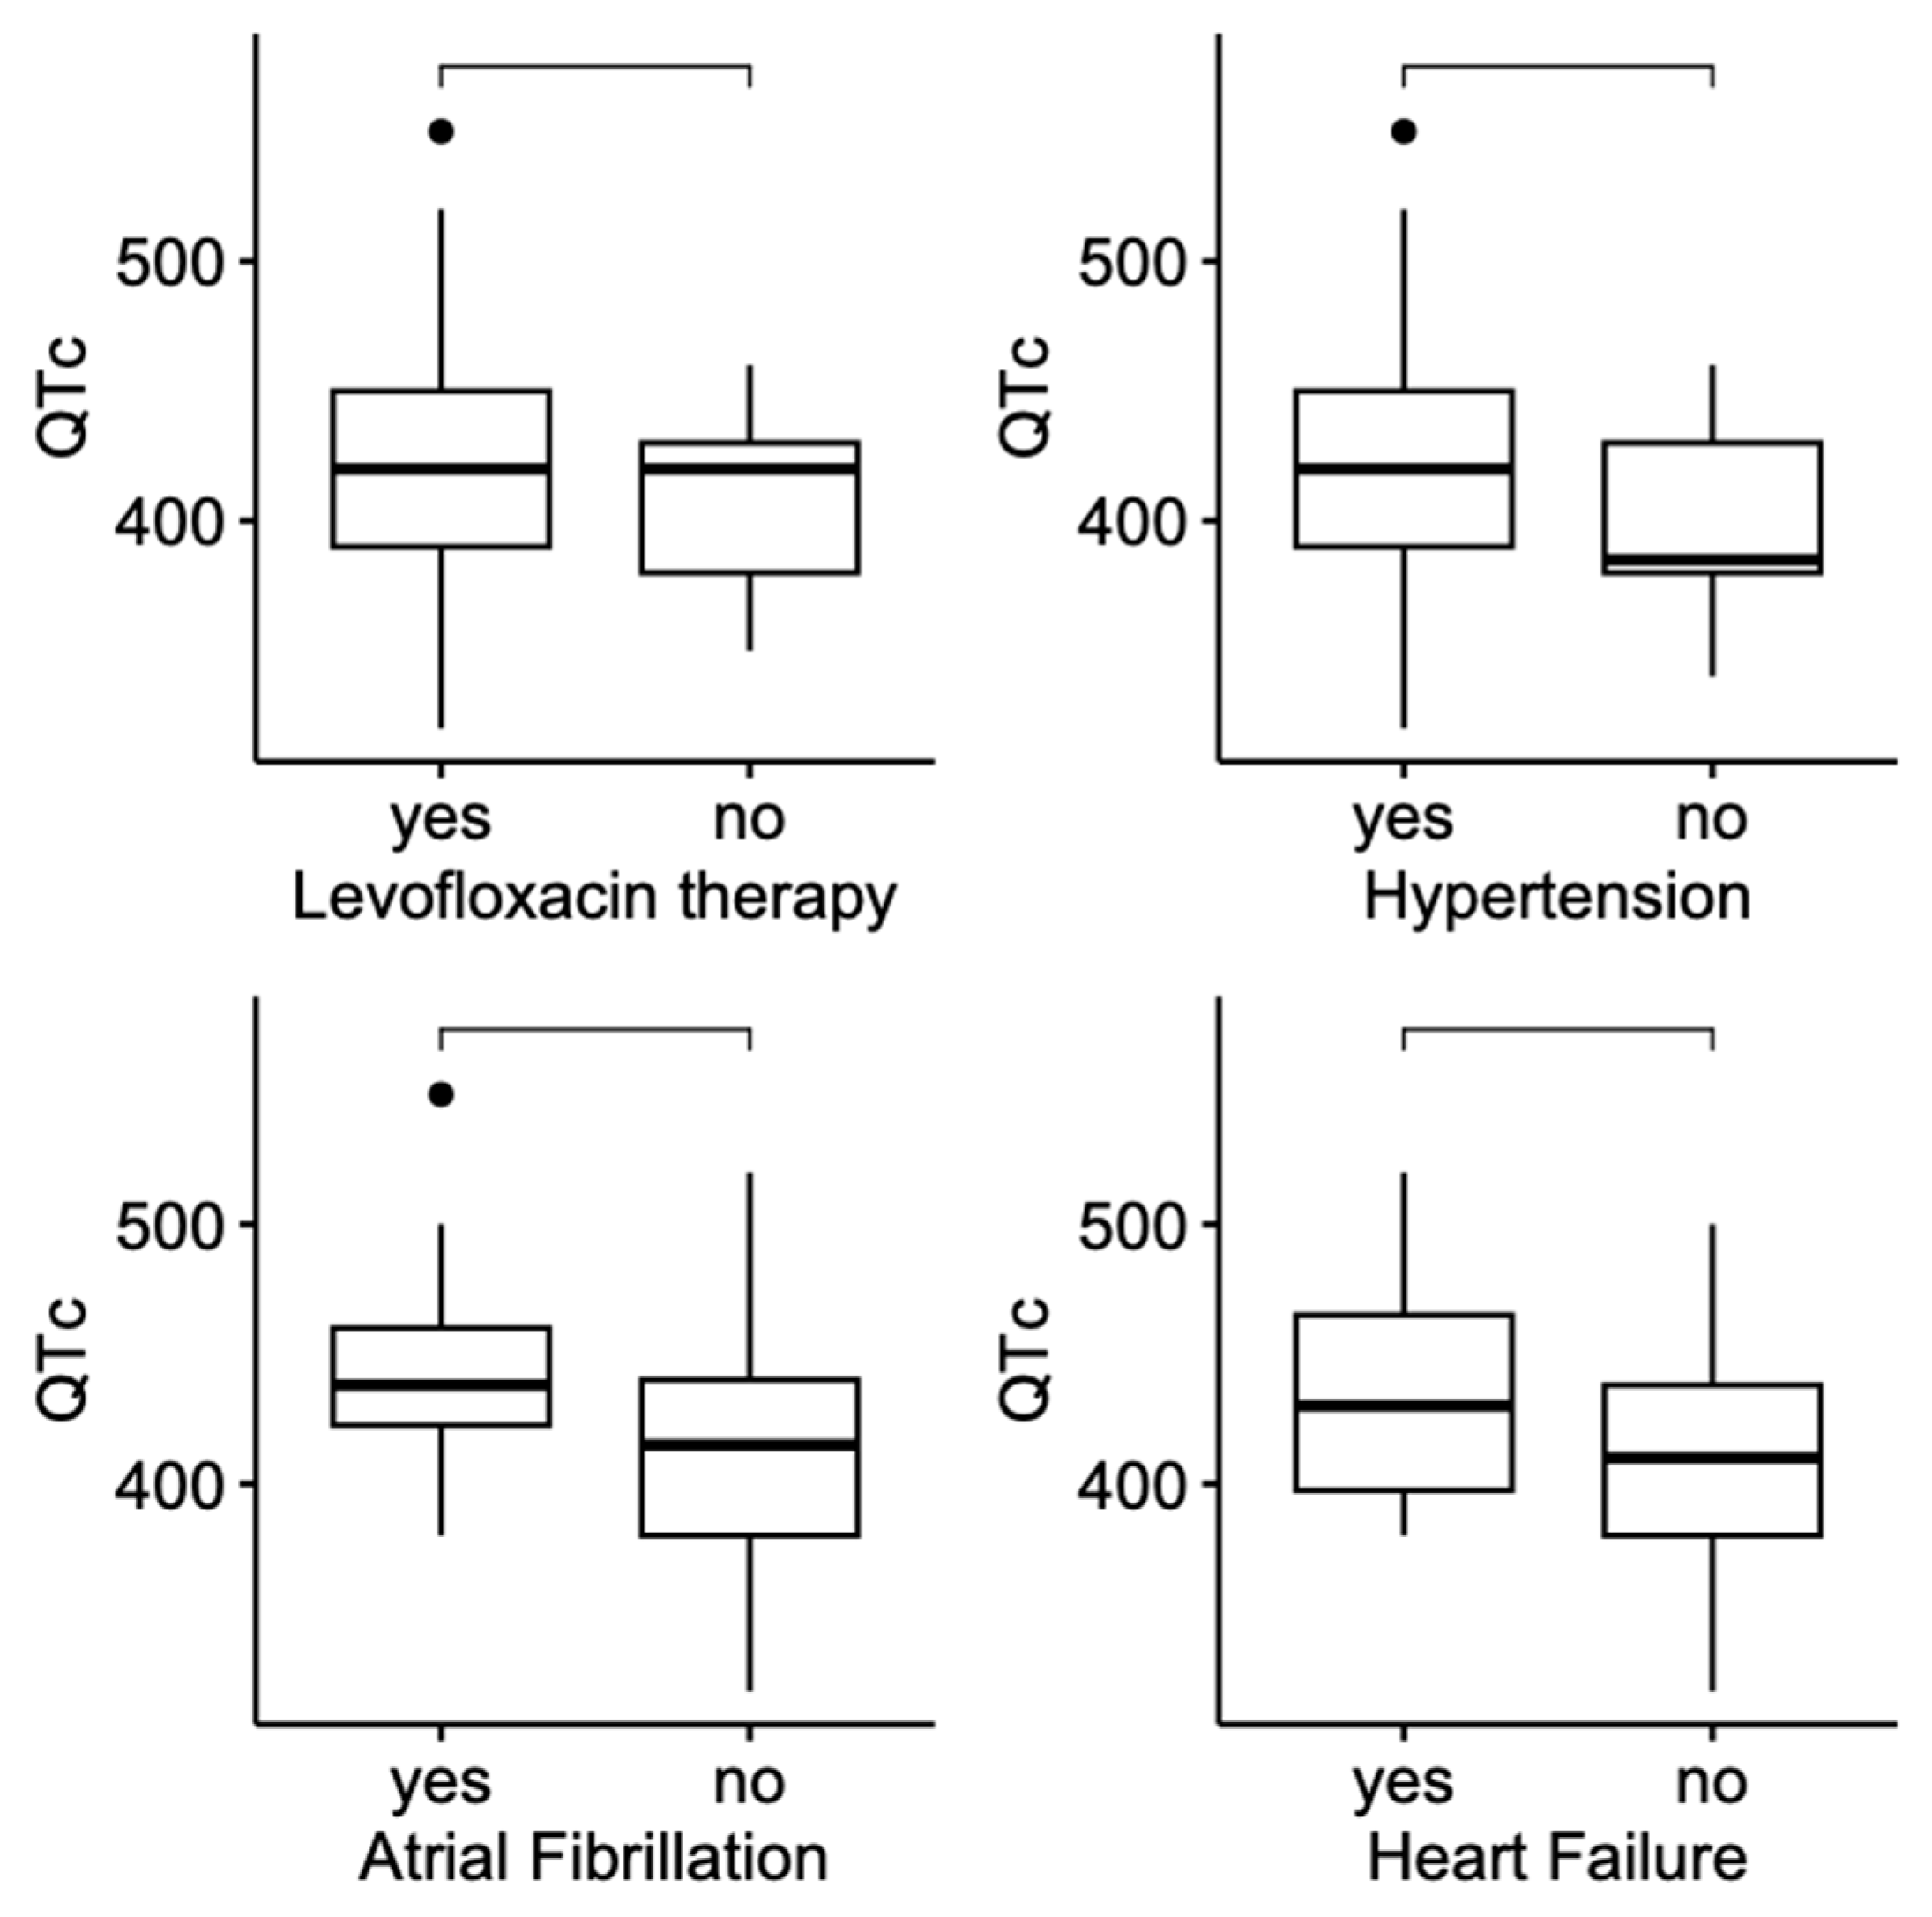
| Parameter | Group | n | QTc Distribution a | p b |
|---|---|---|---|---|
| Levofloxacin therapy | Yes | 78 | 420.00 (390.00, 450.00) | 0.293 |
| No (control group) | 15 | 420.00 (380.00, 430.00) | ||
| Sex | Female | 44 | 420.00 (380.00, 446.25) | 0.700 |
| Male | 49 | 420.00 (390.00, 440.00) | ||
| Smoking | Yes | 11 | 410.00 (362.50, 420.00) | 0.120 |
| No | 79 | 420.00 (385.00, 450.00) | ||
| Hypertension | Yes | 73 | 420.00 (390.00, 450.00) | 0.020 |
| No | 20 | 385.00 (380.00, 430.00) | ||
| Diabetes Mellitus | Yes | 33 | 410.00 (385.00, 440.00) | 0.590 |
| No | 59 | 420.00 (385.00, 447.50) | ||
| Atrial Fibrillation (paroxysmal or persistent) | Yes | 16 | 438.00 (422.50, 460.00) | 0.018 |
| No | 74 | 415.00 (380.00, 440.00) | ||
| Heart Failure | Yes | 20 | 430.00 (397.50, 465.00) | 0.018 |
| No | 67 | 410.00 (380.00, 438.00) | ||
| COVID-19 severity | Mild | 39 | 400.00 (380.00, 433.00) | 0.054 |
| Moderate/Severe | 54 | 430.00 (390.00, 450.00) | ||
| Resting dyspnea | Yes | 47 | 420.00 (380.00, 450.00) | 0.732 |
| No | 46 | 420.00 (390.00, 440.00) |
| Parameter | npairs | Distribution a | QTc, 420.00 (385.00, 445.00) ms | ||
|---|---|---|---|---|---|
| Rho | CI 95% | p | |||
| Il-6, pg/mL | 69 | 73.20 (40.80, 130.80) | −0.05 | −0.29–0.20 | 0.698 |
| CRP, mg/L | 92 | 84.32 (36.60, 141.54) | −0.08 | −0.29–0.13 | 0.451 |
| BMI, kg/m2 | 66 | 27.89 (24.55, 32.31) | −0.03 | −0.28–0.22 | 0.796 |
| Patient’s age, years | 93 | 69.00 (60.00, 81.00) | 0.34 | 0.14–0.52 | <0.001 |
| Saturation, % | 87 | 90.00 (83.50, 93.00) | 0.08 | −0.14–0.29 | 0.479 |
| SBP, mmHg | 93 | 120.00 (110.00, 134.00) | 0.11 | −0,10–0,31 | 0.306 |
| DBP, mmHg | 93 | 75.00 (67.00, 81.00) | 0.16 | −0.05–0.36 | 0.116 |
| HR, beats/min | 92 | 80.00 (71.00, 94.25) | −0.18 | −0.38–0.03 | 0.078 |
| ALT, μ/L | 85 | 37.00 (22.00, 64.00) | −0.04 | −0.26–0.18 | 0.717 |
| AST, μ/L | 75 | 30.00 (22.50, 46.50) | 0.02 | −0.21–0.25 | 0.849 |
| WBC, 103/μL | 92 | 7.08 (5.13, 9.27) | −0.05 | −0.26–0.16 | 0.609 |
| NEU, 103/μL | 90 | 4.98 (3.35, 7.27) | −0.07 | −0.28–0.15 | 0.518 |
| LYM, 103/μL | 89 | 0.98 (0.61, 1.36) | −0.12 | −0.33–0.09 | 0.252 |
| HGB, g/dL | 92 | 13.00 (11.60, 14.13) | −0.07 | −0.28–0.14 | 0.478 |
| MCV, fL | 92 | 86.30 (82.78, 90.13) | 0.20 | −0.01–0.40 | 0.053 |
| PLT, 103/μL | 92 | 179.50 (144.74, 291.50) | −0.16 | −0.36–0.05 | 0.120 |
| Creatinine, mg/dL | 89 | 0.93 (0.79, 1.17) | 0.18 | −0.03–0.38 | 0.090 |
| eGFR, mL/min/1.73 m2 | 89 | 75.00 (60.10, 95.90) | −0.15 | −0.35–0.06 | 0.155 |
| Potassium, mmol/L | 93 | 4.54 (3.97, 5.01) | −0.19 | −0.38–0.02 | 0.073 |
| Sodium, mmol/L | 92 | 139.00 (136.00, 141.00) | 0.03 | −0.18–0.24 | 0.793 |
| Ferritin, μg/L | 66 | 876.10 (541.35, 1478.00) | 0.16 | −0.10–0.39 | 0.209 |
| Fibrinogen, mg/dL | 81 | 527.00 (364.00, 663.00) | −0.08 | −0.30–0.15 | 0.486 |
| D-dimers. mg/L FEU | 88 | 1298.50 (682.25, 2143.50) | 0.12 | −0.09–0.33 | 0.250 |
| QTc, ms | |||
|---|---|---|---|
| Predictors | β | CI 95% | p |
| (Intercept) | −0.05 | −0.29–0.20 | 0.698 |
| HR (centered by the Mdn = 80 beats/min) | −0.08 | −0.29–0.13 | 0.451 |
| Creatinine (centered by the Mdn = 0.93 mg/dL) | −0.03 | −0.28–0.22 | 0.796 |
| eGFR (centered by the Mdn = 75.0 mL/min/1.73 m2) | 0.34 | 0.14–0.52 | <0.001 |
| Hypertension | |||
| No | Reference level | ||
| Yes | 18.11 | −2.79–39.02 | 0.088 |
| HF LVEF =< 60% | Reference level | ||
| No | |||
| Yes | 24.07 | 2.78–45.35 | 0.027 |
Disclaimer/Publisher’s Note: The statements, opinions and data contained in all publications are solely those of the individual author(s) and contributor(s) and not of MDPI and/or the editor(s). MDPI and/or the editor(s) disclaim responsibility for any injury to people or property resulting from any ideas, methods, instructions or products referred to in the content. |
© 2025 by the authors. Licensee MDPI, Basel, Switzerland. This article is an open access article distributed under the terms and conditions of the Creative Commons Attribution (CC BY) license (https://creativecommons.org/licenses/by/4.0/).
Share and Cite
Wilk-Śledziewska, K.; Śledziewski, R.; Gryciuk, M.; Sielatycki, P.J.; Zbroch, A.; Kukliński, F.; Zbroch, E. Heart Failure, Kidney Function, and Elderly Age, Rather than Levofloxacin Therapy, Are Associated with QTc Prolongation in COVID-19 Patients. J. Clin. Med. 2025, 14, 4006. https://doi.org/10.3390/jcm14114006
Wilk-Śledziewska K, Śledziewski R, Gryciuk M, Sielatycki PJ, Zbroch A, Kukliński F, Zbroch E. Heart Failure, Kidney Function, and Elderly Age, Rather than Levofloxacin Therapy, Are Associated with QTc Prolongation in COVID-19 Patients. Journal of Clinical Medicine. 2025; 14(11):4006. https://doi.org/10.3390/jcm14114006
Chicago/Turabian StyleWilk-Śledziewska, Katarzyna, Rafał Śledziewski, Małgorzata Gryciuk, Piotr Jan Sielatycki, Aleksandra Zbroch, Franciszek Kukliński, and Edyta Zbroch. 2025. "Heart Failure, Kidney Function, and Elderly Age, Rather than Levofloxacin Therapy, Are Associated with QTc Prolongation in COVID-19 Patients" Journal of Clinical Medicine 14, no. 11: 4006. https://doi.org/10.3390/jcm14114006
APA StyleWilk-Śledziewska, K., Śledziewski, R., Gryciuk, M., Sielatycki, P. J., Zbroch, A., Kukliński, F., & Zbroch, E. (2025). Heart Failure, Kidney Function, and Elderly Age, Rather than Levofloxacin Therapy, Are Associated with QTc Prolongation in COVID-19 Patients. Journal of Clinical Medicine, 14(11), 4006. https://doi.org/10.3390/jcm14114006