
Comparison of Maternal Serum Neuropilin-1 (NRP-1) and Fetal Cord Blood NRP-1 Concentrations in Between Normotensive Pregnant Women and Those with Preeclampsia

Abstract
:1. Introduction
2. Materials and Methods
- The microeliza method works using the sandwich ELISA principle. In this method, 100 microliters each of the main standard at a concentration of 1000.00 pg/mL and standard samples of different concentrations prepared by dilution from this standard and serum samples of the study were added to 96-well plates coated with monoclonal antibodies against human sNRP-1, one sample per well. The reaction wells on the 96-well test plate were identified and recorded for each sample so that the standard and study samples seeded in the wells could be labeled. Standards and working samples at all concentrations used were inoculated twice each to ensure a replicate study.
- After seeding of samples and standards, Elisa plates were incubated at 37 °C for 90 min for the binding of sNRP-1 ligands in samples and standards with antibodies against sNRP-1, which were ready coated in the wells.
- At the end of the incubation period, the liquid material in the Elisa plate was drained and the biotinylated antibody against human sNRP-1 in the test kit was added to 100 microliters per well. The Elisa plate was incubated at 37 °C for 60 min to allow the biotinylated antibody to bind to the antibody–ligand complex, which had been previously incubated and bound.
- After incubation, the reaction wells of the Elisa working plate were washed three times consecutively with washing solution to remove unbound antibodies. For this process, the washing solution in the kit with a concentration of 100× was diluted one hundred times with distilled water. For each wash cycle, 350 microliters of this solution prepared at a concentration of 1x was added to all wells, shaken for 60 s to allow unbound antibodies to pass into the wash solution, and then the liquid in the well was discarded. The process was repeated three times.
- After washing, 100 microliters of Avidin Horse Radish Peroxidase (HRP) enzyme was added to each well to label antibody–antigen–biotinylated antibody complexes in the working plate. Incubation at 37 °C for thirty minutes was performed to allow binding of this enzyme marker molecule, followed by five consecutive washes to remove unbound enzyme components.
- After the enzyme labeling step, 90 microliters of substrate was added to each well to react with the enzyme. The Elisa plate was incubated at 37 °C for 15 min to complete this reaction.
- A total of 50 microliters of stop solution was added to all wells to stop the reaction. Then, the Elisa plate was placed in the Elisa plate reader (BioTek, ELx 50) and the reading stage was started.
- Using the Gen 5 program, the absorbances of the reacted samples belonging to the standards and study samples at different concentrations in each well of the Elisa plate were read at a wavelength of 450 nanometers.
- The concentration–absorbance graph was plotted against the absorbance values of the standards of known concentrations to obtain the standard working curve and reaction equation.
- 1000.00 pg/mL
- 500.00 pg/mL
- 250.00 pg/mL
- 125.00 pg/mL
- 62.50 pg/mL
- 31.25 pg/mL
- 15.62 pg/mL
- 0 pg/mL (standard diluent)
Statistical Analysis
3. Results
4. Discussion
5. Conclusions
Author Contributions
Funding
Institutional Review Board Statement
Informed Consent Statement
Data Availability Statement
Acknowledgments
Conflicts of Interest
References
- Poon, L.C.; Shennan, A.; Hyett, J.A.; Kapur, A.; Hadar, E.; Divakar, H.; McAuliffe, F.; da Silva Costa, F.; Von Dadelszen, P.; McIntyre, H.D. The International Federation of Gynecology and Obstetrics (FIGO) initiative on preeclampsia (PE): A pragmatic guide for first trimester screening and prevention. Int. J. Gynaecol. Obstet. Off. Organ. Int. Fed. Gynaecol. Obstet. 2019, 145 (Suppl. S1), 1. [Google Scholar] [CrossRef] [PubMed]
- Magee, L.A.; Brown, M.A.; Hall, D.R.; Gupte, S.; Hennessy, A.; Karumanchi, S.A.; Kenny, L.C.; McCarthy, F.; Myers, J.; Poon, L.C. The 2021 International Society for the Study of Hypertension in Pregnancy classification, diagnosis & management recommendations for international practice. Pregnancy Hypertens. 2022, 27, 148–169. [Google Scholar] [PubMed]
- Gestational Hypertension and Preeclampsia; ACOG Practice Bulletin, Number 222. Obs. Gynecol. 2020, 135, e237–e260. [CrossRef] [PubMed]
- Meads, C.; Cnossen, J.; Meher, S.; Juarez-Garcia, A.; Ter Riet, G.; Duley, L.; Roberts, T.; Mol, B.; Van der Post, J.; Leeflang, M. Methods of prediction and prevention of pre-eclampsia: Systematic reviews of accuracy and effectiveness literature with economic modelling. Health Technol. Assess. 2008, 12, iii–270. [Google Scholar] [CrossRef]
- Davis, E.F.; Lazdam, M.; Lewandowski, A.J.; Worton, S.A.; Kelly, B.; Kenworthy, Y.; Adwani, S.; Wilkinson, A.R.; McCormick, K.; Sargent, I. Cardiovascular risk factors in children and young adults born to preeclamptic pregnancies: A systematic review. Pediatrics 2012, 129, e1552–e1561. [Google Scholar] [CrossRef]
- O’Gorman, N.; Wright, D.; Poon, L.; Rolnik, D.L.; Syngelaki, A.; de Alvarado, M.; Carbone, I.F.; Dutemeyer, V.; Fiolna, M.; Frick, A. Multicenter screening for preeclampsia by maternal factors and biomarkers at 11–13 weeks’ gestation: Comparison with NICE guidelines and ACOG recommendations. Ultrasound Obstet. Gynecol. 2017, 49, 756–760. [Google Scholar] [CrossRef]
- Cunningham, F.G.; Leveno, K.J.; Bloom, S.L.; Spong, C.Y.; Dashe, J.S.; Hoffman, B.L.; Casey, B.M.; Sheffield, J.S. Williams Obstetrics; McGraw-Hill Medical: New York, NY, USA, 2014; Volume 7. [Google Scholar]
- Sani, H.M.; Vahed, S.Z.; Ardalan, M. Preeclampsia: A close look at renal dysfunction. Biomed. Pharmacother. 2019, 109, 408–416. [Google Scholar] [CrossRef]
- Hong, T.-M.; Chen, Y.-L.; Wu, Y.-Y.; Yuan, A.; Chao, Y.-C.; Chung, Y.-C.; Wu, M.-H.; Yang, S.-C.; Pan, S.-H.; Shih, J.-Y. Targeting neuropilin 1 as an antitumor strategy in lung cancer. Clin. Cancer Res. 2007, 13, 4759–4768. [Google Scholar] [CrossRef]
- Baston-Buest, D.M.; Porn, A.C.; Schanz, A.; Kruessel, J.-S.; Janni, W.; Hess, A.P. Expression of the vascular endothelial growth factor receptor neuropilin-1 at the human embryo–maternal interface. Eur. J. Obstet. Gynecol. Reprod. Biol. 2011, 154, 151–156. [Google Scholar] [CrossRef]
- Fantin, A.; Herzog, B.; Mahmoud, M.; Yamaji, M.; Plein, A.; Denti, L.; Ruhrberg, C.; Zachary, I. Neuropilin 1 (NRP1) hypomorphism combined with defective VEGF-A binding reveals novel roles for NRP1 in developmental and patholog- ical angiogenesis. Development 2014, 141, 556–562. [Google Scholar] [CrossRef]
- Halder, J.B.; Zhao, X.; Soker, S.; Paria, B.C.; Klagsbrun, M.; Das, S.K.; Dey, S.K. Differential expression of VEGF isoforms and VEGF(164)-specific receptor neuropilin-1 in the mouse uterus suggests a role for VEGF(164) in vascular permeability and angiogenesis during implantation. Genesis 2000, 26, 213–224. [Google Scholar] [CrossRef]
- Soker, S.; Takashima, S.; Miao, H.Q.; Neufeld, G.; Klagsbrun, M. Neuropilin-1 is expressed by endothelial and tumor cells as an isoform-specific receptor for vascular endothelial growth factor. Cell 1998, 92, 735–745. [Google Scholar] [CrossRef] [PubMed]
- Hess, A.P.; Schanz, A.; Baston-Buest, D.M.; Hirchenhain, J.; Stoff-Khalili, M.A.; Bielfeld, P.; Kruessel, J.S. Expression of the vascular endo- thelial growth factor receptor neuropilin-1 in the human endometrium. J. Reprod. Immunol. 2009, 79, 129–136. [Google Scholar] [CrossRef] [PubMed]
- Mac Gabhann, F.; Popel, A.S. Differential binding of VEGF isoforms to VEGF receptor 2 in the presence of neuropilin-1: A computational model. Am. J. Physiol. Heart Circ. Physiol. 2005, 288, H2851–H2860. [Google Scholar] [CrossRef]
- Yang, X.; Chen, D.; He, B.; Cheng, W. NRP1 and MMP9 are dual targets of RNA-binding protein QKI5 to alter VEGF-R/NRP1 signalling in trophoblasts in preeclampsia. J. Cell. Mol. Med. 2021, 25, 5655–5670. [Google Scholar] [CrossRef]
- Steegers, E.A.; Von Dadelszen, P.; Duvekot, J.J.; Pijnenborg, R. Pre-eclampsia. Lancet 2010, 376, 631–644. [Google Scholar] [CrossRef]
- Naicker, T.; Dorsamy, E.; Ramsuran, D.; Burton, G.J.; Moodley, J. The role of apoptosis on trophoblast cell invasion in the placental bed of normotensive and preeclamptic pregnancies. Hypertens. Pregnancy 2013, 32, 245–256. [Google Scholar] [CrossRef]
- Rana, S.; Lemoine, E.; Granger, J.P.; Karumanchi, S.A. Preeclampsia: Pathophysiology, challenges, and perspectives. Circ. Res. 2019, 124, 1094–1112. [Google Scholar] [CrossRef]
- Redman, C.W.; Sargent, I.L. Latest advances in understanding preeclampsia. Science 2005, 308, 1592–1594. [Google Scholar] [CrossRef]
- English, F.A.; Kenny, L.C.; McCarthy, F.P. Risk factors and effective management of preeclampsia. Integr. Blood Press. Control 2015, 8, 7–12. [Google Scholar]
- Fox, R.; Kitt, J.; Leeson p Aye, C.Y.; Lewandowski, A.J. Preeclampsia: Risk factors, diagnosis, management, and the cardio-vascular impact on the offspring. J. Clin. Med. 2019, 8, 1625. [Google Scholar] [CrossRef] [PubMed]
- Paré, E.; Parry, S.; McElrath, T.F.; Pucci, D.; Newton, A.; Lim, K.H. Clinical risk factors for preeclampsia in the 21st century. Obstet. Gynecol. 2014, 124, 763–770. [Google Scholar] [CrossRef] [PubMed]
- Barberic, M.; Pavicic Baldani, D.; Rogic, D.; Kralik, S. Serum concentrations of neuropilin-1 in women with endometriosis. Scand. J. Clin. Lab. Investig. 2020, 80, 271–276. [Google Scholar] [CrossRef] [PubMed]
- Awoyemi, T.; Iaccarino, D.A.; Motta-Mejia, C.; Raiss, S.; Kandzija, N.; Zhang, W.; Vatish, M. Neuropilin-1 is uniquely expressed on small syncytiotrophoblast extracellular vesicles but not on medium/large vesicles from preeclampsia and normal placentae. Biochem. Biophys. Res. Commun. 2022, 619, 151–158. [Google Scholar] [CrossRef]
- Arad, A.; Nammouz, S.; Nov, Y.; Ohel, G.; Bejar, J.; Vadasz, Z. The expression of neuropilin-1 in human placentas from normal and preeclamptic pregnancies. Int. J. Gynecol. Pathol. 2017, 36, 42–49. [Google Scholar] [CrossRef]
- Cackowskı, F.C.; Xu, L.; Hu, B.; Cheng, S.Y. Identification of Two Novel Alternativel Spliced Neuropilin-1 İsoforms. Genomics 2004, 84, 82–94. [Google Scholar] [CrossRef]
- Naidoo, N. The Regulation of Osteopontin and Soluble Neuropilin-1 in HIV-Associated Preeclampsia. Ph.D. Thesis, University of KwaZulu-Natal, Durban, South Africa, 2020. [Google Scholar]
- Klagsbrun, M.; Takashıma, S.; Mamluk, R. The Role of Neuropilin in Vascular and Tumor Biology. Adv. Exp. Med. Biol. 2002, 515, 33–48. [Google Scholar]
- Gagnon, M.L.; Bielenberg, D.R.; Gechtman, Z.; Miao, H.Q.; Takashima, S.; Soker, S.; Klagsbrun, M. Identification of a natural soluble neuropilin-1 that binds endothelial growth factor: In vivo expression and antitumor activity. Proc. Natl. Acad. Sci. USA 2000, 97, 2573–2578. [Google Scholar] [CrossRef]
- Mamluk, R.; Klagsbrun, M.; Detmar, M.; Bıelenberg, D.R. Soluble neuropilin targeted to the skin inhibits vascular permeability. Angiogenesis 2005, 8, 217–227. [Google Scholar] [CrossRef]
- Romano, E.; Chora, I.; Manetti, M.; Mazzotta, C.; Rosa, I.; Bellando-Randone, S.; Blagojevic, J.; Soares, R.; Avouac, J.; Allanore, Y.; et al. Decreased Expression of Neuropilin-1 As A Novel Key Factor Contributing to Peripheral Microvasculopathy An Defective Angiogenesis in Systemic Sclerosis. Ann. Rheum. Dis. 2016, 75, 1541–1549. [Google Scholar] [CrossRef]
- Miao, H.Q.; Klagsbrun, M. Neuropilin is a mediator of angiogenesis. Cancer Metastasis Rev. 2000, 19, 29–37. [Google Scholar] [CrossRef] [PubMed]
- Maulik, D.; De, A.; Ragolia, L.; Evans, J.; Grigoryev, D.; Lankachandra, K.; Mundy, D.; Muscat, J.; Gerkovich, M.M.; Ye, S.Q. Down-regulation of placental neuropilin-1 in fetal growth restriction. Am. J. Obstet. Gynecol. 2016, 214, 279.e1–279.e9. [Google Scholar] [CrossRef] [PubMed]
- Porter, B.; Maulik, D.; Babbar, S.; Schrufer-Poland, T.; Allsworth, J.; Ye, S.; Heruth, D.P.; Lei, T. Maternal plasma soluble neu-ropilin-1 is downregulated in fetal growth restriction complicated by abnormal umbilical artery Doppler: A pilot study. Ultra-Sound Obstet. Gynecol. 2021, 58, 716–721. [Google Scholar] [CrossRef] [PubMed]


| Variables | Normotensive Group (n:25) | PE Group (n:28) | p Value |
|---|---|---|---|
| Age, year, mean / SD | 28.5/6.8 | 29.6/7.0 | 0.58 |
| BMI, kg/m2 median/IQR | 27.1/5.2 | 29.8/6.9 | 0.15 |
| Gestational week, week, median/IQR | 38/2 | 37/2 | 0.007 |
| Gravida, n, median/IQR | 2/2 | 2/2 | 0.58 |
| Parity, n, median/IQR | 1/2 | 1/2 | 0.49 |
| Presence of comorbidities, n/% | 2/8 | 17/60.7 | <0.001 |
| Presence of HT, n/% | 1/4 | 11/39.3 | 0.002 |
| Presence of DM, n/% | 1/4 | 7/25 | 0.007 |
| History of operation, n/% | 8/32 | 12/42.9 | 0.41 |
| History of sectio, n/% * | 8/42.1 | 9/47.4 | 0.74 |
| History of preeclampsia, n/% * | -- | 10/52.6 | <0.001 |
| Protein in TIT, n/% | <0.001 | ||
| Negative | 25/100.0 | 3/10.7 | |
| Positive | -- | 25/89.3 |
| Variables | Control Group (n:25) | Preeclampsia Group (n:28) | p Value |
|---|---|---|---|
| Mode of delivery, n/% | 0.01 | ||
| Normal | 16/64.0 | 8/28.6 | |
| Sectio | 9/36.0 | 20/71.4 | |
| Baby’s gender, n/% | 0.35 | ||
| Female | 13/52.0 | 11/39.3 | |
| Male | 12/48.0 | 17/60.7 | |
| Baby’s height, cm, median/IQR | 51.0/3.0 | 50.0/4.5 | 0.28 |
| Baby’s weight, g, median/IQR | 3220.0/630.0 | 3177.5/760.0 | 0.75 |
| APGAR 1st min, median/IQR | 8/2 | 7/2 | 0.002 |
| APGAR 5th min, median/IQR | 9/1 | 8/2 | <0.001 |
| NICU need, n/% | 2/8 | 12/42.9 | 0.004 |
| Variables | Control Group (n:25) | Preeclampsia Group (n:28) | p Value |
|---|---|---|---|
| Hb, g/dL, mean/SD | 11.5/1.4 | 11.6/1.5 | 0.73 |
| Platelet 109/L, median/IQR | 250.0/106.5 | 228.5/83.3 | 0.83 |
| AST, U/L, median/IQR | 21.0/8.0 | 18.5/19.8 | 0.56 |
| ALT, U/L, median/IQR | 11.0/6.5 | 9.5/6.5 | 0.73 |
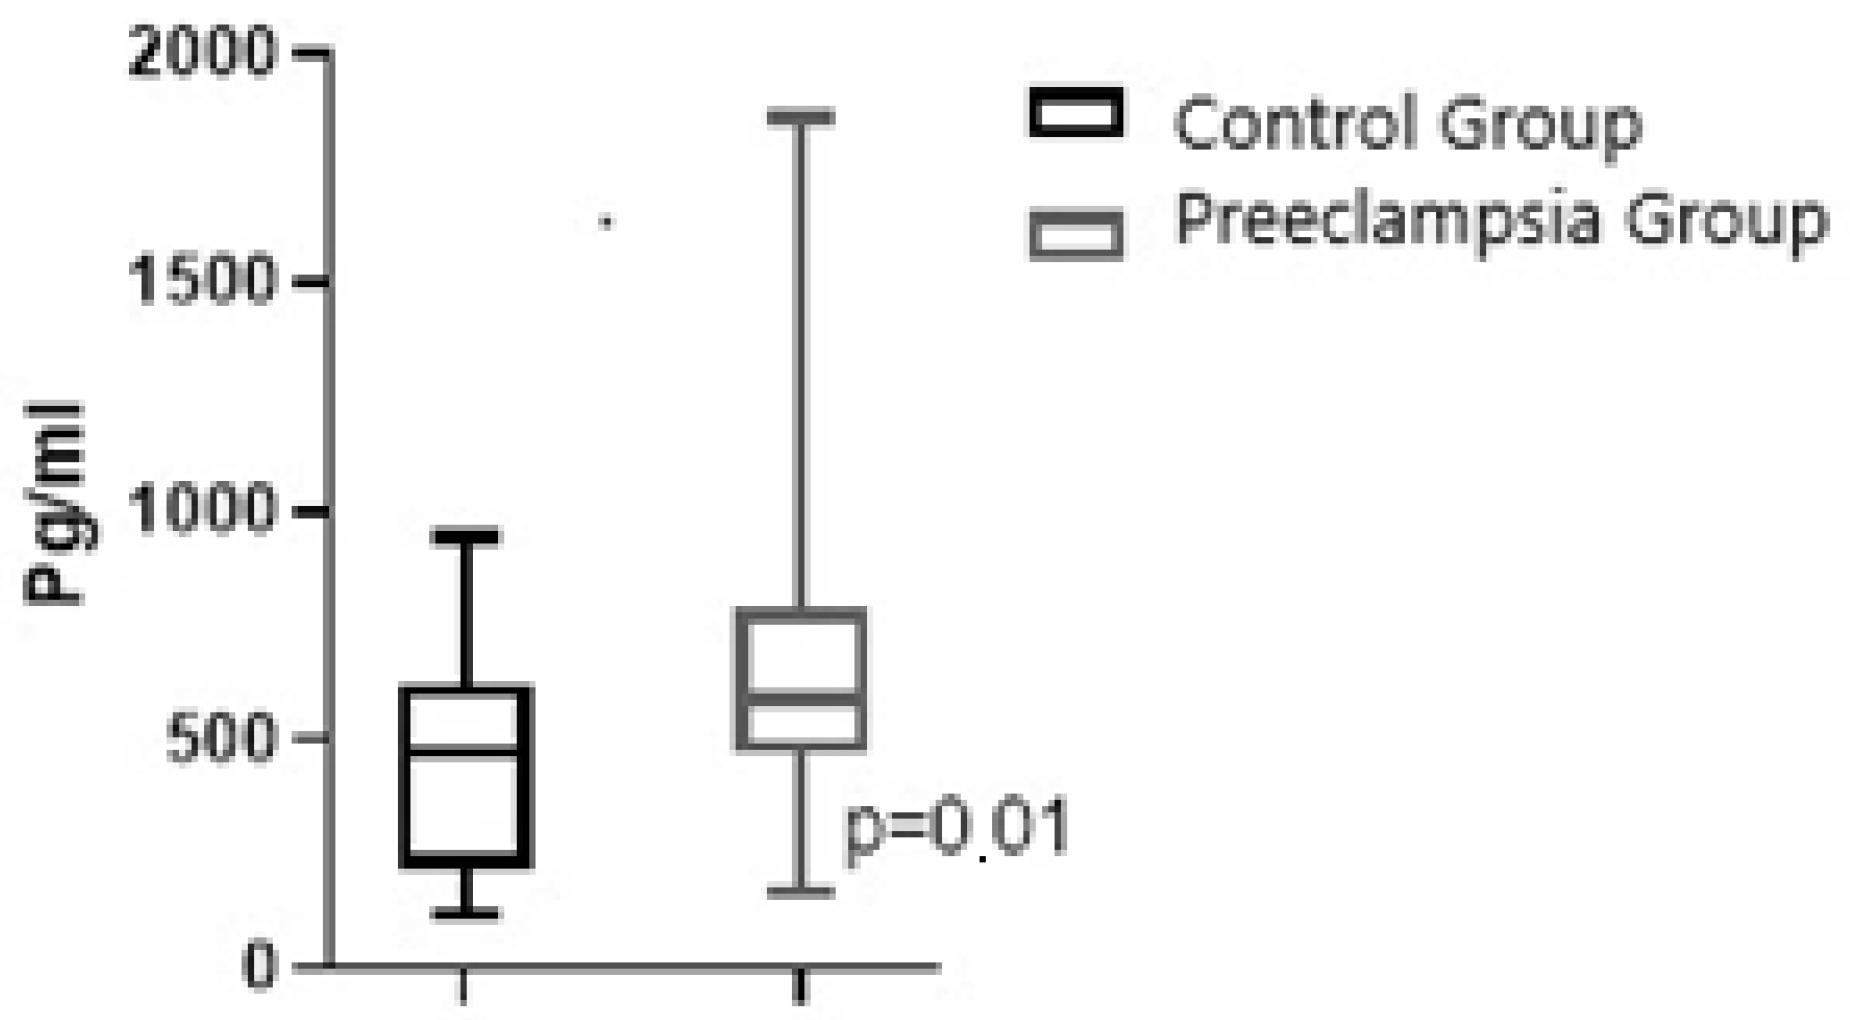
| Maternal Plasma NRP-1, pg/mL, median/IQR | 473.3/402.5 | 587.7/313.0 | 0.02 |
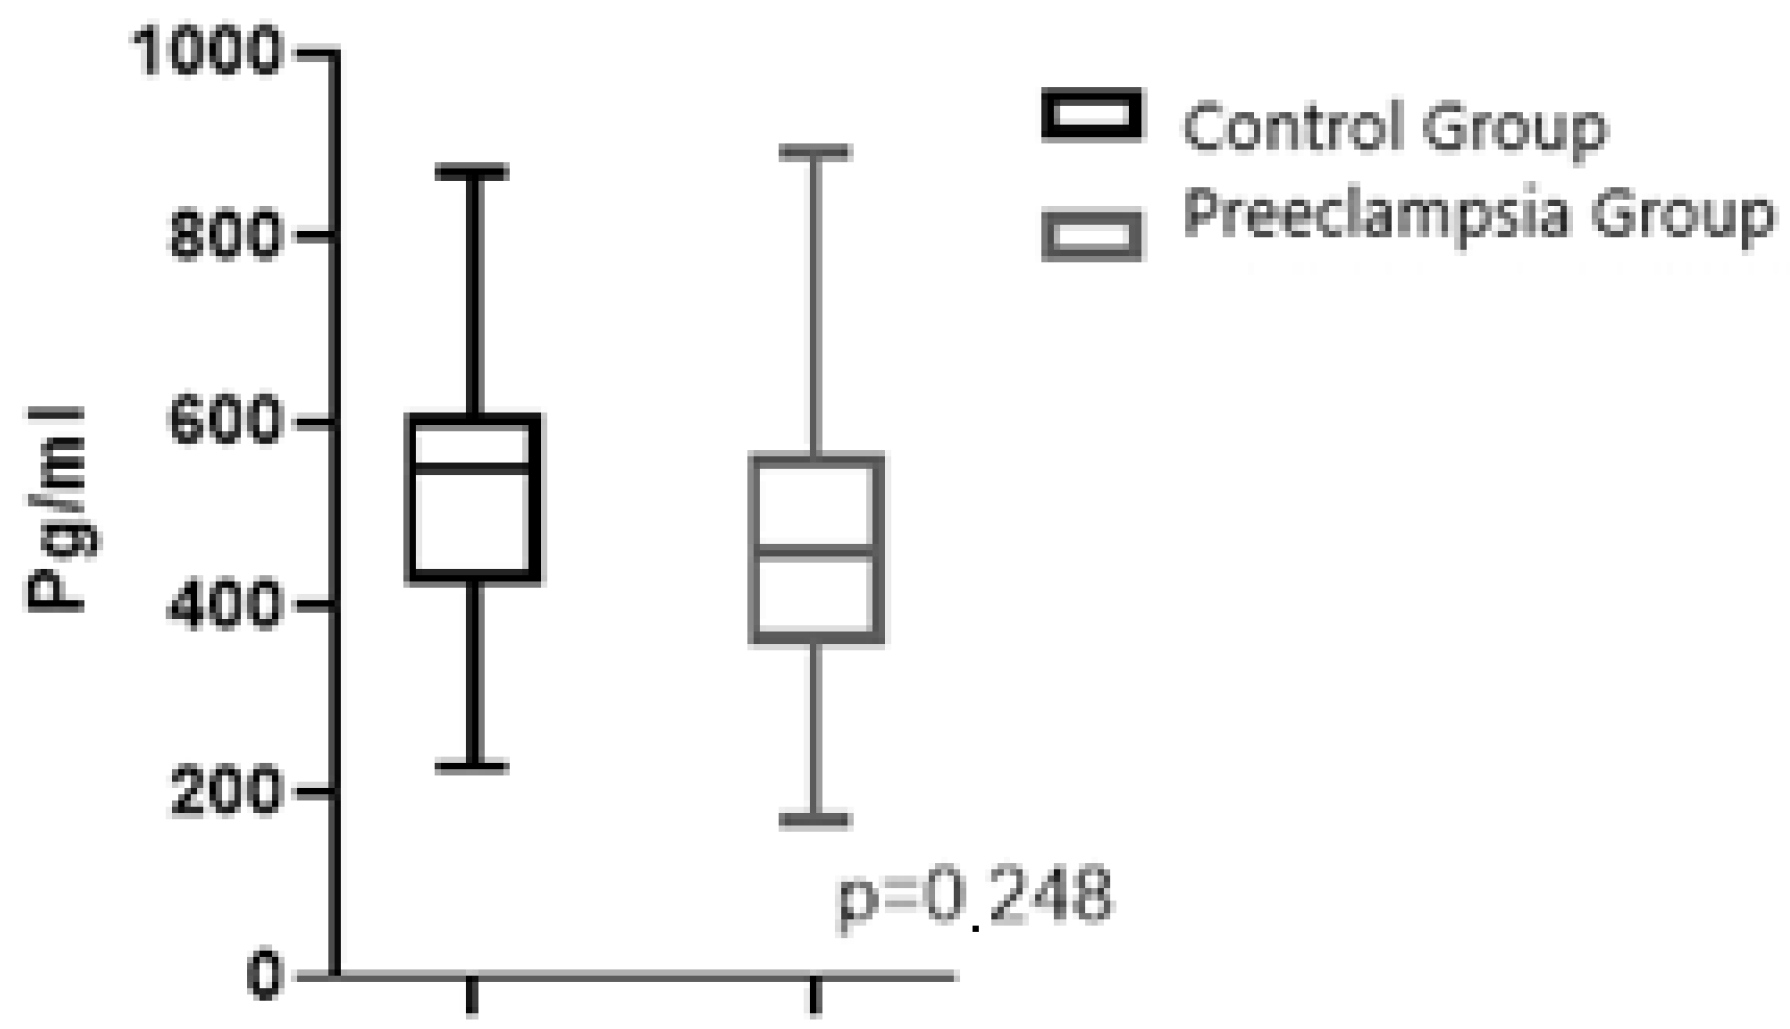
| Fetal Cord Plasma NRP-1, pg/mL, mean/SD | 520.6/162.8 | 469.2/157.1 | 0.248 |
| Variables | Odds Ratio | 95%CI | p Value |
|---|---|---|---|
| Presence of HT | 9.34 | 1.02–85.48 | 0.04 |
| Presence of DM | 6.67 | 0.66–66.90 | 0.106 |
| Maternal NRP-1 (for each pg/mL increase) | 1.003 | 1.000–1.005 | 0.04 |
| Variable | AUC | 95%CI | p | Treshold Value (pg/mL) | Sens. (%) | Spes. (%) | NPV (%) | PPV (%) |
|---|---|---|---|---|---|---|---|---|
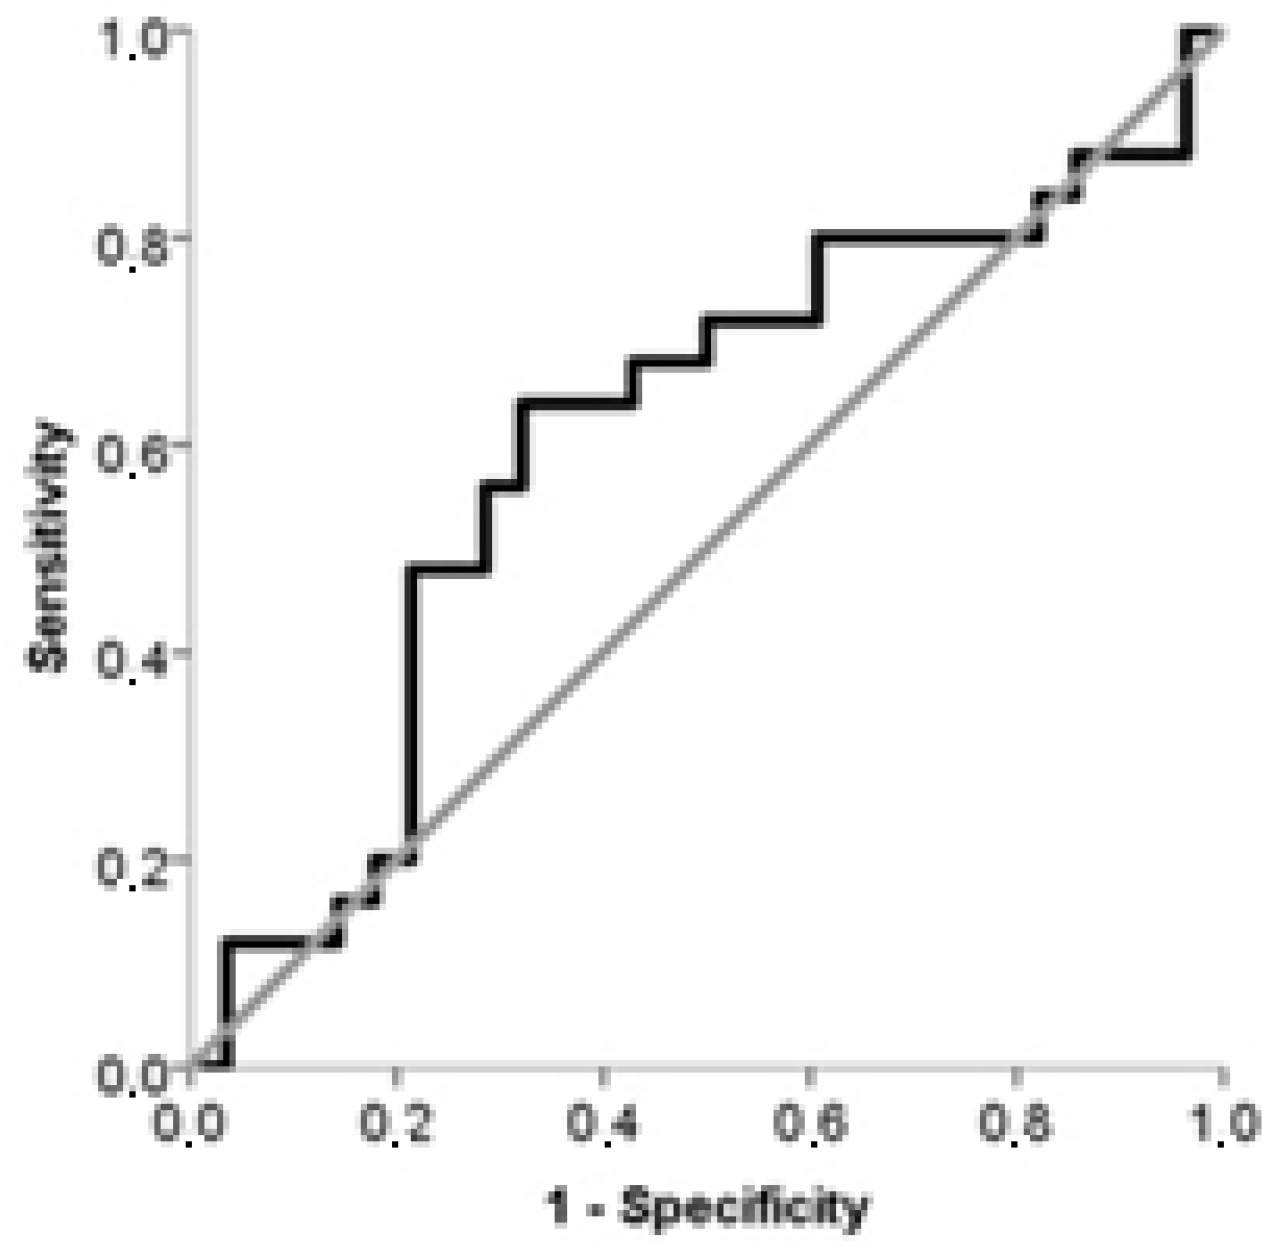
| Maternal plasma NRP-1 | 0.679 | 0.537–0.801 | 0.01 | >358.4 | 92.8 | 44.0 | 84.6 | 65.0 |
| Fetal cord plasma NRP-1 | 0.606 | 0.462–0.737 | 0.193 | ≤486.5 | 67.8 | 64.0 | 64.0 | 67.9 |
| Variable and Treshold Value | Groups by Treshold Value | No Preeclampsia (n:25) | Preeclampsia (n:28) | Odds Ratio | 95%CI | p Value |
|---|---|---|---|---|---|---|
| Maternal plasma NRP-1 (>358.4 pg/mL) | Low (n:13), n/% | 11/44 | 2/7.1 | 10.21 | 1.980–52.696 | 0.002 |
| High (n:40), n/% | 14/56 | 26/92.9 | ||||
| Fetal cord plasma NRP-1 (≤486.5 pg/mL) | Low (n:28) | 9/36 | 19/67.9 | 3.75 | 1.202–11.716 | 0.02 |
| High (n:25) | 16/64 | 9/32.1 |
| Maternal plasma Correlation with NRP-1 | Rho | p Value |
|---|---|---|
| Fetal cord plasma NRP-1 (pg/mL) | 0.182 | 0.192 |
| Age (year) | 0.034 | 0.809 |
| BMI (kg/m2) | 0.304 | 0.02 |
| Gestational week (week) | −0.001 | 0.993 |
| Baby’s weight (g) | −0.215 | 0.123 |
| Hemogram (Hg) | 0.120 | 0.392 |
| Fetal cord plasma Correlation with NRP-1 | Rho | p Value |
| Age (year) | 0.103 | 0.464 |
| BMI (kg/m2) | −0.029 | 0.839 |
| Gestational week (week) | −0.031 | 0.823 |
| Baby’s weight (g) | 0.013 | 0.926 |
| Hemoglobulin (Hb) | 0.018 | 0.900 |
Disclaimer/Publisher’s Note: The statements, opinions and data contained in all publications are solely those of the individual author(s) and contributor(s) and not of MDPI and/or the editor(s). MDPI and/or the editor(s) disclaim responsibility for any injury to people or property resulting from any ideas, methods, instructions or products referred to in the content. |
© 2025 by the authors. Licensee MDPI, Basel, Switzerland. This article is an open access article distributed under the terms and conditions of the Creative Commons Attribution (CC BY) license (https://creativecommons.org/licenses/by/4.0/).
Share and Cite
Tosun, S.; Torun, R.; Kinci, M.F.; Aksun, S.; Sengul, M. Comparison of Maternal Serum Neuropilin-1 (NRP-1) and Fetal Cord Blood NRP-1 Concentrations in Between Normotensive Pregnant Women and Those with Preeclampsia. J. Clin. Med. 2025, 14, 3718. https://doi.org/10.3390/jcm14113718
Tosun S, Torun R, Kinci MF, Aksun S, Sengul M. Comparison of Maternal Serum Neuropilin-1 (NRP-1) and Fetal Cord Blood NRP-1 Concentrations in Between Normotensive Pregnant Women and Those with Preeclampsia. Journal of Clinical Medicine. 2025; 14(11):3718. https://doi.org/10.3390/jcm14113718
Chicago/Turabian StyleTosun, Simge, Raziye Torun, Mehmet Ferdi Kinci, Saliha Aksun, and Mustafa Sengul. 2025. "Comparison of Maternal Serum Neuropilin-1 (NRP-1) and Fetal Cord Blood NRP-1 Concentrations in Between Normotensive Pregnant Women and Those with Preeclampsia" Journal of Clinical Medicine 14, no. 11: 3718. https://doi.org/10.3390/jcm14113718
APA StyleTosun, S., Torun, R., Kinci, M. F., Aksun, S., & Sengul, M. (2025). Comparison of Maternal Serum Neuropilin-1 (NRP-1) and Fetal Cord Blood NRP-1 Concentrations in Between Normotensive Pregnant Women and Those with Preeclampsia. Journal of Clinical Medicine, 14(11), 3718. https://doi.org/10.3390/jcm14113718