
Pulmonary Function and Nocturnal Hypoxemia Patterns in Patients with Obstructive Sleep Apnea

 , ,
, ,
Abstract
1. Introduction
2. Materials and Methods
3. Results
4. Discussion
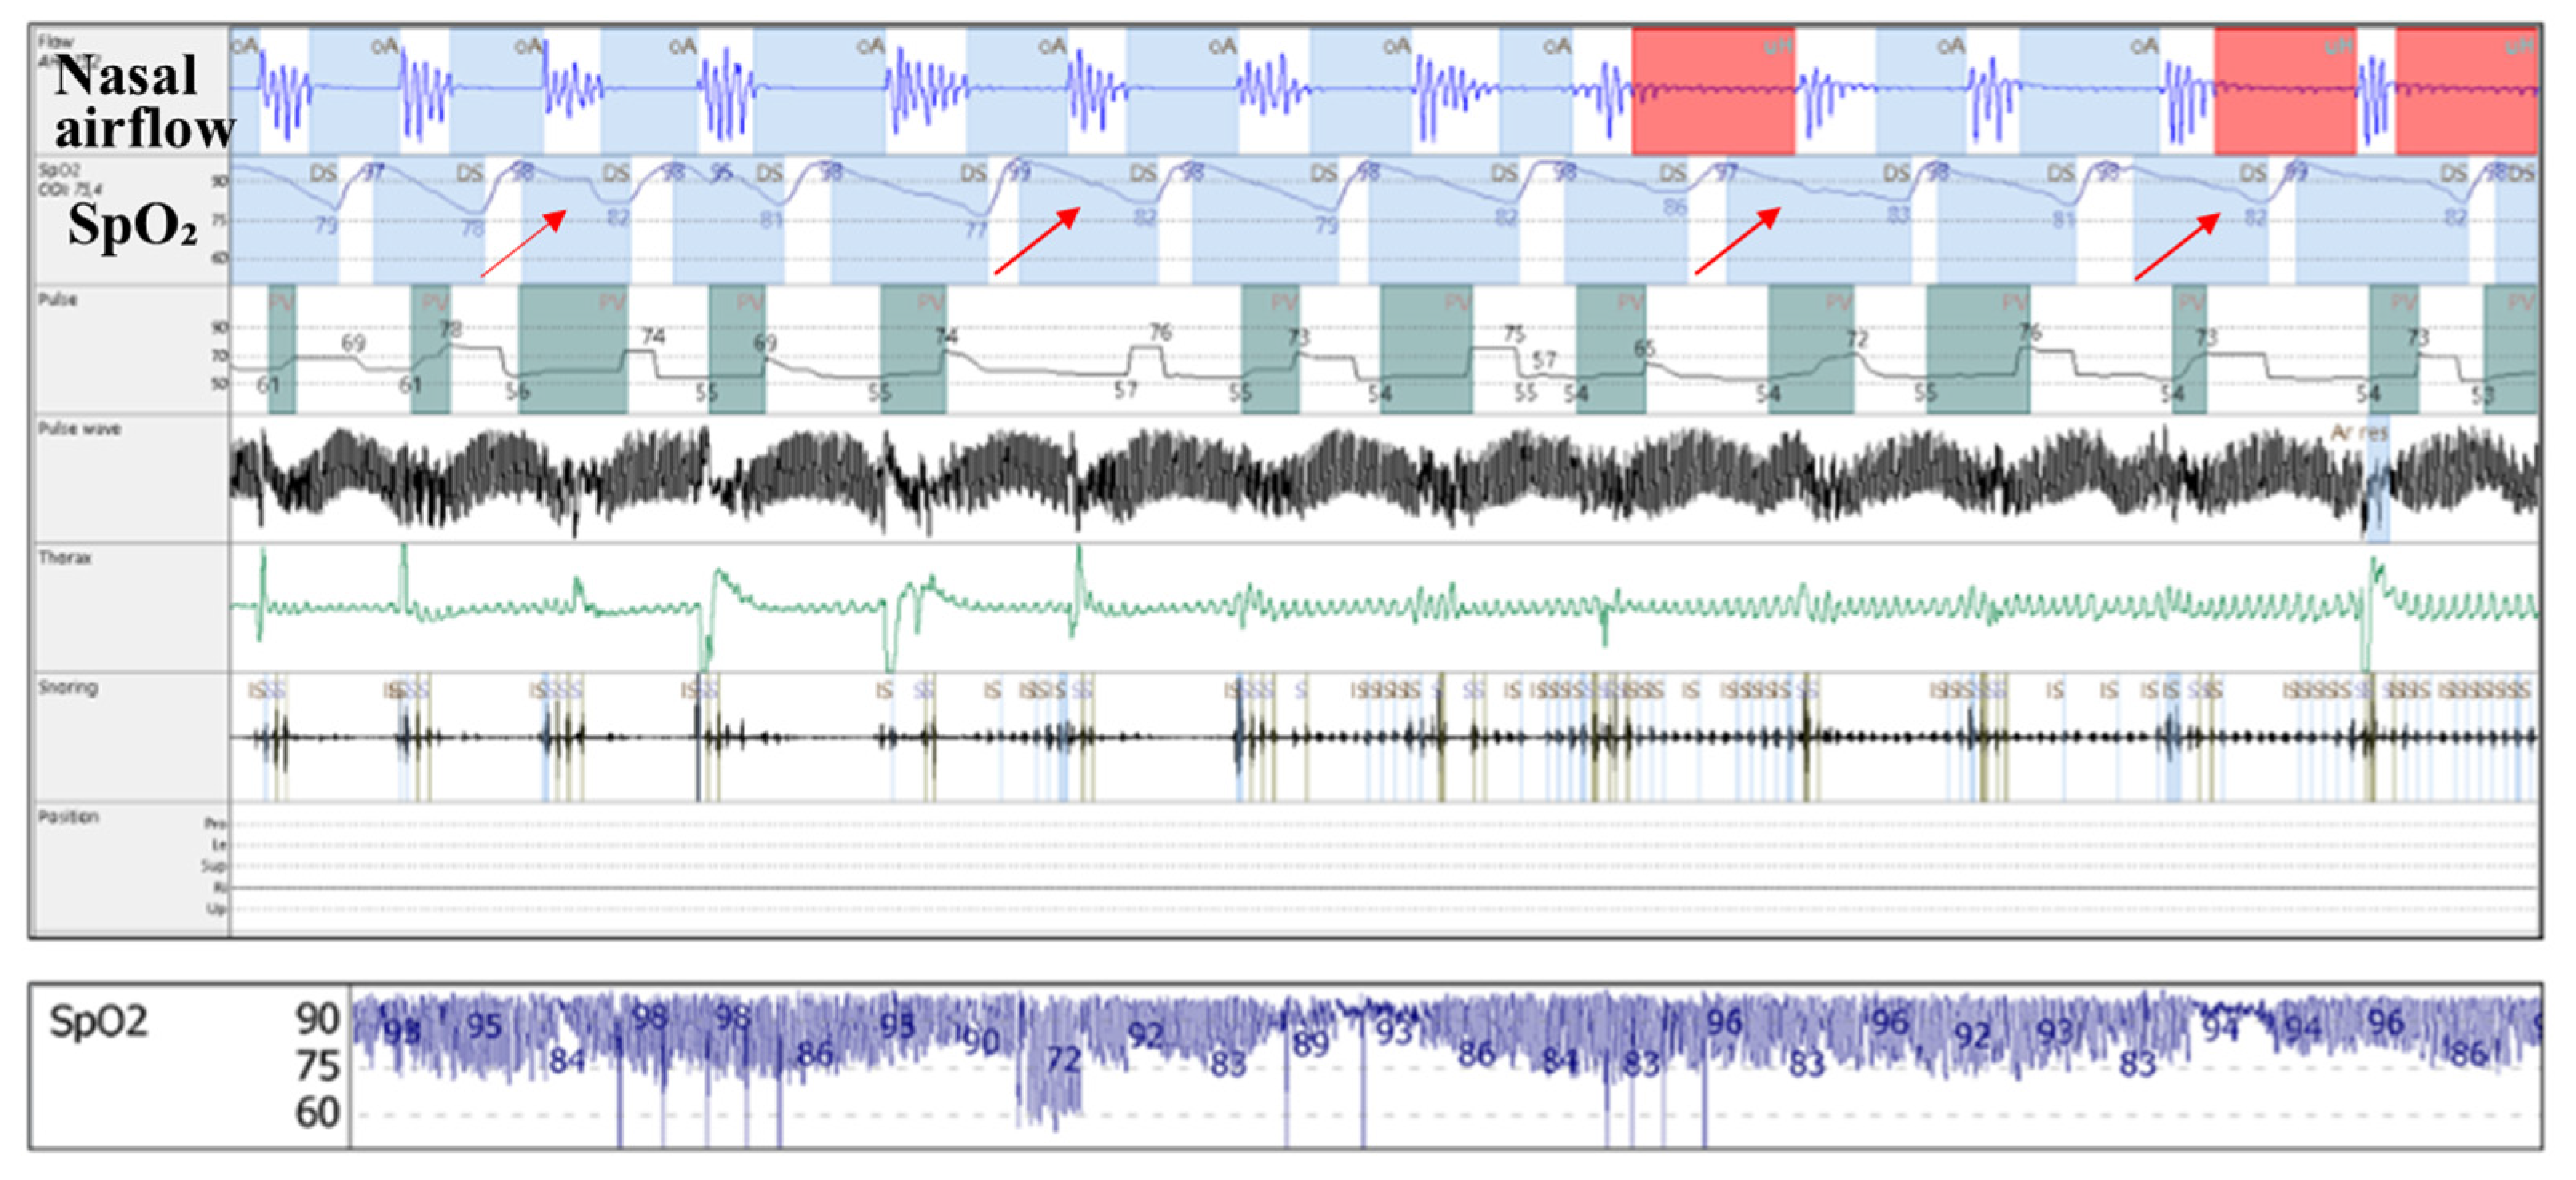
- (a)
- Increased upper airway flow limitation, due to peripharyngeal adipose tissue accumulation, is responsible for the development of obstructive respiratory events. It is also a contributing factor to event severity (hypopnea or apnea), frequency, and duration [3]. This leads to a characteristic intermittent (saw-tooth) hypoxemia pattern (Figure 3), consisting of intermittent drops and recoveries in oxyhaemoglobin saturation. This is directly quantified using ODI3 and contributes to lower nocturnal oxyhaemoglobin saturation levels (quantified in our study using avgSpO2 and t90).
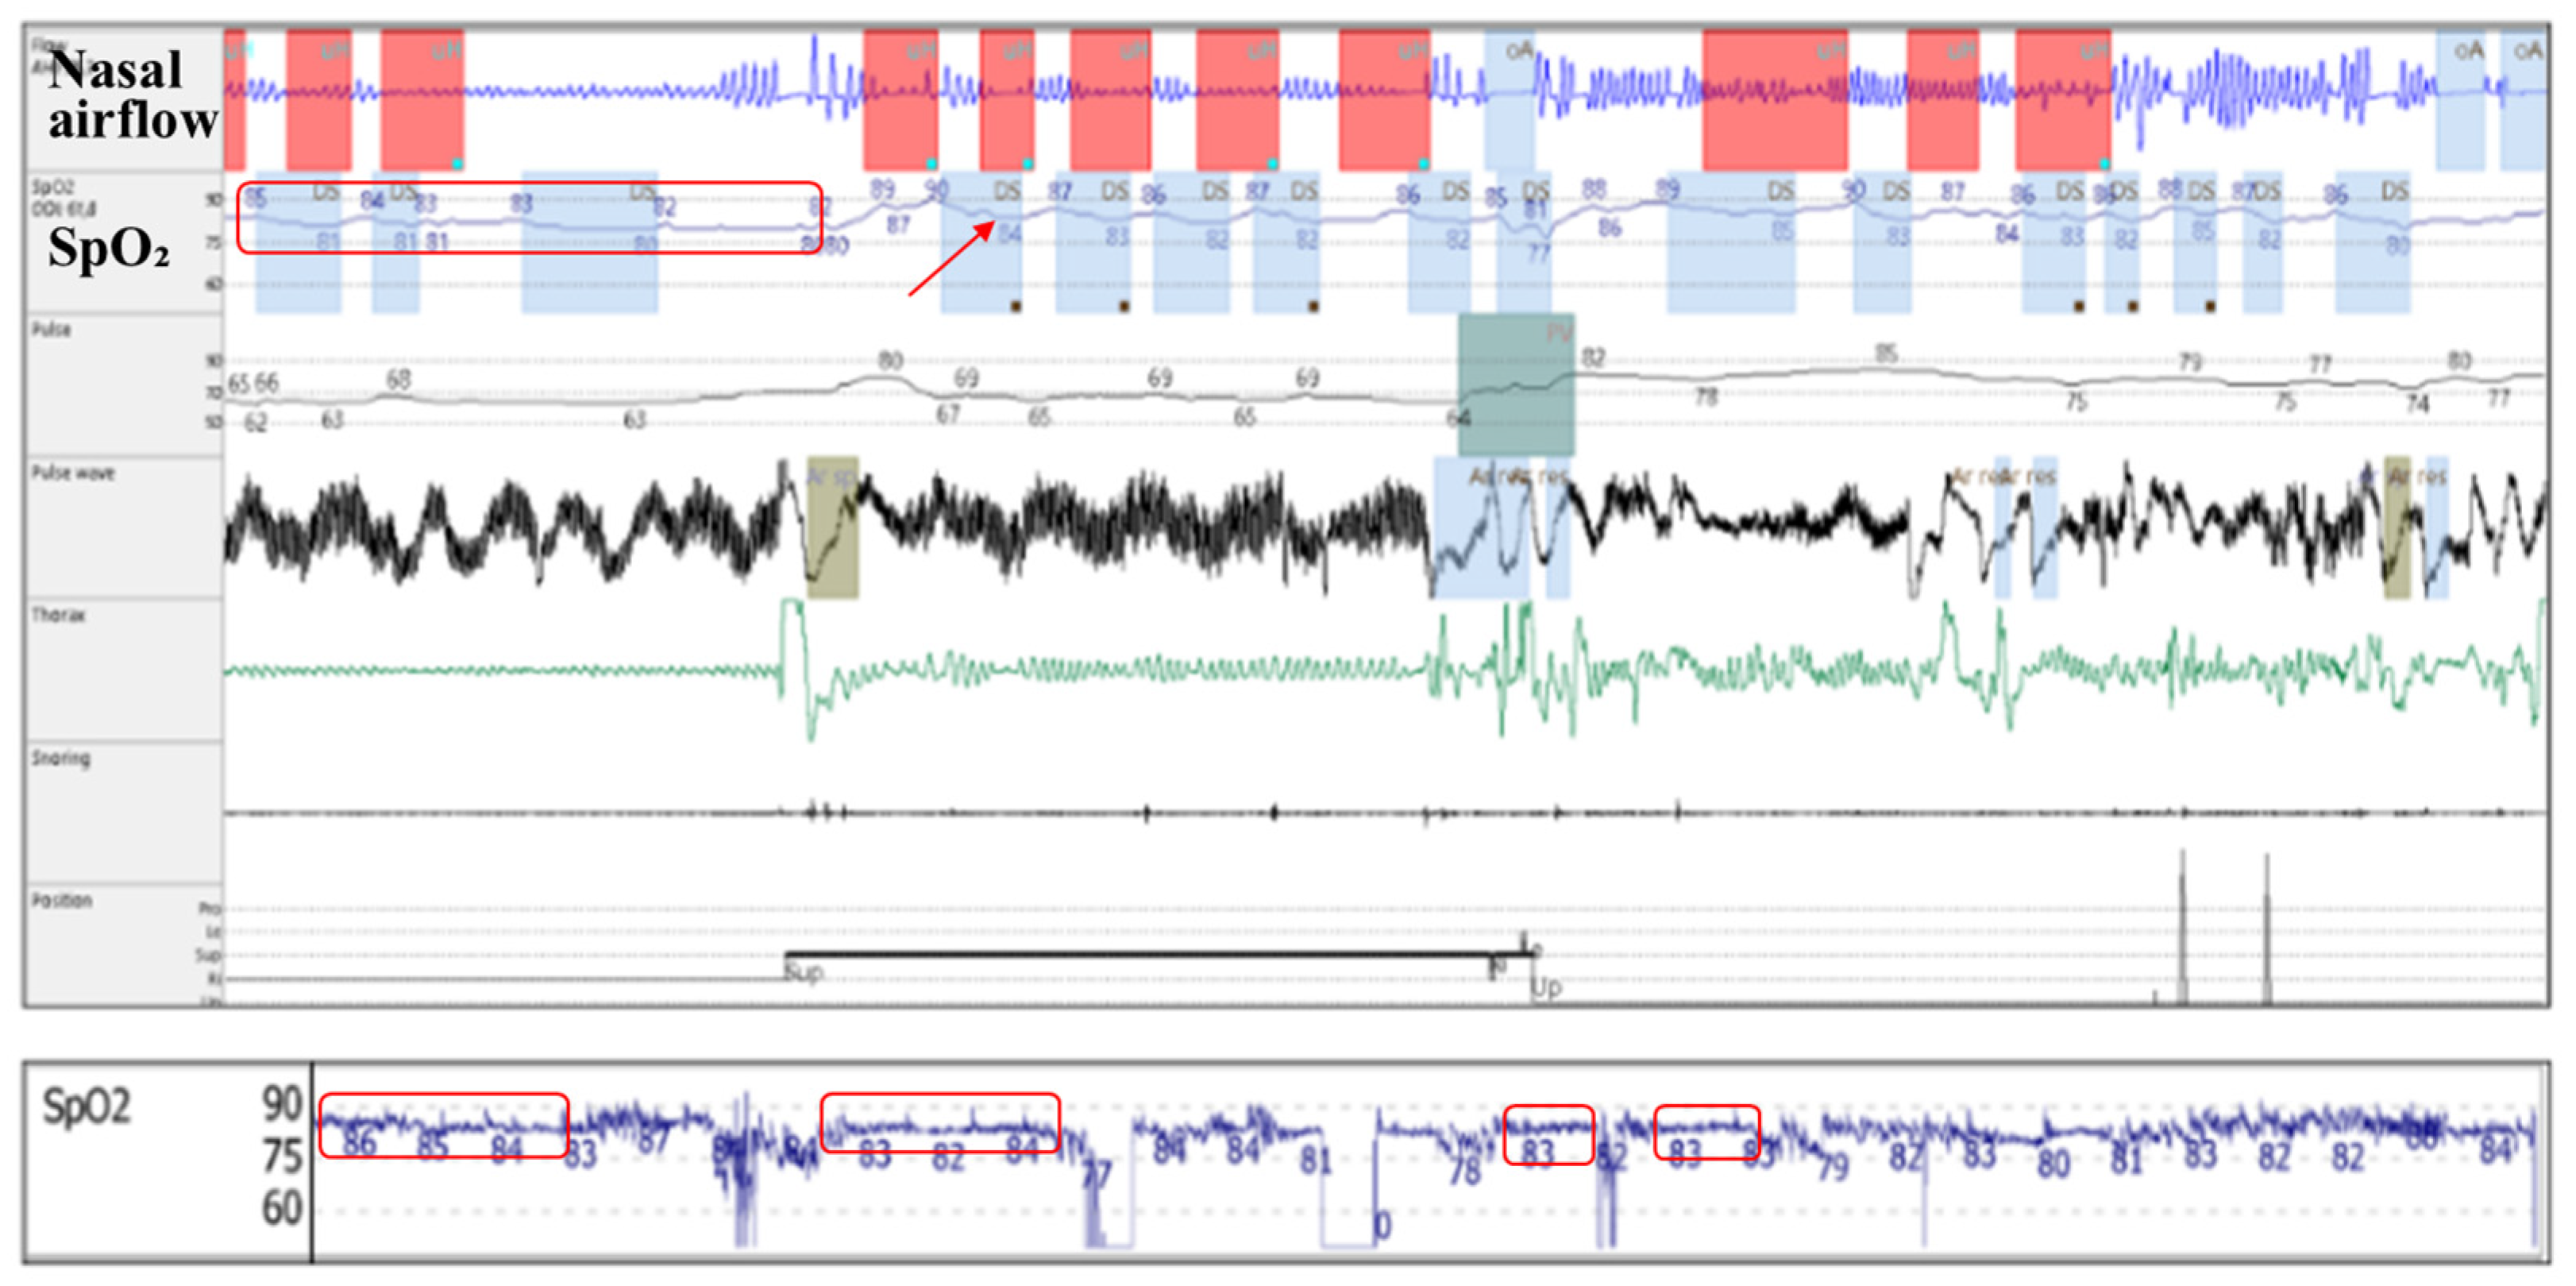
- (b)
- Reduced diaphragmatic excursions, impaired chest wall compliance, and airway closure in the dependent zones of the lungs, as observed in obese patients and more severely in supine position and REM (rapid eye movement) sleep, contribute to alveolar hypoventilation, resulting in low oxyhaemoglobin saturation levels [26,27,28], with a continuous (plateau) hypoxemia pattern (Figure 4). Nocturnal hypoventilation with consecutive continuous hypoxemia and intermittent desaturations (specific to OSA) both contribute to a low avgSpO2 and a high t90.
5. Conclusions
Author Contributions
Funding
Institutional Review Board Statement
Informed Consent Statement
Data Availability Statement
Conflicts of Interest
References
- Melo, L.C.; Silva, M.A.M.D.; Calles, A.C.D.N. Obesity and lung function: A systematic review. Einstein 2014, 12, 120–125. [Google Scholar] [CrossRef] [PubMed]
- Singh, S.; Khan, S.; Singh, D.; Verma, S.; Talwar, A. The uses of overnight pulse oximetry. Lung India 2020, 37, 151. [Google Scholar] [CrossRef] [PubMed]
- Pahkala, R.; Seppä, J.; Ikonen, A.; Smirnov, G.; Tuomilehto, H. The impact of pharyngeal fat tissue on the pathogenesis of obstructive sleep apnea. Sleep Breath 2014, 18, 275–282. [Google Scholar] [CrossRef] [PubMed]
- Gell, L.K.; Vena, D.; Alex, R.M.; Azarbarzin, A.; Calianese, N.; Hess, L.B.; Taranto-Montemurro, L.; White, D.P.; Wellman, A.; Sands, S.A. Neural ventilatory drive decline as a predominant mechanism of obstructive sleep apnoea events. Thorax 2022, 77, 707–716. [Google Scholar] [CrossRef]
- Shetty, S.; Parthasarathy, S. Obesity hypoventilation syndrome. Curr. Pulmonol. Rep. 2015, 4, 42–55. [Google Scholar] [CrossRef]
- Elliot, J.G.; Donovan, G.M.; Wang, K.C.W.; Green, F.H.Y.; James, A.L.; Noble, P.B. Fatty airways: Implications for obstructive disease. Eur. Respir. J. 2019, 54, 1900857. [Google Scholar] [CrossRef] [PubMed]
- Vicente, E.; Marin, J.M.; Carrizo, S.J.; Osuna, C.S.; González, R.; Marin-Oto, M.; Forner, M.; Vicente, P.; Cubero, P.; Gil, A.V.; et al. Upper airway and systemic inflammation in obstructive sleep apnoea. Eur. Respir. J. 2016, 48, 1108–1117. [Google Scholar] [CrossRef]
- Palma, G.; Sorice, G.P.; Genchi, V.A.; Giordano, F.; Caccioppoli, C.; D’Oria, R.; Marrano, N.; Biondi, G.; Giorgino, F.; Perrini, S. Adipose Tissue Inflammation and Pulmonary Dysfunction in Obesity. Int. J. Mol. Sci. 2022, 23, 7349. [Google Scholar] [CrossRef]
- Shaker, S.B.; Stavngaard, T.; Hestad, M.; Bach, K.S.; Tonnesen, P.; Dirksen, A. The extent of emphysema in patients with COPD. Clin. Respir. J. 2009, 3, 15–21. [Google Scholar] [CrossRef]
- Rodríguez-Roisin, R.; Drakulovic, M.; Rodríguez, D.A.; Roca, J.; Barberà, J.A.; Wagner, P.D. Ventilation-perfusion imbalance and chronic obstructive pulmonary disease staging severity. J. Appl. Physiol. 2009, 106, 1902–1908. [Google Scholar] [CrossRef]
- Budhiraja, R.; Siddiqi, T.A.; Quan, S.F. Sleep Disorders in Chronic Obstructive Pulmonary Disease: Etiology, Impact, and Management. J. Clin. Sleep Med. 2015, 11, 259–270. [Google Scholar] [CrossRef] [PubMed]
- Sanchez-Azofra, A.; Gu, W.; Masso-Silva, J.A.; Sanz-Rubio, D.; Marin-Oto, M.; Cubero, P.; Gil, A.V.; Moya, E.A.; Barnes, L.A.; Mesarwi, O.A.; et al. Inflammation biomarkers in OSA, chronic obstructive pulmonary disease, and chronic obstructive pulmonary disease/OSA overlap syndrome. J. Clin. Sleep Med. 2023, 19, 1447–1456. [Google Scholar] [CrossRef] [PubMed]
- Vaidya, S.; Gothi, D.; Patro, M. COPD sleep phenotypes: Genesis of respiratory failure in COPD. Monaldi Arch. Chest Dis. 2021, 92, 1776. [Google Scholar] [CrossRef]
- Monda, V.M.; Gentile, S.; Porcellati, F.; Satta, E.; Fucili, A.; Monesi, M.; Strollo, F. Heart Failure with Preserved Ejection Fraction and Obstructive Sleep Apnea: A Novel Paradigm for Additional Cardiovascular Benefit of SGLT2 Inhibitors in Subjects with or Without Type 2 Diabetes. Adv. Ther. 2022, 39, 4837–4846. [Google Scholar] [CrossRef]
- Polecka, A.; Olszewska, N.; Danielski, Ł.; Olszewska, E. Association Between Obstructive Sleep Apnea and Heart Failure in Adults—A Systematic Review. J. Clin. Med. 2023, 12, 6139. [Google Scholar] [CrossRef] [PubMed]
- Esteban-Amarilla, C.; Martin-Bote, S.; Jurado-Garcia, A.; Palomares-Muriana, A.; Feu-Collado, N.; Jurado-Gamez, B. Usefulness of Home Overnight Pulse Oximetry in Patients with Suspected Sleep-Disordered Breathing. Can. Respir. J. 2020, 2020, 1891285. [Google Scholar] [CrossRef]
- Scott, A.S.; Baltzan, M.A.; Wolkove, N. Examination of Pulse Oximetry Tracings to Detect Obstructive Sleep Apnea in Patients with Advanced Chronic Obstructive Pulmonary Disease. Can. Respir. J. 2014, 21, 171–175. [Google Scholar] [CrossRef]
- Koivumäki, V.; Maasilta, P.; Bachour, A. Oximetry Monitoring Recommended During PAP Initiation for Sleep Apnea in Patients With Obesity or Nocturnal Hypoxemia. J. Clin. Sleep Med. 2018, 14, 1859–1863. [Google Scholar] [CrossRef]
- Radu, F.; Dumitrache-Rujinski, S.; Toma, C. Relația dintre hipoxemia nocturnă, funcția pulmonară și indexul de masă corporală la pacientul cu apnee în somn de tip obstructive. In Proceedings of the 28th National Congress of the Romanian Society of Pneumology, Sinaia, Romania, 13–16 November 2024; Media Med Publicis: Bucharest, Romania, 2024. [Google Scholar]
- Lv, R.; Liu, X.; Zhang, Y.; Dong, N.; Wang, X.; He, Y.; Yue, H.; Yin, Q. Pathophysiological mechanisms and therapeutic approaches in obstructive sleep apnea syndrome. Sig. Transduct. Target Ther. 2023, 8, 218. [Google Scholar] [CrossRef]
- Messineo, L.; Bakker, J.P.; Cronin, J.; Yee, J.; White, D.P. Obstructive sleep apnea and obesity: A review of epidemiology, pathophysiology and the effect of weight-loss treatments. Sleep Med. Rev. 2024, 78, 101996. [Google Scholar] [CrossRef]
- Peppard, P.E.; Ward, N.R.; Morrell, M.J. The Impact of Obesity on Oxygen Desaturation during Sleep-disordered Breathing. Am. J. Respir. Crit. Care Med. 2009, 180, 788–793. [Google Scholar] [CrossRef] [PubMed]
- Zhou, T.; Chen, S.; Mao, J.; Zhu, P.; Yu, X.; Lin, R. Association between obstructive sleep apnea and visceral adiposity index and lipid accumulation product: NHANES 2015–2018. Lipids Health Dis. 2024, 23, 100. [Google Scholar] [CrossRef] [PubMed]
- Wang, D.; Chen, Y.; Ding, Y.; Tang, Y.; Su, X.; Li, S.; Zhang, H.; Zhou, Y.; Zhuang, Z.; Gan, Q.; et al. Application Value of Cardiometabolic Index for the Screening of Obstructive Sleep Apnea with or Without Metabolic Syndrome. Nat. Sci. Sleep 2024, 16, 177–191. [Google Scholar] [CrossRef] [PubMed]
- Day, K.; Nguo, K.; Edwards, B.A.; O’Driscoll, D.M.; Young, A.C.; Haines, T.P.; Hamilton, G.S.; Ghazi, L.; Bristow, C.; Truby, H. Body composition changes and their relationship with obstructive sleep apnoea symptoms, severity: The Sleeping Well Trial. Clin. Nutr. 2023, 42, 1661–1670. [Google Scholar] [CrossRef]
- Sivam, S.; Yee, B.; Wong, K.; Wang, D.; Grunstein, R.; Piper, A. Obesity Hypoventilation Syndrome: Early Detection of Nocturnal-Only Hypercapnia in an Obese Population. J. Clin. Sleep Med. 2018, 14, 1477–1484. [Google Scholar] [CrossRef]
- Lin, C.; Lin, C. Work of breathing and respiratory drive in obesity. Respirology 2012, 17, 402–411. [Google Scholar] [CrossRef]
- Bordoni, B.; Escher, A.R. Obesity and the Importance of Breathing. Cureus 2025, 17, e77431. [Google Scholar] [CrossRef]
- Labarca, G.; Dreyse, J.; Salas, C.; Letelier, F.; Schmidt, A.; Rivera, F.; Jorquera, J. Clinical utility of oximetric parameters to identify a high-risk phenotype of moderate-severe Obstructive Sleep Apnea (OSA). Clin. Respir. J. 2020, 14, 1166–1175. [Google Scholar] [CrossRef]
- Dixon, A.E.; Peters, U. The effect of obesity on lung function. Expert Rev. Respir. Med. 2018, 12, 755–767. [Google Scholar] [CrossRef]
- Wang, C.J.; Noble, P.B.; Elliot, J.G.; Choi, Y.S.; James, A.L.; Wang, K.C.W. Distribution, composition, and activity of airway-associated adipose tissue in the porcine lung. Am. J. Physiol. Lung Cell. Mol. Physiol. 2023, 324, L179–L189. [Google Scholar] [CrossRef]
- Ramsey, R.; Mehra, R.; Strohl, K.P. Variations in Physician Interpretation of Overnight Pulse Oximetry Monitoring. Chest 2007, 132, 852–859. [Google Scholar] [CrossRef] [PubMed]

| Study Population (n = 76) | Mean (SD) | Median (25th, 75th) |
|---|---|---|
| ▪ Age (years) | 59 (11) | 62 (53, 68) |
| ▪ BMI (kg/m2) | 36 (6) | 35 (32, 39) |
| ▪ avgSpO2 (%) | 91.1 (3.4) | 92 (89, 93) |
| ▪ t90 (%) | 23.9 (25) | 13 (3.3, 45.7) |
| ▪ ODI3 (events/h) | 46 (25) | 42 (26, 58) |
| ▪ FEV1 (% of predicted value) | 85.3 (20.5) | 88.2 (67.4, 102) |
| Variable | Group A (n = 62) | Group B (n = 14) | |
|---|---|---|---|
| ▪ Age (years) | Mean (SD) | 58 (12) | 64 (7) |
| Median (25th, 75th) | 60 (51, 67) | 67 (59, 68) | |
| ▪ BMI (kg/m2) | Mean (SD) | 36 (6) | 37 (5) |
| Median (25th, 75th) | 35 (31, 38) | 35 (34, 40) | |
| ▪ avgSpO2 (%) | Mean (SD) | 91.3 (3.6) | 90.3 (2.5) |
| Median (25th, 75th) | 92.2 (90, 94) | 91 (89, 92) | |
| ▪ t90 (%) | Mean (SD) | 22.3 (24.7) | 31 (26.1) |
| Median (25th, 75th) | 11.5 (3, 33.5) | 24.8 (5.3, 50) | |
| ▪ ODI3 (events/h) | Mean (SD) | 47 (26) | 43 (20) |
| Median (25th, 75th) | 43 (25, 58) | 40 (30, 49) | |
| ▪ FEV1 (% of predicted value) | Mean (SD) | 89.5 (18.7) | 66.5 (18.1) |
| Median (25th, 75th) | 92.1 (76.8, 104.5) | 62.5 (50.2, 84) |
Disclaimer/Publisher’s Note: The statements, opinions and data contained in all publications are solely those of the individual author(s) and contributor(s) and not of MDPI and/or the editor(s). MDPI and/or the editor(s) disclaim responsibility for any injury to people or property resulting from any ideas, methods, instructions or products referred to in the content. |
© 2025 by the authors. Licensee MDPI, Basel, Switzerland. This article is an open access article distributed under the terms and conditions of the Creative Commons Attribution (CC BY) license (https://creativecommons.org/licenses/by/4.0/).
Share and Cite
Toma, C.L.; Radu, F.; Zaharia, D.-C.; Belaconi, I.; Dumitrache-Rujinski, S. Pulmonary Function and Nocturnal Hypoxemia Patterns in Patients with Obstructive Sleep Apnea. J. Clin. Med. 2025, 14, 3589. https://doi.org/10.3390/jcm14103589
Toma CL, Radu F, Zaharia D-C, Belaconi I, Dumitrache-Rujinski S. Pulmonary Function and Nocturnal Hypoxemia Patterns in Patients with Obstructive Sleep Apnea. Journal of Clinical Medicine. 2025; 14(10):3589. https://doi.org/10.3390/jcm14103589
Chicago/Turabian StyleToma, Claudia Lucia, Filip Radu, Dragos-Cosmin Zaharia, Ionela Belaconi, and Stefan Dumitrache-Rujinski. 2025. "Pulmonary Function and Nocturnal Hypoxemia Patterns in Patients with Obstructive Sleep Apnea" Journal of Clinical Medicine 14, no. 10: 3589. https://doi.org/10.3390/jcm14103589
APA StyleToma, C. L., Radu, F., Zaharia, D.-C., Belaconi, I., & Dumitrache-Rujinski, S. (2025). Pulmonary Function and Nocturnal Hypoxemia Patterns in Patients with Obstructive Sleep Apnea. Journal of Clinical Medicine, 14(10), 3589. https://doi.org/10.3390/jcm14103589