
CT-Based Evaluation of Hounsfield Units—A Novel Screening Tool for Undiagnosed Osteoporosis in Patients with Fragility Fractures of the Pelvis

 , , , , and
Abstract
1. Introduction
2. Results
3. Discussion
4. Materials and Methods
5. Conclusions
Author Contributions
Funding
Institutional Review Board Statement
Informed Consent Statement
Data Availability Statement
Conflicts of Interest
References
- Osteoporosis WSGotPaMo Report of a WHO Scientific Group Prevention Management of Osteoporosis; World Health Organization: Geneva, Switzerland, 2000; Volume S2.
- Johnell, O.; Kanis, J.A. An estimate of the worldwide prevalence and disability associated with osteoporotic fractures. Osteoporos. Int. 2006, 17, 1726–1733. [Google Scholar] [CrossRef] [PubMed]
- Ensrud, K.E.; Ewing, S.K.; Taylor, B.C.; Fink, H.A.; Stone, K.L.; Cauley, J.A.; Tracy, J.K.; Hochberg, M.C.; Rodondi, N.; Cawthon, P.M.; et al. Frailty and risk of falls, fracture, and mortality in older women: The study of osteoporotic fractures. J. Gerontol. A Biol. Sci. Med. Sci. 2007, 62, 744–751. [Google Scholar] [CrossRef] [PubMed]
- Kanis, J.A.; Johnell, O. The burden of osteoporosis. J. Endocrinol. Investig. 1999, 22, 583–588. [Google Scholar] [CrossRef] [PubMed]
- Rollmann, M.F.; Herath, S.C.; Kirchhoff, F.; Braun, B.J.; Holstein, J.H.; Pohlemann, T.; Menger, M.D.; Histing, T. Pelvic ring fractures in the elderly now and then—A pelvic registry study. Arch. Gerontol. Geriatr. 2017, 71, 83–88. [Google Scholar] [CrossRef]
- Fuchs, T.; Rottbeck, U.; Hofbauer, V.; Raschke, M.; Stange, R. Pelvic ring fractures in the elderly. Underestimated osteoporotic fracture. Unfallchirurg 2011, 114, 663–670. [Google Scholar] [CrossRef]
- Rommens, P.M.; Hofmann, A. Comprehensive classification of fragility fractures of the pelvic ring: Recommendations for surgical treatment. Injury 2013, 44, 1733–1744. [Google Scholar] [CrossRef]
- Gleich, J.; Kussmaul, A.C.; Steiner, E.; Bocker, W.; Neuerburg, C.; Linhart, C. High prevalence of missed information related on bone health in orthogeriatric patients with fragility fractures of the pelvis—An institutional register-based analysis. Osteoporos. Int. 2022, 33, 901–907. [Google Scholar] [CrossRef]
- Morgan, S.L.; Prater, G.L. Quality in dual-energy X-ray absorptiometry scans. Bone 2017, 104, 13–28. [Google Scholar] [CrossRef]
- Gupta, M.J.; Shah, S.; Peterson, S.; Baim, S. Rush Fracture Liaison Service for capturing “missed opportunities” to treat osteoporosis in patients with fragility fractures. Osteoporos. Int. 2018, 29, 1861–1874. [Google Scholar] [CrossRef]
- Oberkircher, L.; Ruchholtz, S.; Rommens, P.M.; Hofmann, A.; Bücking, B.; Krüger, A. Osteoporotic Pelvic Fractures. Dtsch. Arztebl. Int. 2018, 115, 70–80. [Google Scholar] [CrossRef]
- Hoel, R.J.; Ledonio, C.G.; Takahashi, T.; Polly, D.W., Jr. Sacral bone mineral density (BMD) assessment using opportunistic CT scans. J. Orthop. Res. 2017, 35, 160–166. [Google Scholar] [CrossRef] [PubMed]
- Wagner, D.; Ossendorf, C.; Gruszka, D.; Hofmann, A.; Rommens, P.M. Fragility fractures of the sacrum: How to identify and when to treat surgically? Eur. J. Trauma Emerg. Surg. 2015, 41, 349–362. [Google Scholar] [CrossRef] [PubMed]
- Hiyama, A.; Sakai, D.; Katoh, H.; Sato, M.; Watanabe, M. Hounsfield Unit Values as an Adjunct Diagnostic Tool: Investigating Its Relationship with Bone Mineral Density and Vertebral Bone Quality in Lumbar Degenerative Disease Patients. World Neurosurg. 2024, 183, e722–e729. [Google Scholar] [CrossRef] [PubMed]
- Wang, X.; Zhao, W.; Chen, X.; Zhang, P.; Zhou, Z.; Yan, X.; Song, Z.; Lin, S.; Chen, W.; Shang, Q.; et al. Correlation of Hounsfield Units with Bone Mineral Density and T-Score in Chinese Adults. World Neurosurg. 2024, 183, e261–e267. [Google Scholar] [CrossRef]
- Zou, D.; Li, W.; Xu, F.; Du, G. Use of Hounsfield units of S1 body to diagnose osteoporosis in patients with lumbar degenerative diseases. Neurosurg. Focus 2019, 46, E6. [Google Scholar] [CrossRef]
- Flanigan, P.M.; Mikula, A.L.; Peters, P.A.; Oushy, S.; Fogelson, J.L.; Bydon, M.; Freedman, B.A.; Sebastian, A.S.; Currier, B.L.; Nassr, A.; et al. Regional improvements in lumbosacropelvic Hounsfield units following teriparatide treatment. Neurosurg. Focus 2020, 49, E11. [Google Scholar] [CrossRef]
- Schonenberg, D.; Guggenberger, R.; Frey, D.; Pape, H.C.; Simmen, H.P.; Osterhoff, G. CT-based evaluation of volumetric bone density in fragility fractures of the pelvis-a matched case-control analysis. Osteoporos. Int. 2018, 29, 459–465. [Google Scholar] [CrossRef]
- Wagner, D.; Kamer, L.; Sawaguchi, T.; Richards, R.G.; Noser, H.; Rommens, P.M. Sacral Bone Mass Distribution Assessed by Averaged Three-Dimensional CT Models: Implications for Pathogenesis and Treatment of Fragility Fractures of the Sacrum. J. Bone Jt. Surg. Am. 2016, 98, 584–590. [Google Scholar] [CrossRef]
- Cetik, R.M.; Crawford, C.H., 3rd; Glassman, S.D.; Dimar, J.R.; Gum, J.L., 2nd; Djurasovic, M.; Carreon, L.Y. Accuracy of Phantomless Calibration of Routine Computed Tomography Scans for Opportunistic Osteoporosis Screening in the Spine Clinic. Spine 2025, 50, E142–E150. [Google Scholar] [CrossRef]
- Davidson, S.; Vecellio, A.; Flagstad, I.; Holton, K.; Bruzina, A.; Lender, P.; Trost, S.; Polly, D. Discrepancy between DXA and CT-based assessment of spine bone mineral density. Spine Deform. 2023, 11, 677–683. [Google Scholar] [CrossRef]
- Graul, I.; Marintschev, I.; Hackenbroch, C.; Palm, H.G.; Friemert, B.; Lang, P. Modified therapy concepts for fragility fractures of the pelvis after additional MRI. PLoS ONE 2020, 15, e0238773. [Google Scholar] [CrossRef] [PubMed]
- Faust, L.M.; Keppler, A.M.; Suero, E.; Gleich, J.; Lisitano, L.; Bocker, W.; Neuerburg, C.; Pfeufer, D. The grade of instability in fragility fractures of the pelvis correlates with impaired early mobilization. Eur. J. Trauma Emerg. Surg. 2022, 48, 4053–4060. [Google Scholar] [CrossRef] [PubMed]
- Rommens, P.M.; Arand, C.; Hofmann, A.; Wagner, D. When and How to Operate Fragility Fractures of the Pelvis? Indian J. Orthop. 2019, 53, 128–137. [Google Scholar] [CrossRef]
- Wang, N.; Chen, Y.; Ji, J.; Chang, J.; Yu, S.; Yu, B. The relationship between serum vitamin D and fracture risk in the elderly: A meta-analysis. J. Orthop. Surg. Res. 2020, 15, 81. [Google Scholar] [CrossRef] [PubMed]
- Holick, M.F.; Binkley, N.C.; Bischoff-Ferrari, H.A.; Gordon, C.M.; Hanley, D.A.; Heaney, R.P.; Murad, M.H.; Weaver, C.M. Evaluation, treatment, and prevention of vitamin D deficiency: An Endocrine Society clinical practice guideline. J. Clin. Endocrinol. Metab. 2011, 96, 1911–1930. [Google Scholar] [CrossRef]
- Ross, A.C.; Manson, J.E.; Abrams, S.A.; Aloia, J.F.; Brannon, P.M.; Clinton, S.K.; Durazo-Arvizu, R.A.; Gallagher, J.C.; Gallo, R.L.; Jones, G.; et al. The 2011 report on dietary reference intakes for calcium and vitamin D from the Institute of Medicine: What clinicians need to know. J. Clin. Endocrinol. Metab. 2011, 96, 53–58. [Google Scholar] [CrossRef]
- Cosman, F.; de Beur, S.J.; LeBoff, M.S.; Lewiecki, E.M.; Tanner, B.; Randall, S.; National Osteoporosis Foundation. Clinician’s Guide to Prevention and Treatment of Osteoporosis. Osteoporos. Int. 2014, 25, 2359–2381. [Google Scholar] [CrossRef]


| Age, Mean ± SD | 87.3 ± 4.5 |
| Gender, n (%) | |
| male | 93 (20.4) |
| female | 363 (79.6) |
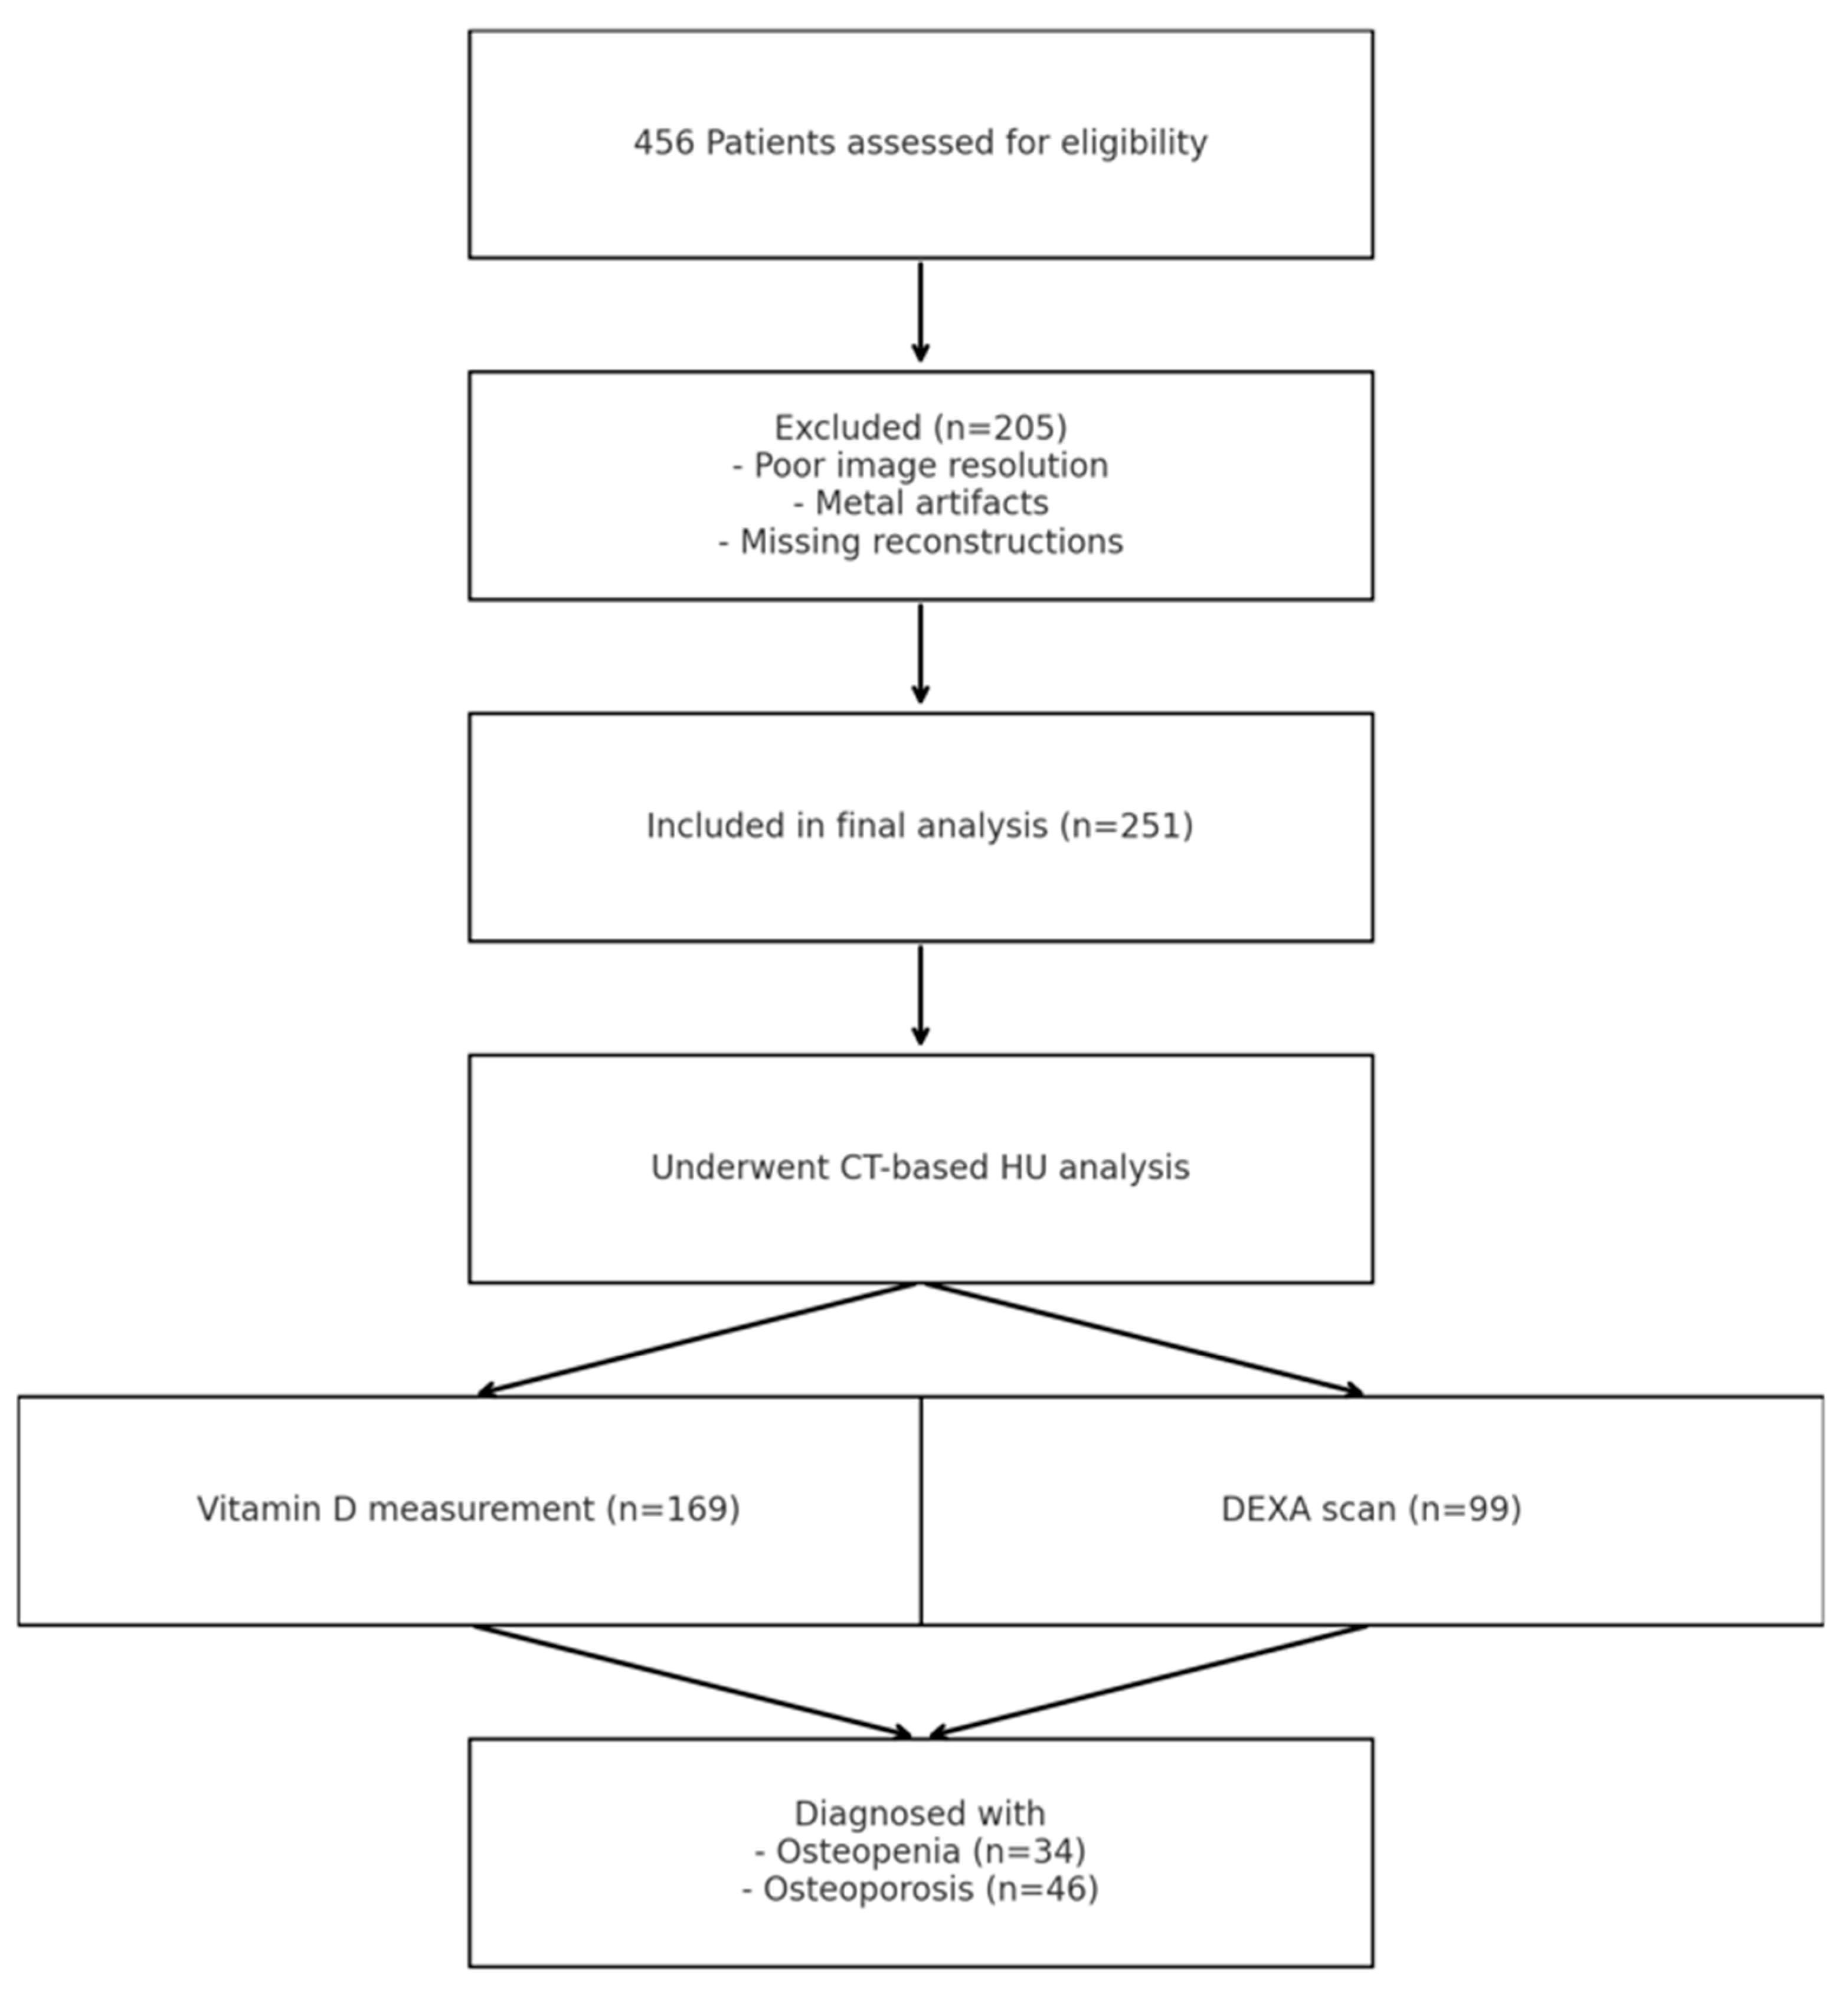
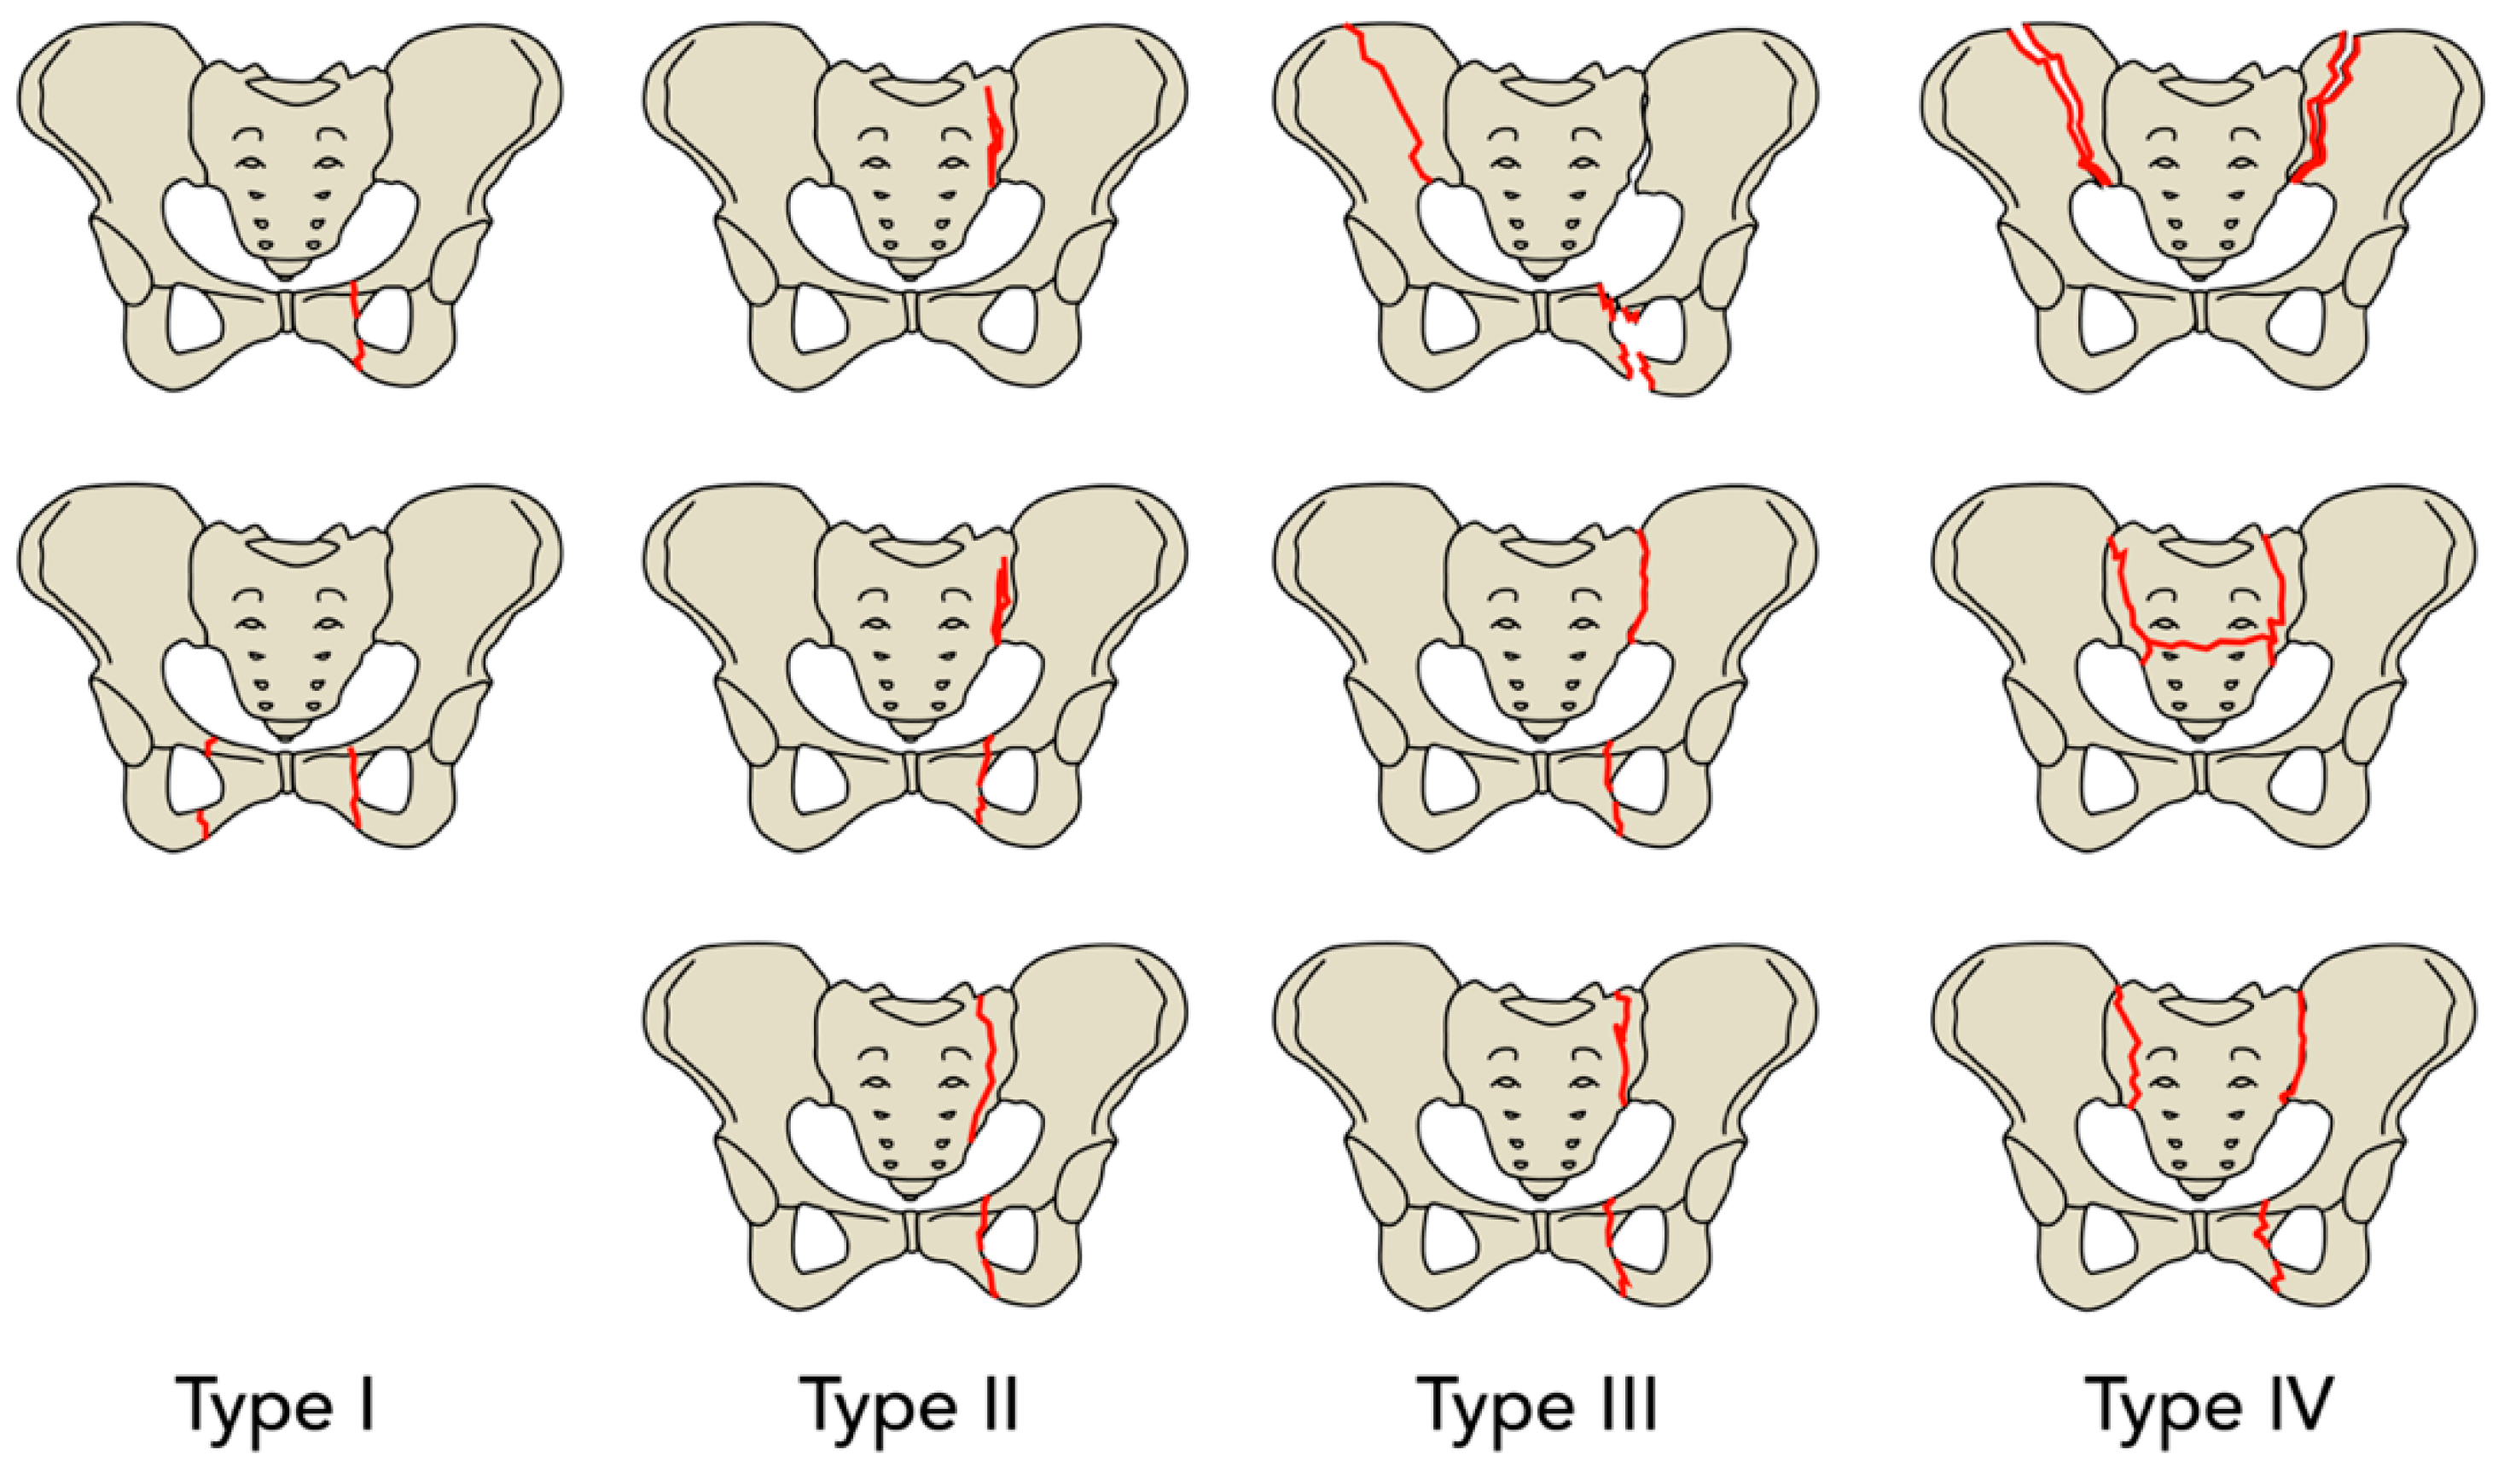
| CT based classification, n (%) | 456 (100) |
| FFP Type, n (%) | |
| I | 57 (12.5) |
| II | 304 (66.7) |
| III | 73 (16.0) |
| IV | 22 (4.8) |
| Treatment, n (%) | |
| conservative | 387 (84.9) |
| operative | 69 (15.1) |
| Previously diagnosed osteoporosis, n (%) | 67 (14.7) |
| Laboratory vitamin D measurement, n (%) | 169 (37.1) |
| Vitamin D deficiency *, n (%) | 106 (62.7) |
| (Serum 25(OH)-vitamin D | |
| level < 20 ng/mL) | |
| DEXA scan, n (%) | |
| lumbar vertebrae | 99 (21.7) |
| femoral neck | 99 (21.7) |
| Newly diagnosed osteopenia/osteoporosis *, n (%) | |
| T-Score −2.5–−1 in DEXA scan (osteopenia) | 34 (34.3) |
| T-Score ≤ −2.5 in DEXA scan (osteoporosis) | 46 (46.5) |
| Total Patients | FFP Type I n = 57 | FFP Type II n = 304 | FFP Type III n = 73 | FFP Type IV n = 22 | p-Value |
|---|---|---|---|---|---|
| conservative, n (%) | 56 (98.2) | 272 (89.5) | 50 (68.5) | 9 (40.9) | |
| operative, n (%) | 1 (1.8) | 32 (10.5) | 23 (31.5) | 13 (59.1) | < 0.001 |
| Total Patients | FFP Type I n = 57 | FFP Type II n = 304 | FFP Type III n = 73 | FFP Type IV n = 22 | p-Value |
|---|---|---|---|---|---|
| Serum 25(OH)-vitamin D level 1 (ng/mL; mean ± SD) | n = 12 | n = 112 | n = 31 | n = 14 | |
| 17.67 ± 12.95 | 14.09 ± 15.09 | 16.89 ± 15.57 | 25.92 ± 11.57 | 0.042 | |
| T-score lumbar vertebrae (mean ± SD) | n = 10 | n = 65 | n = 18 | n = 6 | |
| −1.76 ± 1.36 | −2.07 ± 1.57 | −2.69 ± 1.26 | −2.80 ± 1.13 | ns | |
| T-score femoral neck (mean ± SD) | n = 10 | n = 65 | n = 18 | n = 6 | |
| −2.19 ± 2.18 | −2.59 ± 1.16 | −2.57 ± 1.18 | −2.80 ± 0.76 | ns | |
| Alkaline phosphatase 2 (U/L; mean ± SD) | n = 19 * 111.16 ± 46.37 n = 3 ° 161.33 ± 82.86 | n = 135 * 107.16 ± 73.91 n = 31 ° 100.16 ± 44.19 | n = 36 * 117.25 ± 112.36 n = 8 ° 99.50 ± 31.64 | n = 14 * 150.57 ± 102.94 n = 2 ° 162.00 ± 69.30 | ns ns |
| Serum calcium 3 (mmol/L; mean ± SD) | n = 18 2.30 ± 0.29 | n = 149 2.36 ± 0.12 | n = 38 2.38 ± 0.12 | n = 13 2.39 ± 0.10 | ns |
| Serum phosphate 4 (mg/dL; mean ± SD) | n = 18 3.30 ± 0.86 | n = 148 3.15 ± 0.81 | n = 38 3.13 ± 0.61 | n = 13 3.13 ± 0.30 | ns |
| CT-Based HU, n (%) | 251 (55.0) | |
|---|---|---|
| Numbers of measured HU, n (%) | ||
| Corpus S1 | 251 (100) | |
| Ala S1 | 134 (53.4) | |
| Ala S1 unilateral fracture | 97 (38.6) | |
| Ala S1 bilateral fracture | 20 (8) | |
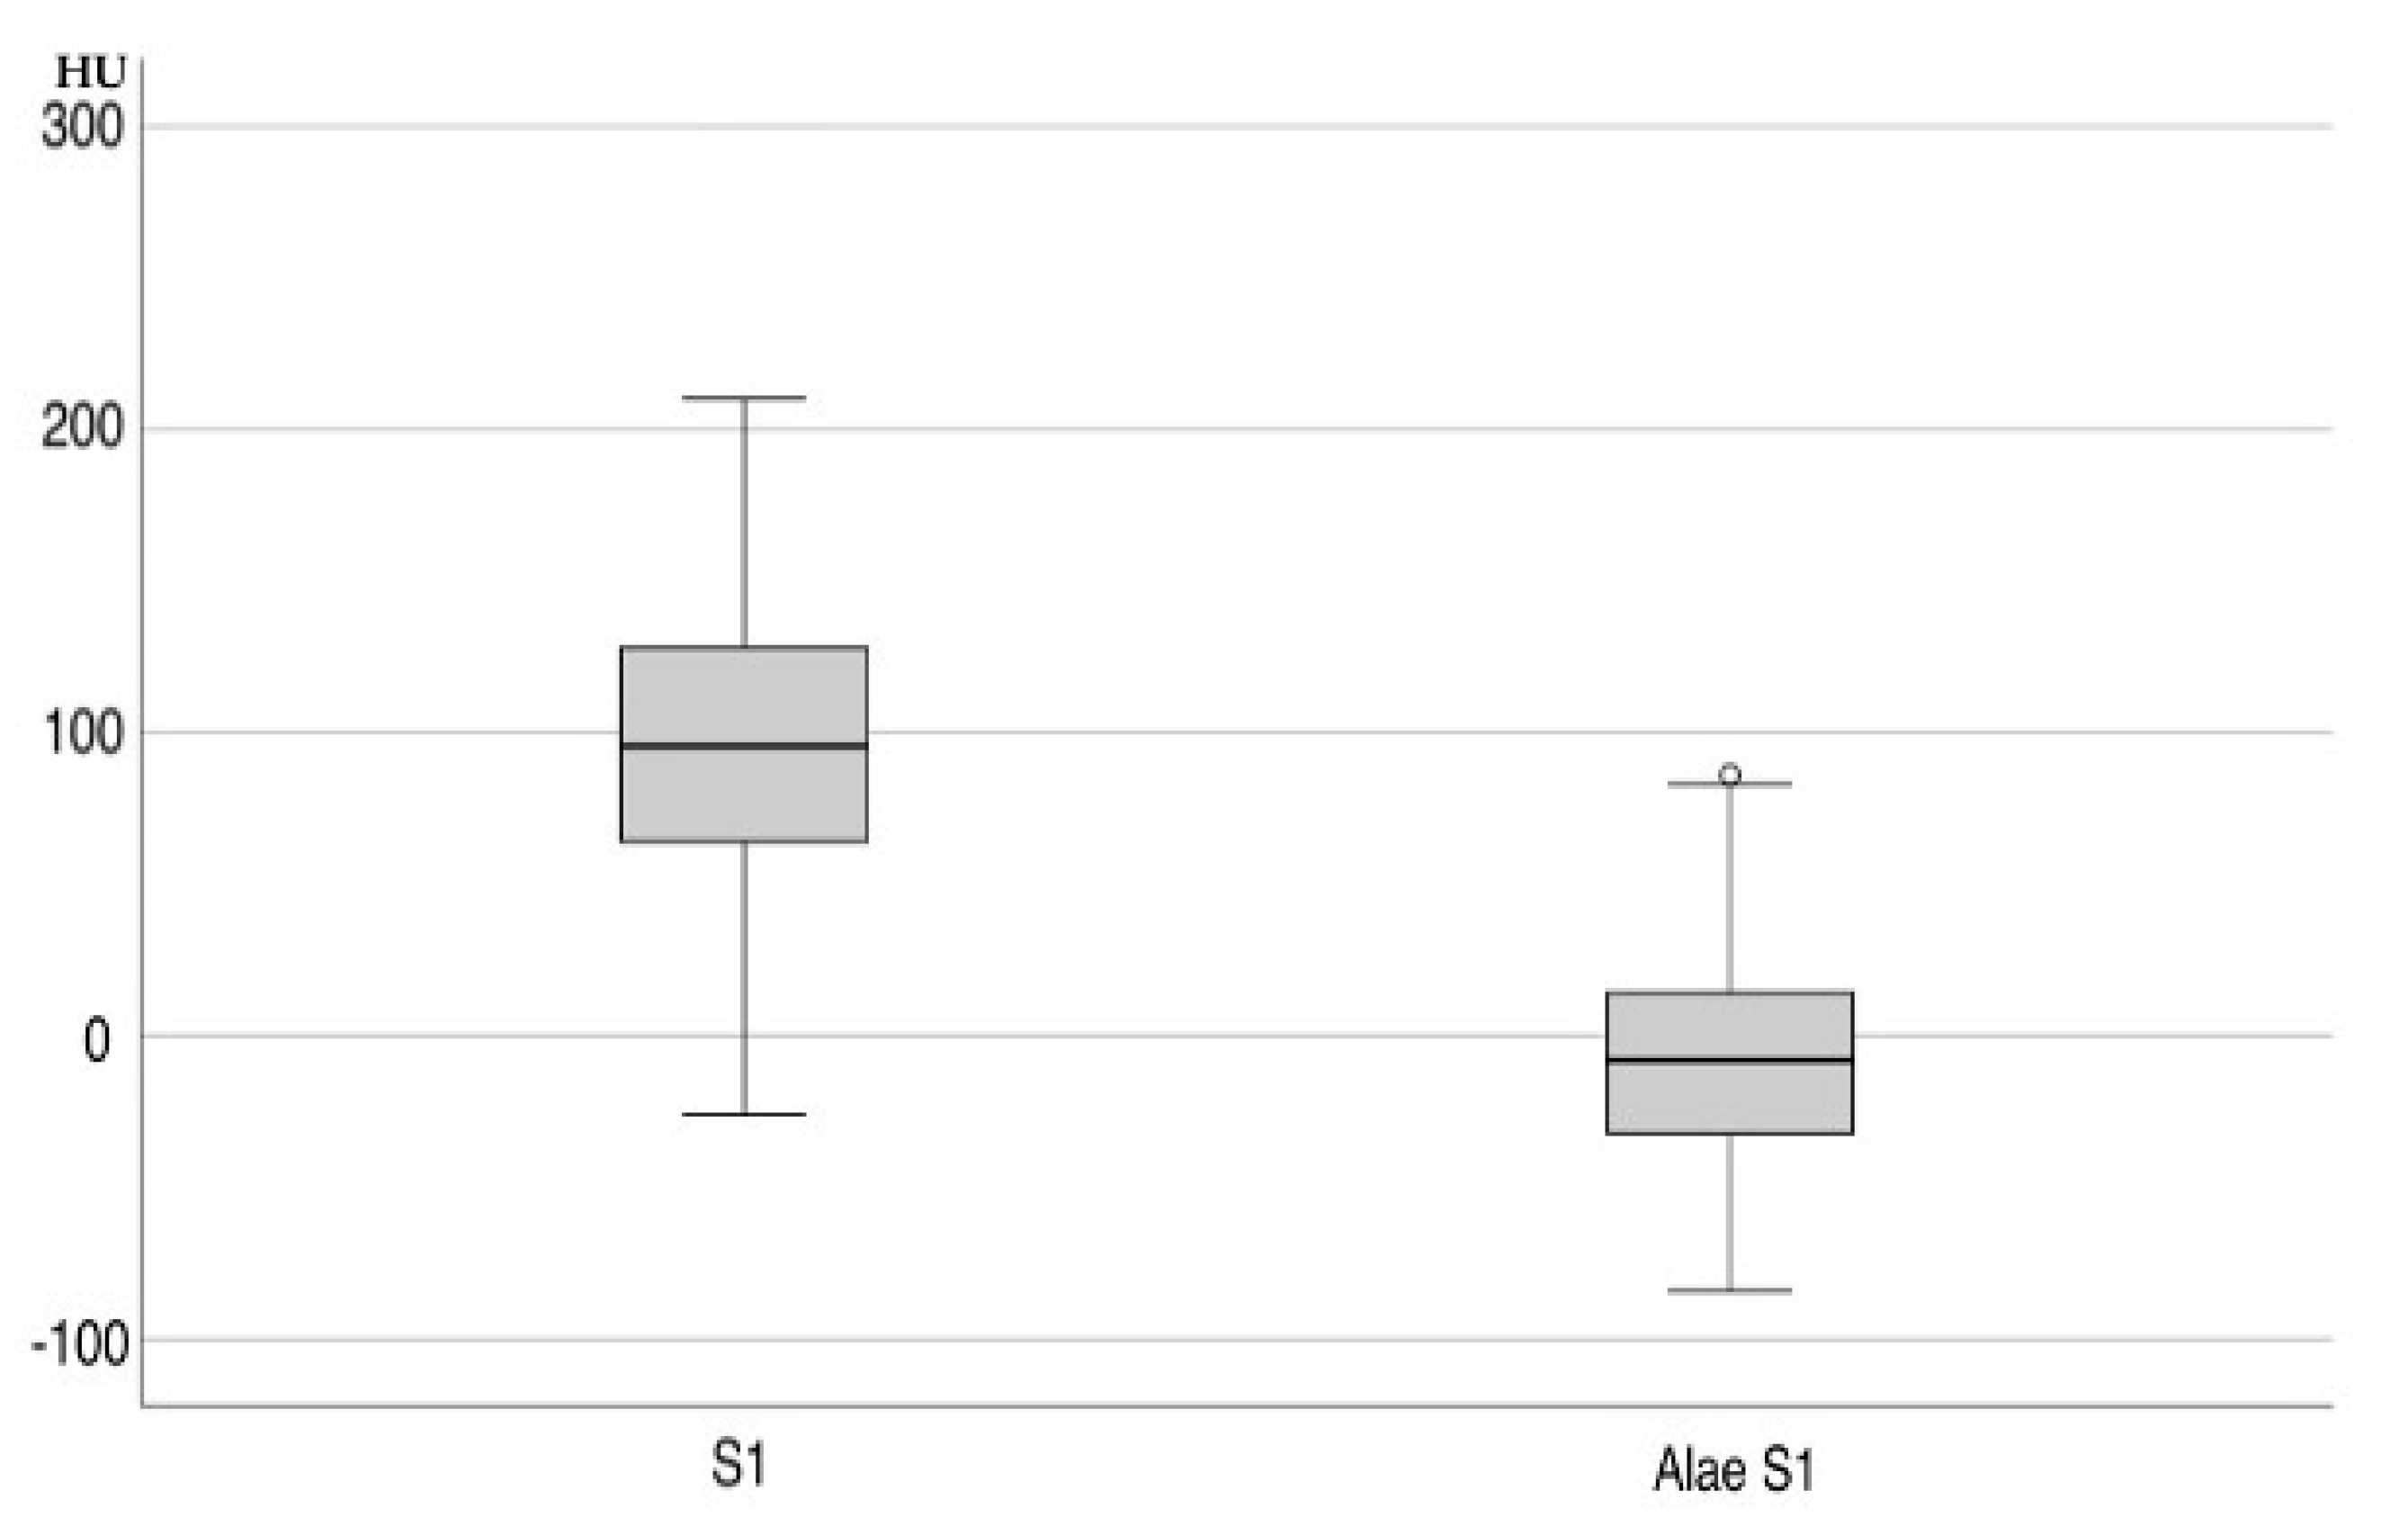
| Hounsfield units (mean ± SD) | ||
| Corpus S1 axial and sagittal | 97.90 ± 3.17 | |
| Ala S1 | −6.70 ± 3.15 | |
| Corpus S1 axial | 91 ± 50 | |
| Corpus S1 sagittal | 86 ± 51 | |
| Corpus S1 | male axial | 115.86 ± 53.94 |
| female axial | 84.75 ± 53.63 | |
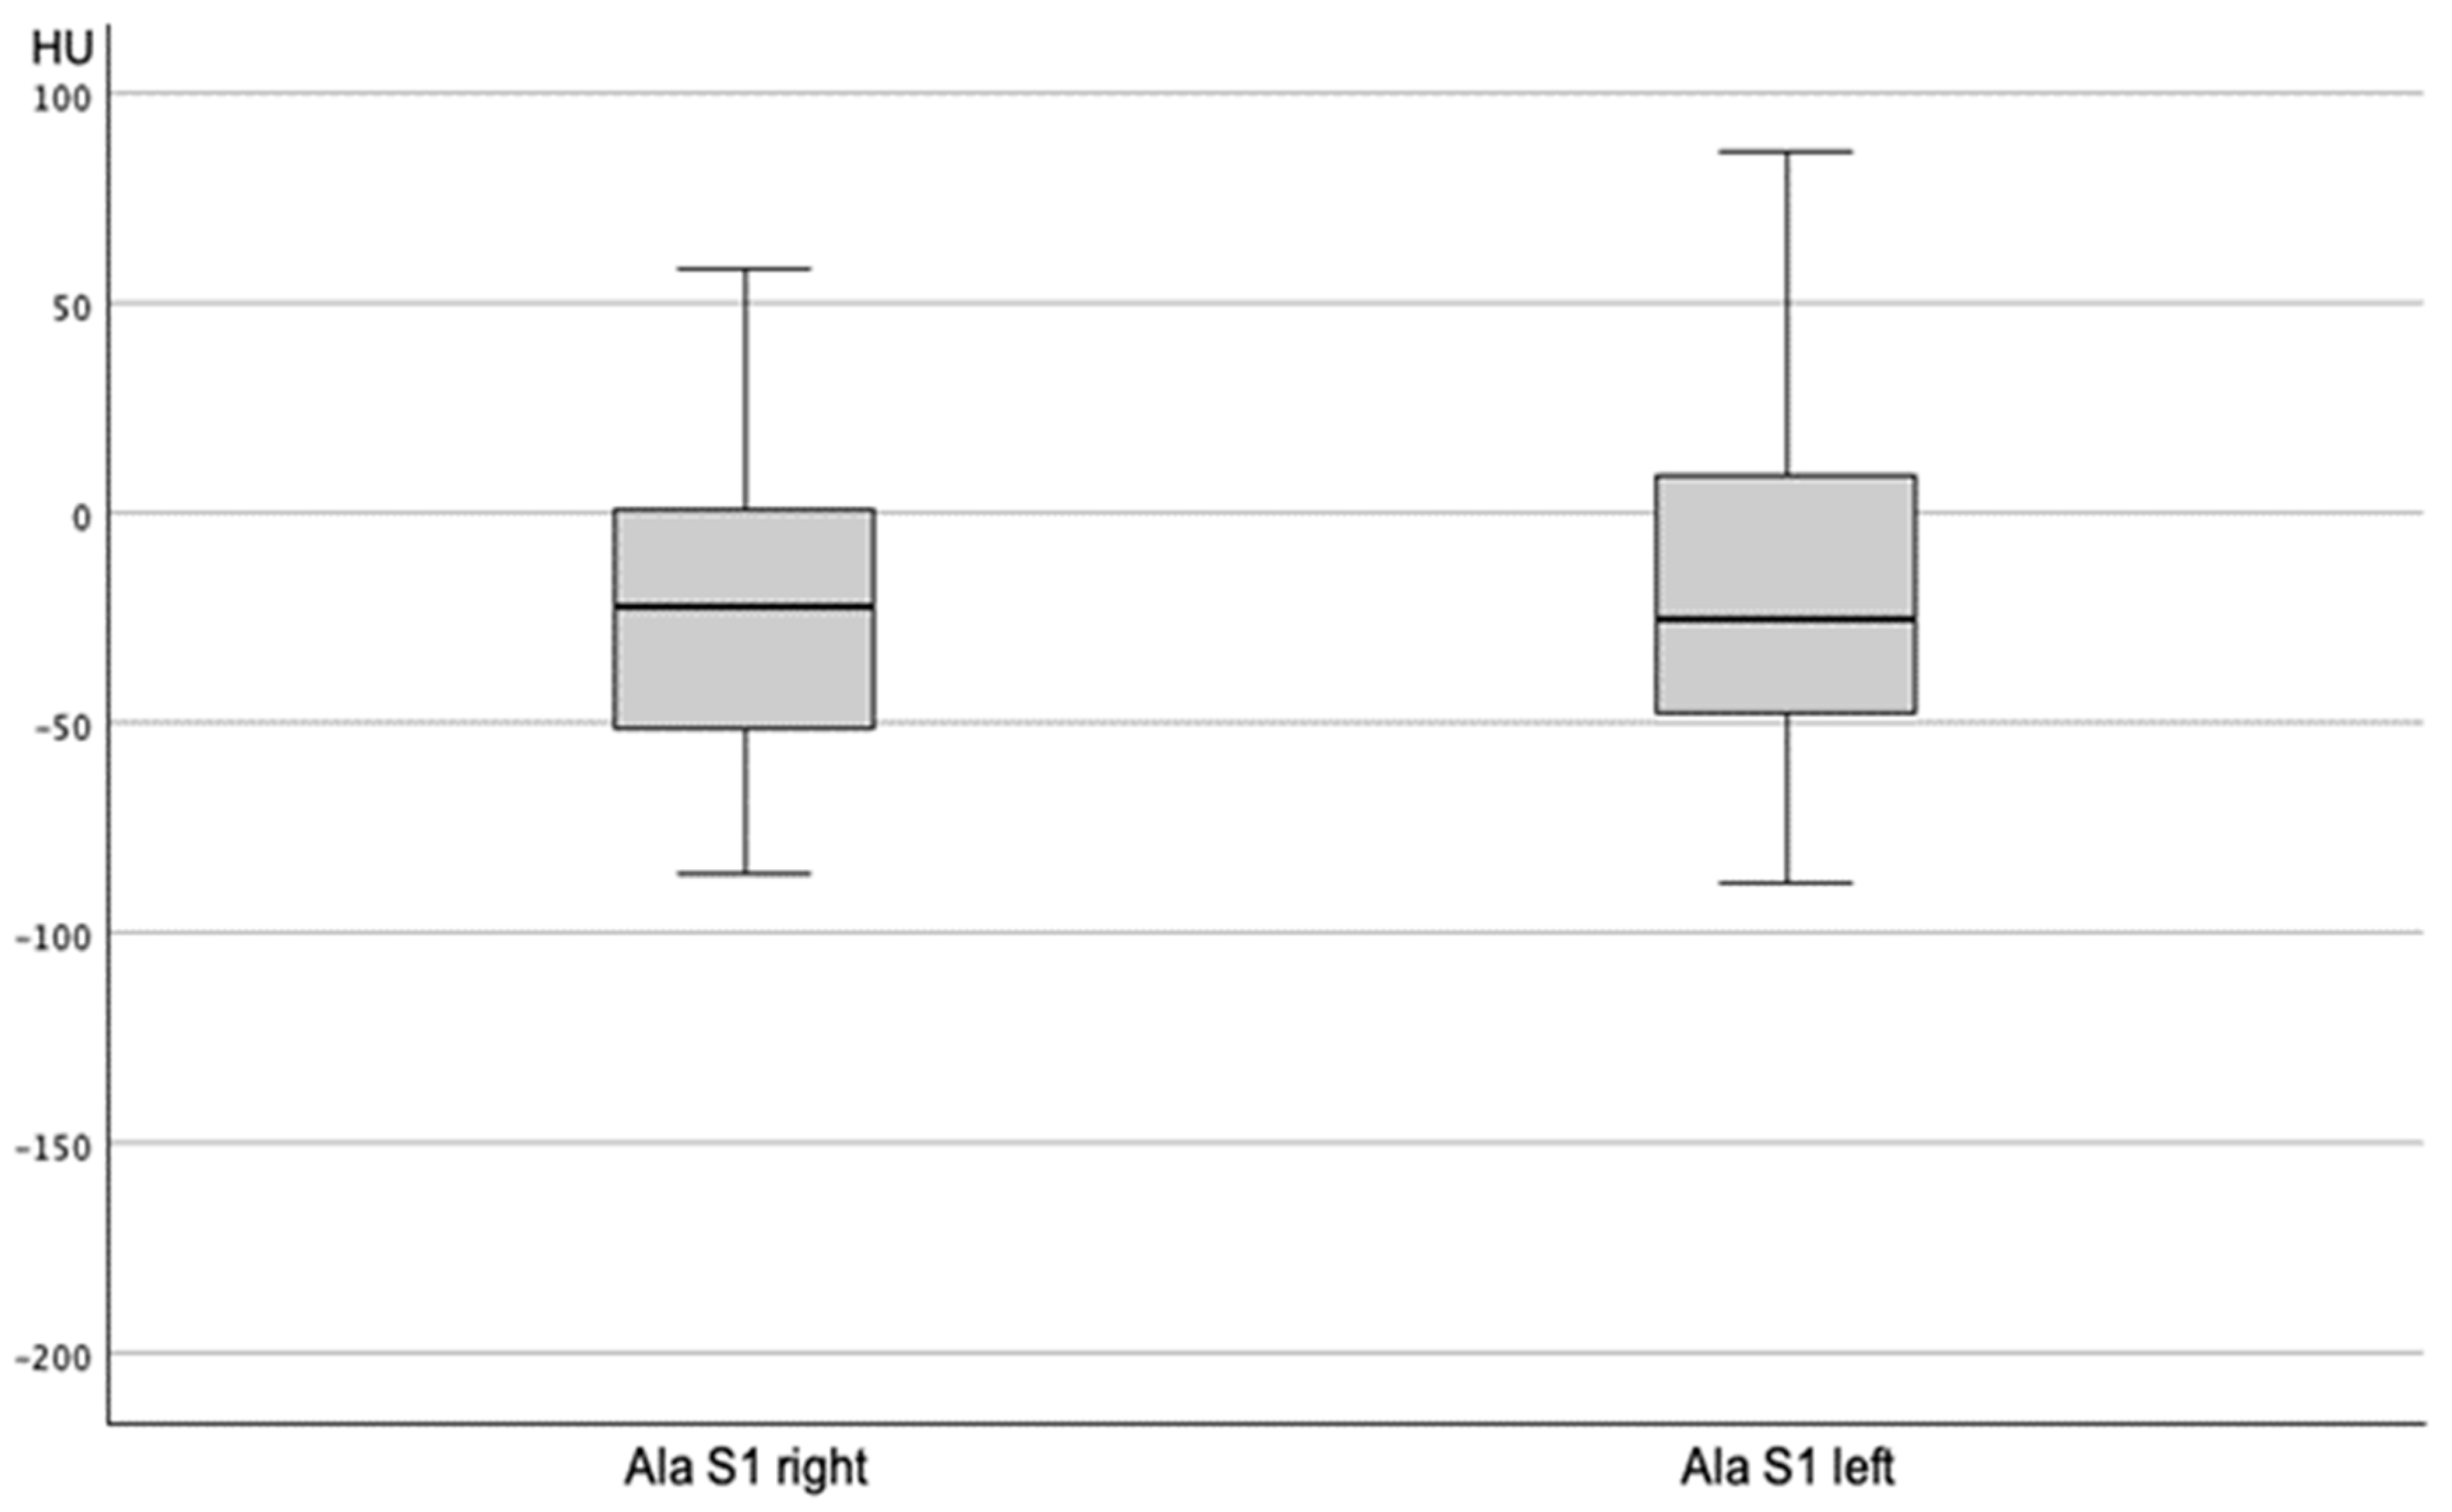
| Ala S1 without fracture | male | −6.24 ± 39.04 |
| female | −6.83 ± 34.99 | |
| FFP Type I | FFP Type II | FFP Type III | FFP Type IV | p-Value ^ | |
|---|---|---|---|---|---|
| HU S1 axial | n = 27 | n = 169 | n = 42 | n = 13 | |
| 72.11 ± 53.00 | 96.30 ± 50.61 | 81.43 ± 45.97 | 88.85 ± 26.25 | 0.840 | |
| HU S1 sagittal | n = 27 | n = 169 | n = 42 | n = 13 | |
| 64.93 ± 55.40 | 90.57 ± 50.28 | 78.21 ± 51.11 | 88.92 ± 39.80 | 0.669 | |
| Ala sacrum S1 unfractured right | n = 23 | n = 94 | n = 11 | n = 2 | |
| −32.96 ± 40.34 | −19.12 ± 36.95 | −30.45 ± 31.56 | −28.00 ± 39.60 | 0.756 | |
| Ala sacrum S1 unfractured left | n = 23 | n = 94 | n = 11 | n = 2 | |
| −21.43 ± 37.18 | −16.05 ± 39.17 | −36.27 ± 39.07 | −9.00 ± 32.53 | 0.736 | |
| Ala sacrum S1 unfractured fracture | n = 4 | n = 67 | n = 28 | n = 2 | |
| −22.50 ± 54.43 | −28.27 ± 39.24 | −34.43 ± 31.41 | −33.50 ± 10.61 | 0.511 | |
| Ala sacrum S1 opposite side fractured | n = 4 | n = 67 | n = 28 | n = 2 | |
| −12.75 ± 37.62 | 11.79 ± 40.56 | 4.89 ± 32.17 | −5.50 ± 58.69 | 0.749 | |
| Ala sacrum S1 bilateral fractures | n = 0 | n = 8 | n = 3 | n = 9 | |
| 20.75 ± 37.70 | 31.67 ± 6.35 | 25.67 ± 45.87 | 0.748 | ||
| Ala sacrum S1 opposite side bilateral fractures | n = 0 | n = 8 | n = 3 | n = 9 | |
| 29.88 ± 41.15 | 68.00 ± 17.52 | 26.00 ± 39.34 | 0.695 |
| Vitamin D Deficiency * | Regular Vitamin D Level | p-Value | |
|---|---|---|---|
| T-score (mean ± SD) | |||
| T-score L1–4 | −2.2 ± 1.3 | −2.6 ± 1.1 | 0.321 |
| T-score femoral neck | −2.9 ± 0.5 | −2.7 ± 0.9 | 0.681 |
| Hounsfield units (mean ± SD) | |||
| Corpus S1 axial | 90 ± 43 | 97 ± 34 | 0.262 |
| Corpus S1 sagittal | 91 ± 48 | 103 ± 36 | 0.453 |
| Ala S1 axial without fracture right side | −37 ± 38 | −17 ± 41 | 0.397 |
| Ala S1 axial without fracture left side | −26 ± 33 | −9 ± 30 | 0.397 |
| T-Scores 1 | Hounsfield Units Level S1 2 | |
|---|---|---|
| Regular | 0.0 ± 1.3 | 113.33 ± 44.95 |
| Osteopenia | −1.8 ± 0.4 | 87.85 ± 42.06 |
| Osteoporosis | −3.0 ± 0.3 | 91.27 ± 38.14 |
Disclaimer/Publisher’s Note: The statements, opinions and data contained in all publications are solely those of the individual author(s) and contributor(s) and not of MDPI and/or the editor(s). MDPI and/or the editor(s) disclaim responsibility for any injury to people or property resulting from any ideas, methods, instructions or products referred to in the content. |
© 2025 by the authors. Licensee MDPI, Basel, Switzerland. This article is an open access article distributed under the terms and conditions of the Creative Commons Attribution (CC BY) license (https://creativecommons.org/licenses/by/4.0/).
Share and Cite
Gleich, J.; Steiner, E.; Ehrnthaller, C.; Degen, N.; Lampert, C.; Böcker, W.; Neuerburg, C.; Linhart, C. CT-Based Evaluation of Hounsfield Units—A Novel Screening Tool for Undiagnosed Osteoporosis in Patients with Fragility Fractures of the Pelvis. J. Clin. Med. 2025, 14, 3346. https://doi.org/10.3390/jcm14103346
Gleich J, Steiner E, Ehrnthaller C, Degen N, Lampert C, Böcker W, Neuerburg C, Linhart C. CT-Based Evaluation of Hounsfield Units—A Novel Screening Tool for Undiagnosed Osteoporosis in Patients with Fragility Fractures of the Pelvis. Journal of Clinical Medicine. 2025; 14(10):3346. https://doi.org/10.3390/jcm14103346
Chicago/Turabian StyleGleich, Johannes, Elisabeth Steiner, Christian Ehrnthaller, Nikolaus Degen, Christopher Lampert, Wolfgang Böcker, Carl Neuerburg, and Christoph Linhart. 2025. "CT-Based Evaluation of Hounsfield Units—A Novel Screening Tool for Undiagnosed Osteoporosis in Patients with Fragility Fractures of the Pelvis" Journal of Clinical Medicine 14, no. 10: 3346. https://doi.org/10.3390/jcm14103346
APA StyleGleich, J., Steiner, E., Ehrnthaller, C., Degen, N., Lampert, C., Böcker, W., Neuerburg, C., & Linhart, C. (2025). CT-Based Evaluation of Hounsfield Units—A Novel Screening Tool for Undiagnosed Osteoporosis in Patients with Fragility Fractures of the Pelvis. Journal of Clinical Medicine, 14(10), 3346. https://doi.org/10.3390/jcm14103346