

Association of Physical Function, Quantity, and Quality of the Quadriceps with Postoperative Physical Activity Before Total Knee Arthroplasty


Abstract
1. Introduction
2. Methods
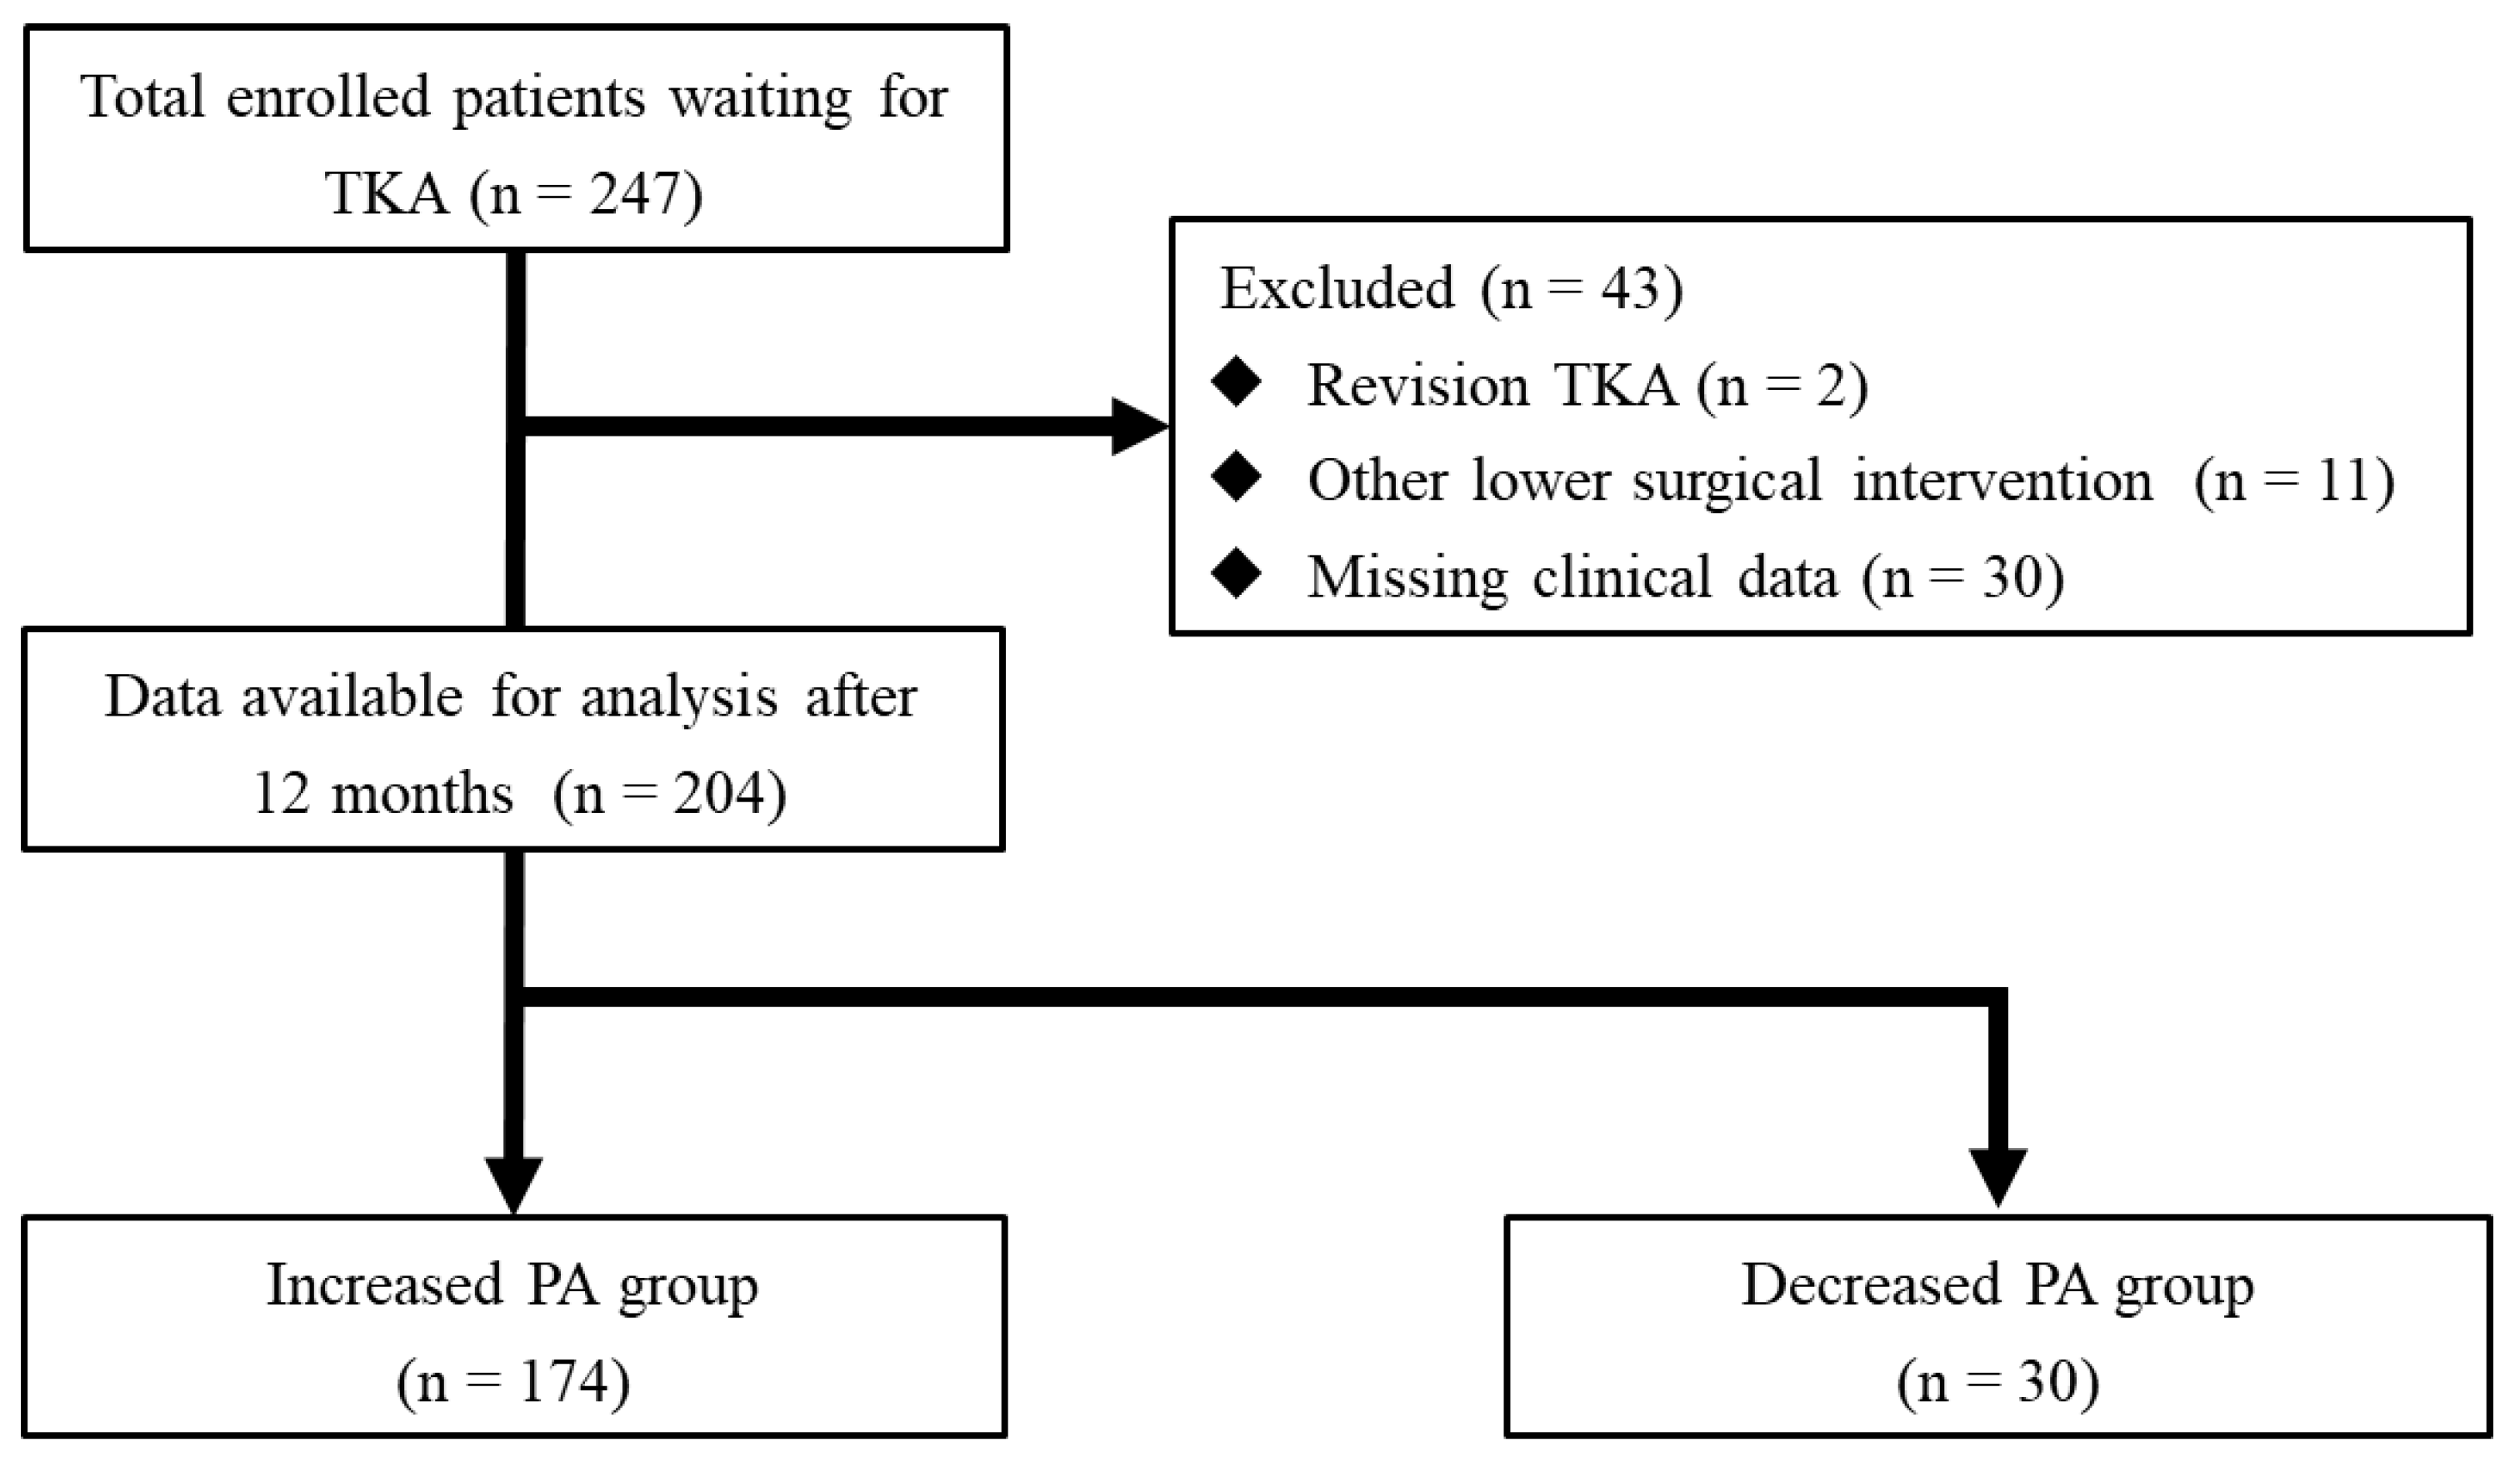
2.1. Study Design
2.2. Surgical Technique and Rehabilitation Protocol
2.3. Assessment Variables
2.4. Physical Function Tests
2.5. Patient-Reported Outcome Measures
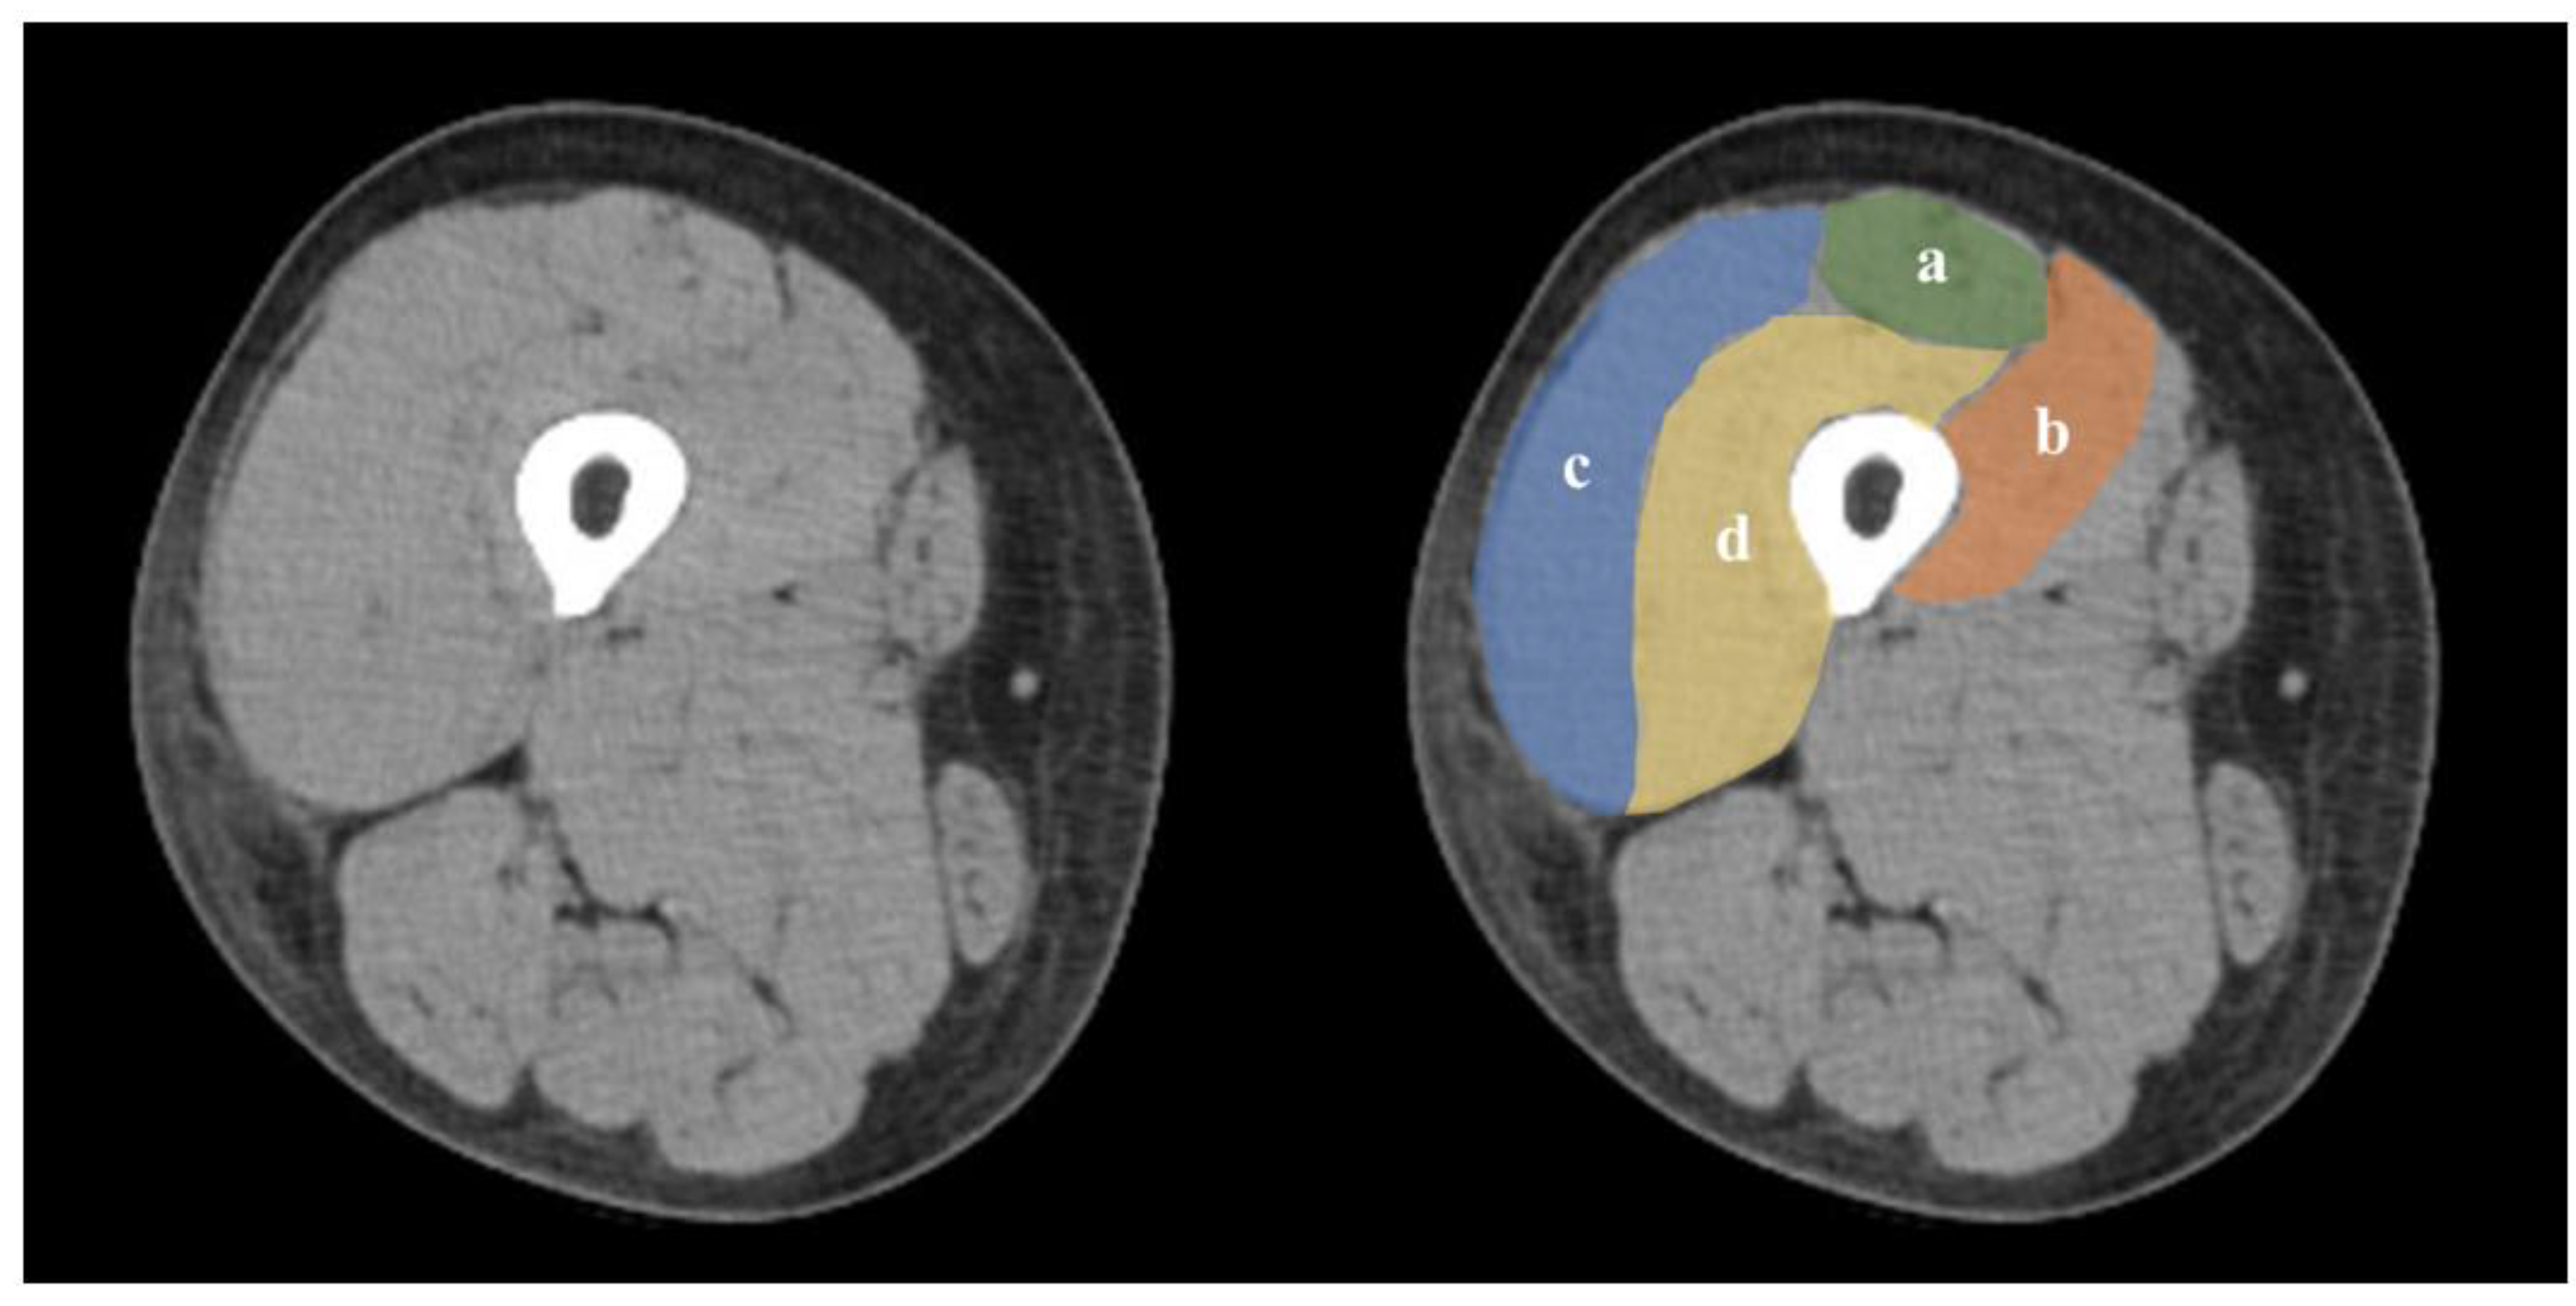
2.6. Skeletal Muscle Assessment
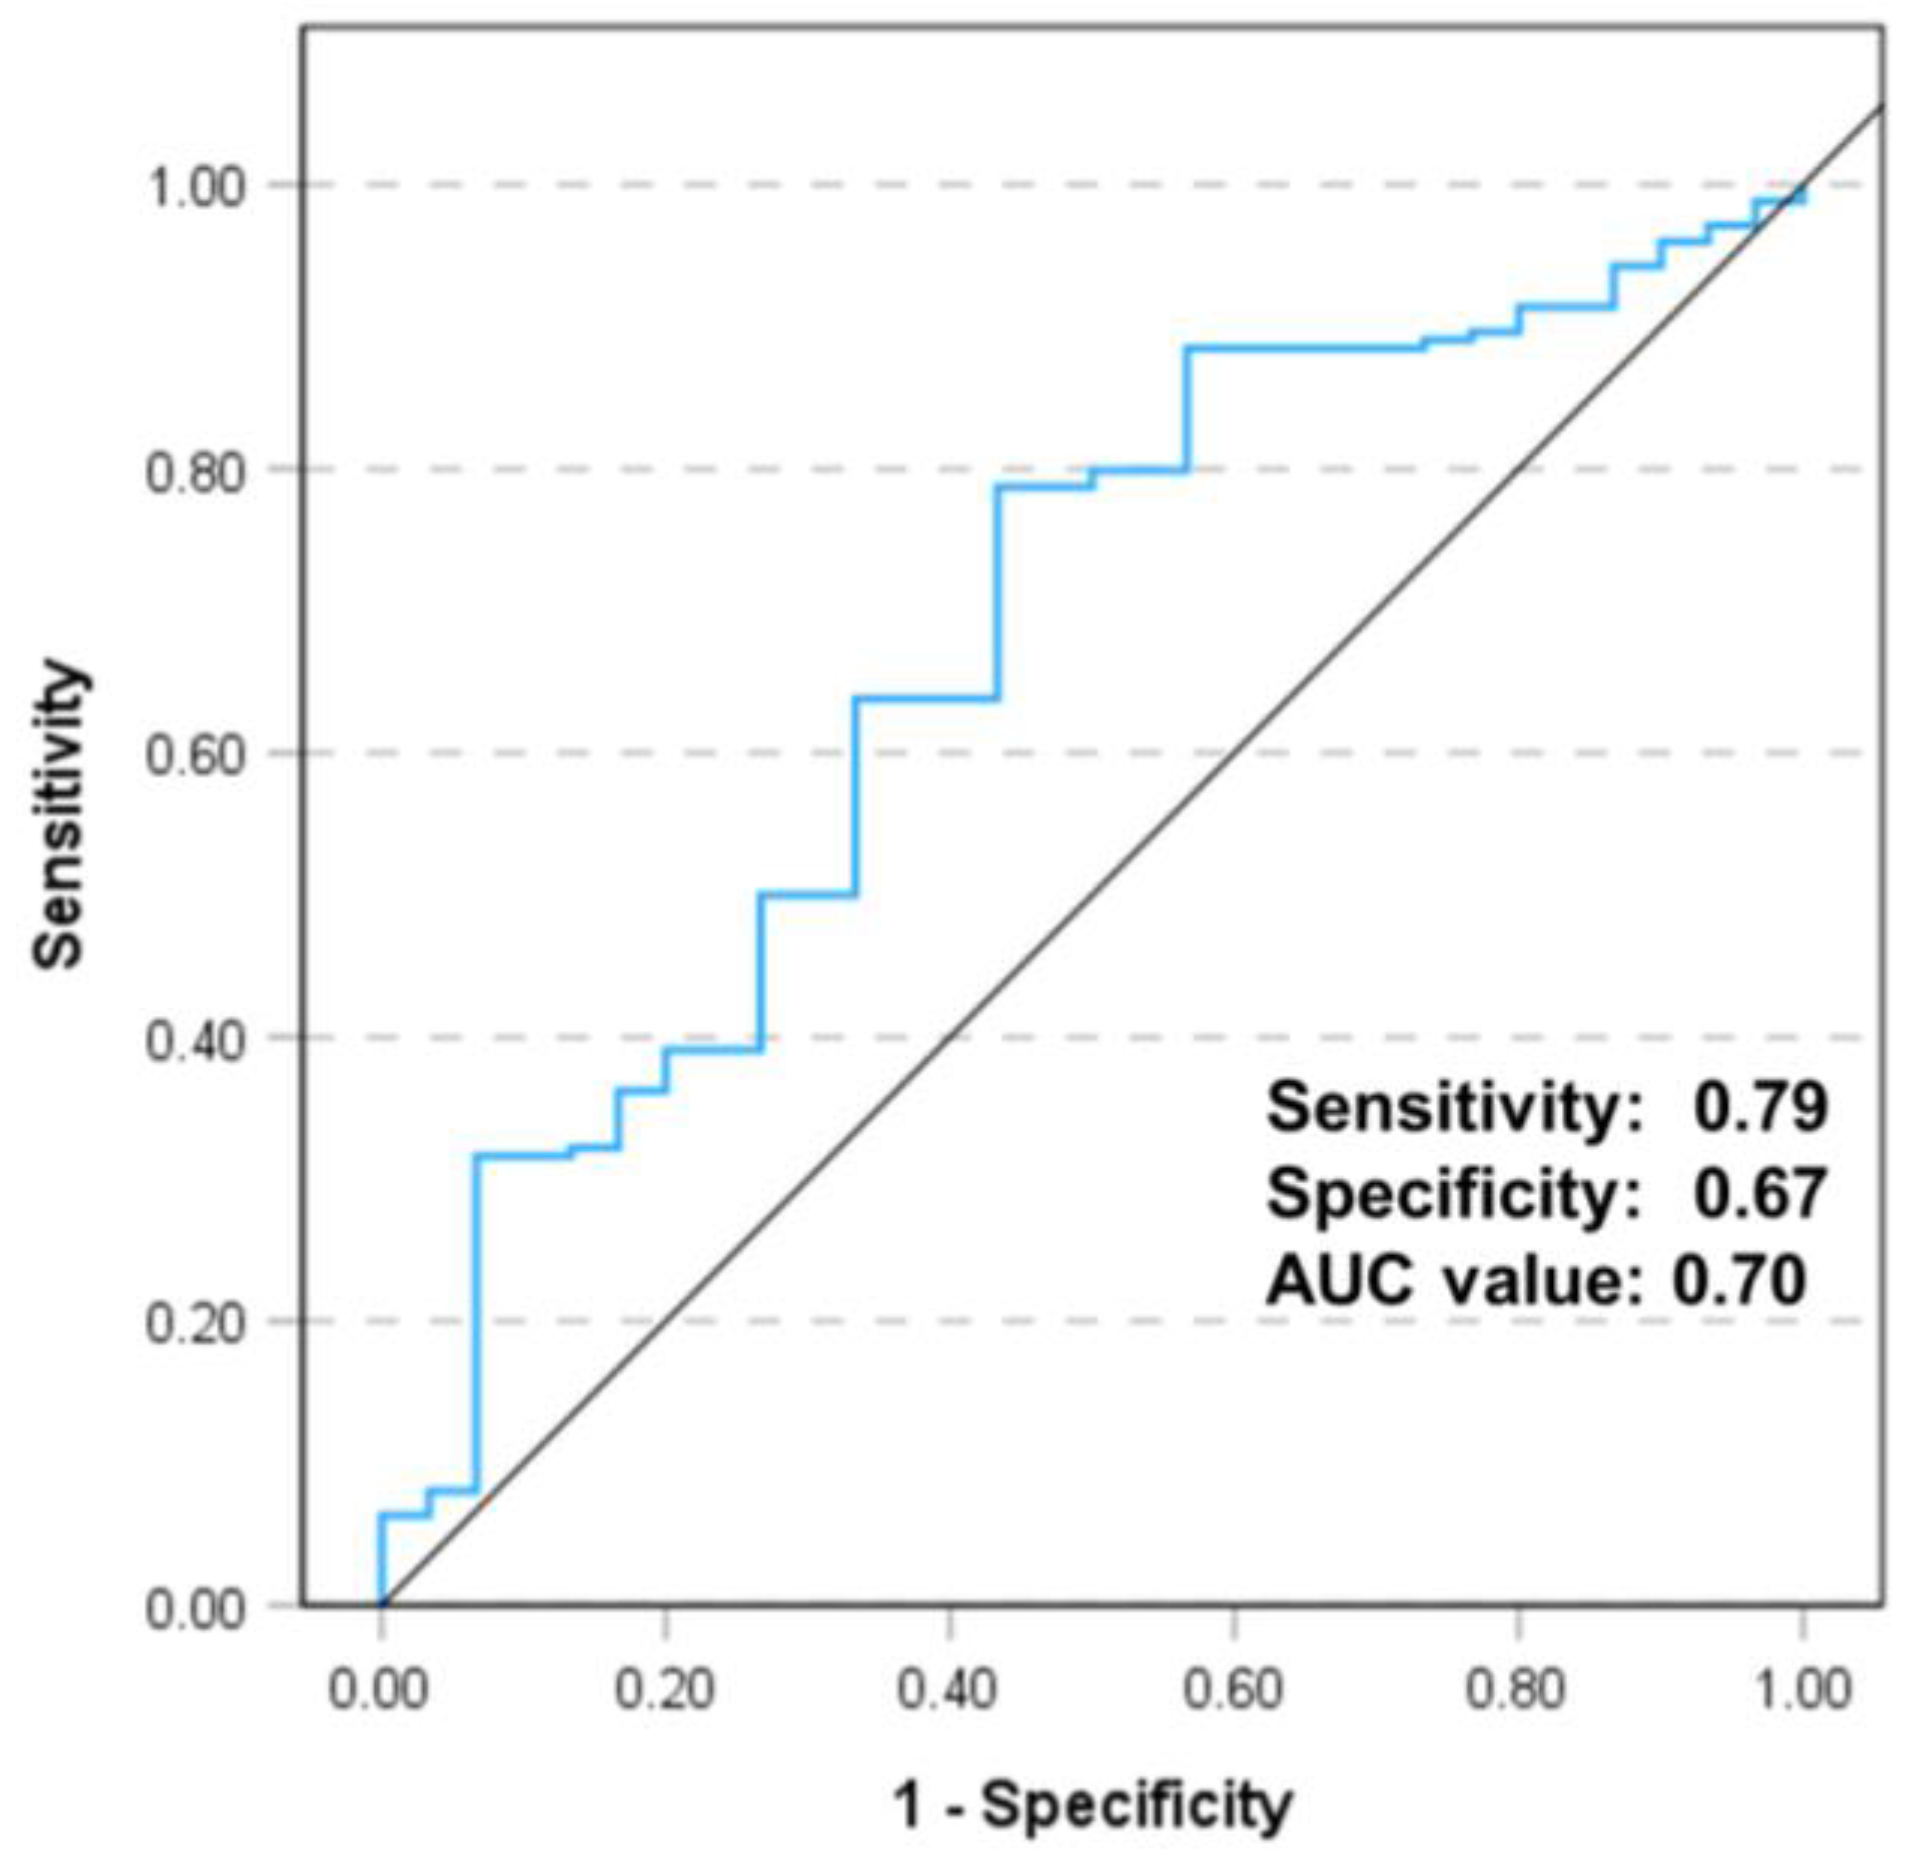
2.7. Data Analyses
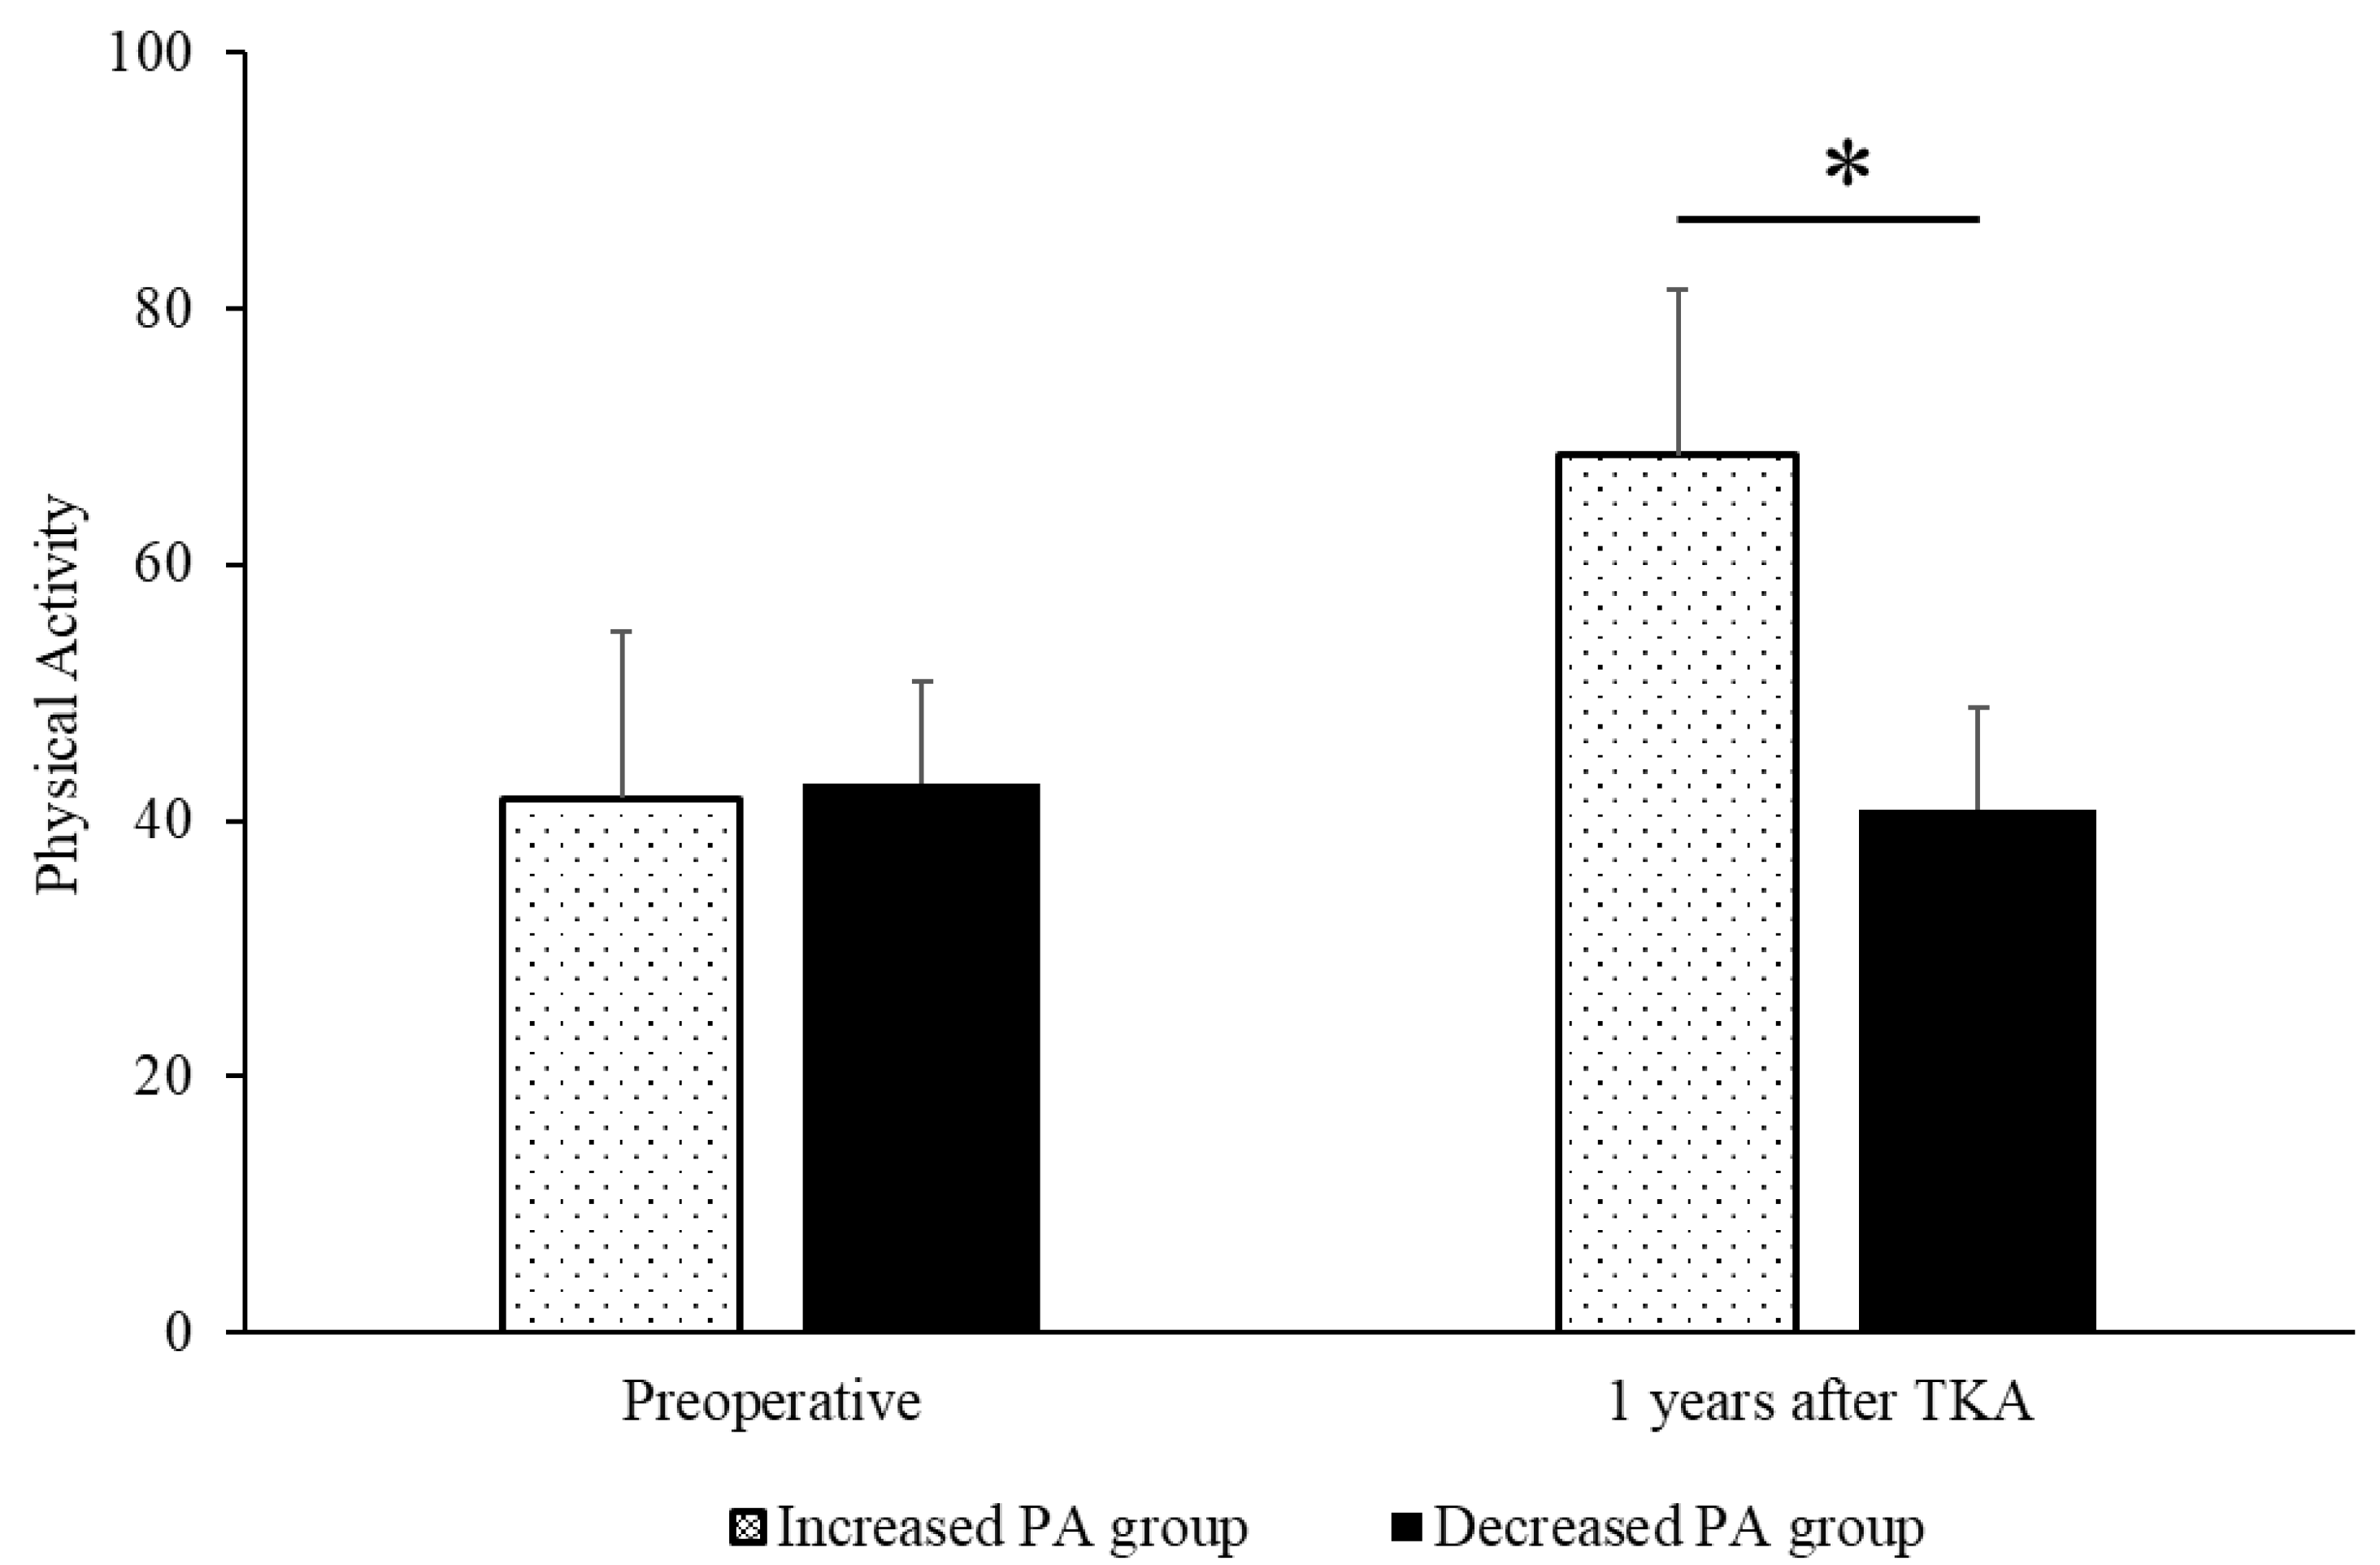
3. Results
4. Discussion
5. Conclusions
Author Contributions
Funding
Institutional Review Board Statement
Informed Consent Statement
Data Availability Statement
Acknowledgments
Conflicts of Interest
References
- Sharma, L. Osteoarthritis of the knee. N. Engl. J. Med. 2021, 384, 51–59. [Google Scholar] [CrossRef]
- Cui, A.; Li, H.; Wang, D.; Zhong, J.; Chen, Y.; Lu, H. Global, regional prevalence, incidence and risk factors of knee osteoarthritis in population-based studies. EClinicalMedicine 2020, 29–30, 100587. [Google Scholar] [CrossRef] [PubMed]
- Gates, L.S.; Perry, T.A.; Golightly, Y.M.; Nelson, A.E.; Callahan, L.F.; Felson, D.; Nevitt, M.; Jones, G.; Cooper, C.; Batt, M.E.; et al. Recreational physical activity and risk of incident knee osteoarthritis: An international meta-analysis of individual participant-level data. Arthritis Rheumatol. 2022, 74, 612–622. [Google Scholar] [CrossRef] [PubMed]
- Nedopil, A.J.; Greidanus, N.V.; Garbuz, D.S.; Howard, L.C.; Sayre, E.C.; Masri, B.A. The desired oxford knee score obtained before total knee arthroplasty is predictive of the postoperative oxford knee score: A prospective study. J. Arthroplast. 2023, 38, 60–64. [Google Scholar] [CrossRef]
- Tripuraneni, K.R.; Anderson, M.B.; Cholewa, J.M.; Smith, K.; VanAndel, D.C.; Redfern, R.E.; Barnett, S.L. Is there a change in anxiety and depression following total knee arthroplasty? J. Arthroplast. 2024, 39, S185–S190. [Google Scholar] [CrossRef]
- Ayers, D.C.; Yousef, M.; Yang, W.; Zheng, H. Age-related differences in pain, function, and quality of life following primary total knee arthroplasty: Results from a force-tjr (function and outcomes research for comparative effectiveness in total joint replacement) cohort. J. Arthroplast. 2023, 38 (Suppl. 2), S169–S176. [Google Scholar] [CrossRef] [PubMed]
- Beswick, A.D.; Wylde, V.; Gooberman-Hill, R.; Blom, A.; Dieppe, P. What proportion of patients report long-term pain after total hip or knee replacement for osteoarthritis? A systematic review of prospective studies in unselected patients. BMJ Open 2012, 2, e000435. [Google Scholar] [CrossRef] [PubMed]
- Zeni, J.A., Jr.; Snyder-Mackler, L. Preoperative predictors of persistent impairments during stair ascent and descent after total knee arthroplasty. J. Bone Jt. Surg. Am. 2010, 92, 1130–1136. [Google Scholar] [CrossRef]
- Skoffer, B.; Maribo, T.; Mechlenburg, I.; Korsgaard, C.G.; Søballe, K.; Dalgas, U. Efficacy of preoperative progressive resistance training in patients undergoing total knee arthroplasty: 12-month follow-up data from a randomized controlled trial. Clin. Rehabil. 2020, 34, 82–90. [Google Scholar] [CrossRef] [PubMed]
- Moon, Y.W.; Kim, H.J.; Ahn, H.S.; Lee, D.H. Serial changes of quadriceps and hamstring muscle strength following total knee arthroplasty: A meta-analysis. PLoS ONE 2016, 11, e0148193. [Google Scholar] [CrossRef]
- Rossi, M.D.; Brown, L.E.; Whitehurst, M. Knee extensor and flexor torque characteristics before and after unilateral total knee arthroplasty. Am. J. Phys. Med. Rehabil. 2006, 85, 737–746. [Google Scholar] [CrossRef] [PubMed]
- Mizner, R.L.; Petterson, S.C.; Stevens, J.E.; Axe, M.J.; Snyder-Mackler, L. Preoperative quadriceps strength predicts functional ability one year after total knee arthroplasty. J. Rheumatol. 2005, 32, 1533–1539. [Google Scholar] [PubMed]
- Devasenapathy, N.; Maddison, R.; Malhotra, R.; Zodepy, S.; Sharma, S.; Belavy, D.L. Preoperative quadriceps muscle strength and functional ability predict performance-based outcomes 6 months after total knee arthroplasty: A systematic review. Phys. Ther. 2019, 99, 46–61. [Google Scholar] [CrossRef] [PubMed]
- Zeni, J.A., Jr.; Snyder-Mackler, L. Early postoperative measures predict 1- and 2-year outcomes after unilateral total knee arthroplasty: Importance of contralateral limb strength. Phys. Ther. 2010, 90, 43–54. [Google Scholar] [CrossRef] [PubMed]
- Goodpaster, B.H.; Kelley, D.E.; Thaete, F.L.; He, J.; Ross, R. Skeletal muscle attenuation determined by computed tomography is associated with skeletal muscle lipid content. J. Appl. Physiol. 2000, 89, 104–110. [Google Scholar] [CrossRef] [PubMed]
- Kumar, D.; Karampinos, D.C.; MacLeod, T.D.; Lin, W.; Nardo, L.; Li, X.; Link, T.M.; Majumdar, S.; Souza, R.B. Quadriceps intramuscular fat fraction rather than muscle size is associated with knee osteoarthritis. Osteoarthr. Cartil. 2014, 22, 226–234. [Google Scholar] [CrossRef]
- Amini, B.; Boyle, S.P.; Boutin, R.D.; Lenchik, L. Approaches to assessment of muscle mass and myosteatosis on computed tomography: A systematic review. J. Gerontol. A Biol. Sci. Med. Sci. 2019, 74, 1671–1678. [Google Scholar] [CrossRef]
- Kim, H.; Kum, D.; Lee, I.; Choi, J. Concurrent validity of gaitrite and the 10-m walk test to measure gait speed in adults with chronic ankle instability. Healthcare 2022, 10, 1499. [Google Scholar] [CrossRef] [PubMed]
- Kittelson, A.J.; Christensen, J.C.; Loyd, B.J.; Burrows, K.L.; Iannitto, J.; Stevens-Lapsley, J.E. Reliability, responsiveness, and validity of handheld dynamometry for assessing quadriceps strength in total knee arthroplasty. Disabil. Rehabil. 2021, 43, 3070–3077. [Google Scholar] [CrossRef]
- Tabara, Y.; Okada, Y.; Ochi, M.; Ohyagi, Y.; Igase, M. One-leg standing time is a simple measure for loss of skeletal muscle mass and fat deposition in muscle: The j-shipp study. Aging Clin. Exp. Res. 2024, 36, 1. [Google Scholar] [CrossRef]
- Hamamoto, Y.; Ito, H.; Furu, M.; Ishikawa, M.; Azukizawa, M.; Kuriyama, S.; Nakamura, S.; Matsuda, S. Cross-cultural adaptation and validation of the japanese version of the new knee society scoring system for osteoarthritic knee with total knee arthroplasty. J. Orthop. Sci. 2015, 20, 849–853. [Google Scholar] [CrossRef] [PubMed]
- Noble, P.C.; Scuderi, G.R.; Brekke, A.C.; Sikorskii, A.; Benjamin, J.B.; Lonner, J.H.; Chadha, P.; Daylamani, D.A.; Scott, W.N.; Bourne, R.B. Development of a new knee society scoring system. Clin. Orthop. Relat. Res. 2012, 470, 20–32. [Google Scholar] [CrossRef] [PubMed]
- Roos, E.M.; Lohmander, L.S. The knee injury and osteoarthritis outcome score (koos): From joint injury to osteoarthritis. Health Qual. Life Outcomes 2003, 1, 64. [Google Scholar] [CrossRef]
- Mizuno, T.; Matsui, Y.; Tomida, M.; Suzuki, Y.; Nishita, Y.; Tange, C.; Shimokata, H.; Imagama, S.; Otsuka, R.; Arai, H. Differences in the mass and quality of the quadriceps with age and sex and their relationships with knee extension strength. J. Cachexia Sarcopenia Muscle 2021, 12, 900–912. [Google Scholar] [CrossRef]
- Strandberg, S.; Wretling, M.L.; Wredmark, T.; Shalabi, A. Reliability of computed tomography measurements in assessment of thigh muscle cross-sectional area and attenuation. BMC Med. Imaging 2010, 10, 18. [Google Scholar] [CrossRef] [PubMed]
- Cohen, J. Statistical Power Analysis for the Behavioral Sciences; Lawrence Erlbaum Associates: Mahwah, NJ, USA, 1988; Volume 567. [Google Scholar] [CrossRef]
- Maxwell, J.; Niu, J.; Singh, J.A.; Nevitt, M.C.; Law, L.F.; Felson, D. The influence of the contralateral knee prior to knee arthroplasty on post-arthroplasty function: The multicenter osteoarthritis study. J. Bone Jt. Surg. Am. 2013, 95, 989–993. [Google Scholar] [CrossRef] [PubMed]
- Taniguchi, M.; Fukumoto, Y.; Kobayashi, M.; Kawasaki, T.; Maegawa, S.; Ibuki, S.; Ichihashi, N. Quantity and quality of the lower extremity muscles in women with knee osteoarthritis. Ultrasound Med. Biol. 2015, 41, 2567–2574. [Google Scholar] [CrossRef]
- Taniguchi, M.; Fukumoto, Y.; Yagi, M.; Hirono, T.; Yamagata, M.; Asayama, A.; Okada, S.; Nakai, R.; Kobayashi, M.; Ichihashi, N. A higher intramuscular fat in vastus medialis is associated with functional disabilities and symptoms in early stage of knee osteoarthritis: A case-control study. Arthritis Res. Ther. 2023, 25, 61. [Google Scholar] [CrossRef]
- Oiestad, B.E.; Juhl, C.B.; Eitzen, I.; Thorlund, J.B. Knee extensor muscle weakness is a risk factor for development of knee osteoarthritis. A systematic review and meta-analysis. Osteoarthr. Cartil. 2015, 23, 171–177. [Google Scholar] [CrossRef] [PubMed]
- Waligora, A.C.; Johanson, N.A.; Hirsch, B.E. Clinical anatomy of the quadriceps femoris and extensor apparatus of the knee. Clin. Orthop. Relat. Res. 2009, 467, 3297–3306. [Google Scholar] [CrossRef] [PubMed]
- McLeod, J.C.; Currier, B.S.; Lowisz, C.V.; Phillips, S.M. The influence of resistance exercise training prescription variables on skeletal muscle mass, strength, and physical function in healthy adults: An umbrella review. J. Sport Health Sci. 2024, 13, 47–60. [Google Scholar] [CrossRef]
- Yoshiko, A.; Kaji, T.; Sugiyama, H.; Koike, T.; Oshida, Y.; Akima, H. Effect of 12-month resistance and endurance training on quality, quantity, and function of skeletal muscle in older adults requiring long-term care. Exp. Gerontol. 2017, 98, 230–237. [Google Scholar] [CrossRef] [PubMed]
- Casaña, J.; Calatayud, J.; Ezzatvar, Y.; Vinstrup, J.; Benítez, J.; Andersen, L.L. Preoperative high-intensity strength training improves postural control after tka: Randomized-controlled trial. Knee Surg. Sports Traumatol. Arthrosc. 2019, 27, 1057–1066. [Google Scholar] [CrossRef] [PubMed]
- Sun, J.N.; Shan, Y.Z.; Wu, L.X.; Li, N.; Xu, F.H.; Kong, X.R.; Zhang, B. Preoperative high-intensity strength training combined with balance training can improve early outcomes after total knee arthroplasty. J. Orthop. Surg. Res. 2023, 18, 692. [Google Scholar] [CrossRef] [PubMed]
- Wang, Z.; Taniguchi, M.; Saeki, J.; Ichihashi, N. Effects of high-velocity versus low-velocity resistance training on muscle echo intensity in healthy young women: A randomized controlled trial. Sports Health 2024, 19417381241257181. [Google Scholar] [CrossRef] [PubMed]
- Roos, E.M.; Roos, H.P.; Lohmander, L.S.; Ekdahl, C.; Beynnon, B.D. Knee injury and osteoarthritis outcome score (koos)--development of a self-administered outcome measure. J. Orthop. Sports Phys. Ther. 1998, 28, 88–96. [Google Scholar] [CrossRef]
- Migliorini, F.; Maffulli, N.; Schäfer, L.; Simeone, F.; Bell, A.; Hofmann, U.K. Minimal clinically important difference (mcid), substantial clinical benefit (scb), and patient-acceptable symptom state (pass) in patients who have undergone total knee arthroplasty: A systematic review. Knee Surg. Relat. Res. 2024, 36, 3. [Google Scholar] [CrossRef] [PubMed]
- Sašek, M.; Kozinc, Ž.; Löfler, S.; Hofer, C.; Šarabon, N. Objectively measured physical activity, sedentary behavior and functional performance before and after lower limb joint arthroplasty: A systematic review with meta-analysis. J. Clin. Med. 2021, 10, 5885. [Google Scholar] [CrossRef]
- Paxton, R.J.; Melanson, E.L.; Stevens-Lapsley, J.E.; Christiansen, C.L. Physical activity after total knee arthroplasty: A critical review. World J. Orthop. 2015, 6, 614–622. [Google Scholar] [CrossRef]
- Redfern, R.E.; Crawford, D.A.; Lombardi, A.V., Jr.; Tripuraneni, K.R.; Van Andel, D.C.; Anderson, M.B.; Cholewa, J.M. Outcomes vary by pre-operative physical activity levels in total knee arthroplasty patients. J. Clin. Med. 2023, 13, 125. [Google Scholar] [CrossRef]

| Characteristics | N or Mean |
|---|---|
| Sex: males/females | 49:155 |
| Age at time of surgery (years) | 73.5 (8.5) |
| Height (m) | 155.0 (7.7) |
| Weight (kg) | 61.8 (10.1) |
| BMI (kg/m2) | 25.7 (3.9) |
| History of contralateral TKA, yes/no | 48/156 |
| Approach | |
| Subvastus | 181 (88.7%) |
| Medial parapatellar | 23 (11.3%) |
| Kellgren–Lawrence grade | |
| III | 31 (15.2%) |
| IV | 173 (84.8%) |
| Variable | Increased PA Group (n = 174) | Decreased PA Group (n = 30) | 95% CI | p Value |
|---|---|---|---|---|
| Clinical parameters | ||||
| Gender: males/females | 43:131 | 6:24 | −0.11, 0.23 | 0.496 |
| Age at time of surgery (years) | 72.8 (8.7) | 73.0 (7.2) | −3.17, 3.51 | 0.921 |
| Height (m) | 155.4 (7.8) | 152. 9 (3.7) | −5.45, 0.50 | 0.103 |
| Weight (kg) | 62.1 (9.6) | 60.1 (10.3) | −5.96, 1.97 | 0.322 |
| BMI (kg/m2) | 25.7 (3.6) | 25.7 (4.0) | −0.11, 0.23 | 0.948 |
| History of contralateral TKA | 42 | 6 | −0.21, 0.13 | 0.624 |
| 10 m gait time (s) | 13.1 (5.2) | 13.5 (5.2) | −1.64, 2.51 | 0.672 |
| Operative side | ||||
| Knee flexion range of motion (°) | 110.7 (16.2) | 108.0 (14.4) | −8.95, 3.51 | 0.390 |
| Knee extension range of motion (°) | −7.9 (6.5) | −8.2 (7.1) | −2.87, 2.31 | 0.831 |
| Quadriceps strength (N) | 169.9 (69.7) | 146.7 (53.7) | −49.46, 3.27 | 0.086 |
| One-leg standing time (s) | 22.0 (17.0) | 18.3 (16.2) | −10.32, 2.83 | 0.263 |
| Knee pain | 4.0 (1.5) | 3.4 (1.9) | −1.23, 0.01 | 0.055 |
| FTA | 187.6 (5.4) | 186.2 (5.3) | −3.53, 0.68 | 0.177 |
| Non-operative side | ||||
| Knee flexion range of motion (°) | 129.0 (12.5) | 129.5 (11.5) | −4.34, 5.29 | 0.845 |
| Knee extension range of motion (°) | −2.6 (4.8) | −1.3 (3.5) | −0.52, 3.09 | 0.163 |
| Quadriceps strength (N) | 213.2 (74.4) | 154.4 (68.3) | −87.49, −30.17 | <0.001 |
| One-leg standing time (s) | 31.4 (23.3) | 33.5 (24.9) | −7.79, 11.92 | 0.657 |
| Knee pain | 1.5 (1.8) | 1.8 (2.1) | −0.57, 1.08 | 0.482 |
| FTA | 176.8 (1.4) | 176.9 (1.5) | −0.21, 0.57 | 0.654 |
| PROMs | ||||
| KOOS symptoms | 48.9 (19.0) | 49.5 (16.5) | −6.72, 7.81 | 0.882 |
| KOOS pain | 46.9 (19.6) | 41.5 (19.1) | −13.05, 0.26 | 0.164 |
| KOOS ADL | 52.1 (20.3) | 50.2 (18.4) | −9.69, 5.96 | 0.639 |
| KOOS Sport/Rec | 22.1 (16.9) | 13.8 (11.6) | −14.72, −2.04 | 0.010 |
| KOOS QOL | 26.8 (17.7) | 26.0 (19.7) | −7.90, 6.15 | 0.806 |
| Variable | Increased PA Group (n = 174) | Decreased PA Group (n = 30) | 95% CI | p Value |
|---|---|---|---|---|
| Operative side | ||||
| Cross-sectional area | ||||
| Vastus medialis (cm2) | 11.6 (1.8) | 10.4 (1.5) | −1.53, −0.30 | <0.001 |
| Vastus lateralis (cm2) | 19.2 (1.1) | 19.1 (1.0) | −0.55, 0.33 | 0.619 |
| Vastus intermedius (cm2) | 17.1 (1.1) | 17.0 (1.0) | −0.79, 1.65 | 0.491 |
| Rectus femoris (cm2) | 6.4 (0.7) | 6.5 (0.5) | −0.21, 0.31 | 0.384 |
| Computed tomography values | ||||
| Vastus medialis (HU) | 44.5 (2.9) | 43.5 (2.9) | −2.19, 0.07 | 0.065 |
| Vastus lateralis (HU) | 45.9 (3.0) | 43.9 (3.3) | −3.23, −0.84 | <0.001 |
| Vastus intermedius (HU) | 47.4 (3.3) | 47.8 (3.6) | −0.79, 1.65 | 0.491 |
| Rectus femoris (HU) | 47.5 (3.3) | 48.0 (3.1) | −0.71, 1.83 | 0.384 |
| Non-operative side | ||||
| Cross-sectional area | ||||
| Vastus medialis (cm2) | 11.9 (1.0) | 12.0 (1.1) | −0.34, 0.46 | 0.761 |
| Vastus lateralis (cm2) | 21.9 (1.6) | 21.9 (1.7) | −0.63, 0.61 | 0.979 |
| Vastus intermedius (cm2) | 17.3 (0.8) | 17.3 (0.8) | −0.29, 0.32 | 0.923 |
| Rectus femoris (cm2) | 7.0 (0.8) | 7.0 (0.9) | −0.29, 0.31 | 0.945 |
| Computed tomography values | ||||
| Vastus medialis (HU) | 51.3 (1.7) | 51.3 (2.2) | −0.62, 0.80 | 0.801 |
| Vastus lateralis (HU) | 51.4 (1.8) | 51.3 (2.1) | −0.76, 0.68 | 0.915 |
| Vastus intermedius (HU) | 51.0 (2.5) | 51.2 (2.9) | −0.75, 1.21 | 0.646 |
| Rectus femoris (HU) | 50.6 (1.8) | 50.5 (1.8) | −0.77, 0.65 | 0.863 |
| Variable | Odds Ratio | p Value | 95% Confidence Interval | |
|---|---|---|---|---|
| Lower | Upper | |||
| Non-operative-side quadriceps strength (N) | 1.011 | 0.001 | 1.004 | 1.018 |
| KOOS Sport/Rec | 1.037 | 0.033 | 1.003 | 1.073 |
| CSA vastus medialis (operative side) | 1.544 | 0.007 | 1.124 | 2.119 |
| CTV vastus lateralis (operative side) | 1.222 | 0.005 | 1.063 | 1.404 |
Disclaimer/Publisher’s Note: The statements, opinions and data contained in all publications are solely those of the individual author(s) and contributor(s) and not of MDPI and/or the editor(s). MDPI and/or the editor(s) disclaim responsibility for any injury to people or property resulting from any ideas, methods, instructions or products referred to in the content. |
© 2025 by the authors. Licensee MDPI, Basel, Switzerland. This article is an open access article distributed under the terms and conditions of the Creative Commons Attribution (CC BY) license (https://creativecommons.org/licenses/by/4.0/).
Share and Cite
Watabe, T.; Sengoku, T.; Sakurai, G.; Yoshida, S.; Taniguchi, Y. Association of Physical Function, Quantity, and Quality of the Quadriceps with Postoperative Physical Activity Before Total Knee Arthroplasty. J. Clin. Med. 2025, 14, 294. https://doi.org/10.3390/jcm14010294
Watabe T, Sengoku T, Sakurai G, Yoshida S, Taniguchi Y. Association of Physical Function, Quantity, and Quality of the Quadriceps with Postoperative Physical Activity Before Total Knee Arthroplasty. Journal of Clinical Medicine. 2025; 14(1):294. https://doi.org/10.3390/jcm14010294
Chicago/Turabian StyleWatabe, Takaya, Takuya Sengoku, Goro Sakurai, Shinya Yoshida, and Yuta Taniguchi. 2025. "Association of Physical Function, Quantity, and Quality of the Quadriceps with Postoperative Physical Activity Before Total Knee Arthroplasty" Journal of Clinical Medicine 14, no. 1: 294. https://doi.org/10.3390/jcm14010294
APA StyleWatabe, T., Sengoku, T., Sakurai, G., Yoshida, S., & Taniguchi, Y. (2025). Association of Physical Function, Quantity, and Quality of the Quadriceps with Postoperative Physical Activity Before Total Knee Arthroplasty. Journal of Clinical Medicine, 14(1), 294. https://doi.org/10.3390/jcm14010294