
The Role of Inflammatory and Nutritional Indices in Postmenopausal Osteoporosis: A Retrospective Study

 , , , and
Abstract
1. Introduction
2. Materials and Methods
Statistical Analysis
3. Results
4. Discussion
5. Conclusions
Author Contributions
Funding
Institutional Review Board Statement
Informed Consent Statement
Data Availability Statement
Conflicts of Interest
References
- Notelovitz, M. Optimizing Women’s Health: Adult Women’s Health & Medicine. Climacteric 2005, 8, 205–209. [Google Scholar] [CrossRef] [PubMed]
- TURKSTAT Corporate. Available online: https://data.tuik.gov.tr/Bulten/Index?p=37221&dil=2 (accessed on 26 May 2024).
- Hadji, P.; Gottschalk, M.; Ziller, V.; Kalder, M.; Jackisch, C.; Wagner, U. Bone Mass and the Risk of Breast Cancer: The Influence of Cumulative Exposure to Oestrogen and Reproductive Correlates. Results of the Marburg Breast Cancer and Osteoporosis Trial (MABOT). Maturitas 2007, 56, 312–321. [Google Scholar] [CrossRef]
- Black, D.M.; Rosen, C.J. Clinical Practice. Postmenopausal Osteoporosis. N. Engl. J. Med. 2016, 374, 254–262. [Google Scholar] [CrossRef] [PubMed]
- Eastell, R.; Szulc, P. Use of Bone Turnover Markers in Postmenopausal Osteoporosis. Lancet Diabetes Endocrinol. 2017, 5, 908–923. [Google Scholar] [CrossRef]
- Mutlu, M.; Argun, M.; Kilic, E.; Saraymen, R.; Yazar, S. Magnesium, Zinc and Copper Status in Osteoporotic, Osteopenic and Normal Post-Menopausal Women. J. Int. Med. Res. 2007, 35, 692–695. [Google Scholar] [CrossRef] [PubMed]
- Chee, W.S.S.; Suriah, A.R.; Zaitun, Y.; Chan, S.P.; Yap, S.L.; Chan, Y.M. Dietary Calcium Intake in Postmenopausal Malaysian Women: Comparison between the Food Frequency Questionnaire and Three-Day Food Records. Asia Pac. J. Clin. Nutr. 2002, 11, 142–146. [Google Scholar] [CrossRef] [PubMed]
- Zhang, H.; Wang, Q.; Deng, M.; Chen, Y.; Liu, W.; Huang, J.; Zhang, Z. Association between Homocysteine, C-Reactive Protein, Lipid Level, and Sleep Quality in Perimenopausal and Postmenopausal Women. Medicine 2021, 100, e28408. [Google Scholar] [CrossRef]
- Limmer, A.; Wirtz, D.C. Osteoimmunology: Influence of the Immune System on Bone Regeneration and Consumption. Z. Orthop. Unf. 2017, 155, 273–280. [Google Scholar] [CrossRef] [PubMed]
- Du, Y.N.; Chen, Y.J.; Zhang, H.Y.; Wang, X.; Zhang, Z.F. Inverse Association between Systemic Immune-Inflammation Index and Bone Mineral Density in Postmenopausal Women. Gynecol. Endocrinol. 2021, 37, 650–654. [Google Scholar] [CrossRef] [PubMed]
- Lee, S.-H.; Ryu, S.-Y.; Park, J.; Shin, M.-H.; Han, M.-A.; Choi, S.-W. The Relationship of Neutrophil-Lymphocyte Ratio and Platelet-Lymphocyte Ratio with Bone Mineral Density in Korean Postmenopausal Women. Chonnam Med. J. 2019, 55, 150–155. [Google Scholar] [CrossRef] [PubMed]
- Koseoglu, S.B. Bone Loss & Platelet-to-Lymphocyte Ratio. Biomark. Med. 2017, 11, 5–10. [Google Scholar] [CrossRef] [PubMed]
- Nie, Y.-Z.; Yan, Z.-Q.; Yin, H.; Shan, L.-H.; Wang, J.-H.; Wu, Q.-H. Osteosarcopenic Obesity and Its Components-Osteoporosis, Sarcopenia, and Obesity-Are Associated with Blood Cell Count-Derived Inflammation Indices in Older Chinese People. BMC Geriatr. 2022, 22, 532. [Google Scholar] [CrossRef] [PubMed]
- Fucà, G.; Guarini, V.; Antoniotti, C.; Morano, F.; Moretto, R.; Corallo, S.; Marmorino, F.; Lonardi, S.; Rimassa, L.; Sartore-Bianchi, A.; et al. The Pan-Immune-Inflammation Value Is a New Prognostic Biomarker in Metastatic Colorectal Cancer: Results from a Pooled-Analysis of the Valentino and TRIBE First-Line Trials. Br. J. Cancer 2020, 123, 403–409. [Google Scholar] [CrossRef] [PubMed]
- Zinellu, A.; Paliogiannis, P.; Sotgiu, E.; Mellino, S.; Mangoni, A.A.; Zinellu, E.; Negri, S.; Collu, C.; Pintus, G.; Serra, A.; et al. Blood Cell Count Derived Inflammation Indexes in Patients with Idiopathic Pulmonary Fibrosis. Lung 2020, 198, 821–827. [Google Scholar] [CrossRef] [PubMed]
- Bouillanne, O.; Morineau, G.; Dupont, C.; Coulombel, I.; Vincent, J.-P.; Nicolis, I.; Benazeth, S.; Cynober, L.; Aussel, C. Geriatric Nutritional Risk Index: A New Index for Evaluating at-Risk Elderly Medical Patients. Am. J. Clin. Nutr. 2005, 82, 777–783. [Google Scholar] [CrossRef]
- Doi, S.; Iwata, H.; Wada, H.; Funamizu, T.; Shitara, J.; Endo, H.; Naito, R.; Konishi, H.; Tsuboi, S.; Ogita, M.; et al. A Novel and Simply Calculated Nutritional Index Serves as a Useful Prognostic Indicator in Patients with Coronary Artery Disease. Int. J. Cardiol. 2018, 262, 92–98. [Google Scholar] [CrossRef] [PubMed]
- Rondanelli, M.; Faliva, M.A.; Tartara, A.; Gasparri, C.; Perna, S.; Infantino, V.; Riva, A.; Petrangolini, G.; Peroni, G. An Update on Magnesium and Bone Health. Biometals 2021, 34, 715–736. [Google Scholar] [CrossRef]
- Al Alawi, A.M.; Majoni, S.W.; Falhammar, H. Magnesium and Human Health: Perspectives and Research Directions. Int. J. Endocrinol. 2018, 2018, 9041694. [Google Scholar] [CrossRef]
- Rude, R.K.; Gruber, H.E.; Norton, H.J.; Wei, L.Y.; Frausto, A.; Kilburn, J. Dietary Magnesium Reduction to 25% of Nutrient Requirement Disrupts Bone and Mineral Metabolism in the Rat. Bone 2005, 37, 211–219. [Google Scholar] [CrossRef] [PubMed]
- Reddy, P.; Edwards, L.R. Magnesium Supplementation in Vitamin D Deficiency. Am. J. Ther. 2019, 26, e124–e132. [Google Scholar] [CrossRef]
- Uwitonze, A.M.; Razzaque, M.S. Role of Magnesium in Vitamin D Activation and Function. J. Am. Osteopath. Assoc. 2018, 118, 181–189. [Google Scholar] [CrossRef]
- Baccaro, L.F.; Conde, D.; Costa-Paiva, L.; Pinto-Neto, A.M. The Epidemiology and Management of Postmenopausal Osteoporosis: A Viewpoint from Brazil. Clin. Interv. Aging 2015, 10, 583–591. [Google Scholar] [CrossRef] [PubMed]
- Jackson, R.D.; Mysiw, W.J. Insights into the Epidemiology of Postmenopausal Osteoporosis: The Women’s Health Initiative. Semin. Reprod. Med. 2014, 32, 454–462. [Google Scholar] [CrossRef] [PubMed]
- Wang, L.; Hu, Y.-Q.; Zhao, Z.-J.; Zhang, H.-Y.; Gao, B.; Lu, W.-G.; Xu, X.-L.; Lin, X.-S.; Wang, J.-P.; Jie, Q.; et al. Screening and Validation of Serum Protein Biomarkers for Early Postmenopausal Osteoporosis Diagnosis. Mol. Med. Rep. 2017, 16, 8427–8433. [Google Scholar] [CrossRef]
- Harlow, S.D.; Gass, M.; Hall, J.E.; Lobo, R.; Maki, P.; Rebar, R.W.; Sherman, S.; Sluss, P.M.; de Villiers, T.J. STRAW + 10 Collaborative Group Executive Summary of the Stages of Reproductive Aging Workshop + 10: Addressing the Unfinished Agenda of Staging Reproductive Aging. J. Clin. Endocrinol. Metab. 2012, 97, 1159–1168. [Google Scholar] [CrossRef] [PubMed]
- Kanis, J.A. Assessment of Fracture Risk and Its Application to Screening for Postmenopausal Osteoporosis: Synopsis of a WHO Report. WHO Study Group. Osteoporos. Int. 1994, 4, 368–381. [Google Scholar] [CrossRef] [PubMed]
- Zhu, Z.; Yu, P.; Wu, Y.; Wu, Y.; Tan, Z.; Ling, J.; Ma, J.; Zhang, J.; Zhu, W.; Liu, X. Sex Specific Global Burden of Osteoporosis in 204 Countries and Territories, from 1990 to 2030: An Age-Period-Cohort Modeling Study. J. Nutr. Health Aging 2023, 27, 767–774. [Google Scholar] [CrossRef]
- Huang, W.; Xiao, Y.; Wang, H.; Li, K. Association of Geriatric Nutritional Risk Index with the Risk of Osteoporosis in the Elderly Population in the NHANES. Front. Endocrinol. 2022, 13, 965487. [Google Scholar] [CrossRef]
- Wang, J.; Xing, F.; Sheng, N.; Xiang, Z. Associations of the Geriatric Nutritional Risk Index With Femur Bone Mineral Density and Osteoporosis in American Postmenopausal Women: Data From the National Health and Nutrition Examination Survey. Front. Nutr. 2022, 9, 860693. [Google Scholar] [CrossRef] [PubMed]
- Tsutsui, T.; Fujiwara, T.; Matsumoto, Y.; Kimura, A.; Kanahori, M.; Arisumi, S.; Oyamada, A.; Ohishi, M.; Ikuta, K.; Tsuchiya, K.; et al. Geriatric Nutritional Risk Index as the Prognostic Factor in Older Patients with Fragility Hip Fractures. Osteoporos. Int. 2023, 34, 1207–1221. [Google Scholar] [CrossRef] [PubMed]
- Qing, B.; Wang, N.; Wang, L.; Li, P.; Li, L.; Chen, H. Association between Geriatric Nutrition Risk Index and Bone Mineral Density in Elderly Chinese People. Arch. Osteoporos. 2021, 16, 55. [Google Scholar] [CrossRef] [PubMed]
- Fung, T.T.; McCullough, M.L.; Newby, P.K.; Manson, J.E.; Meigs, J.B.; Rifai, N.; Willett, W.C.; Hu, F.B. Diet-Quality Scores and Plasma Concentrations of Markers of Inflammation and Endothelial Dysfunction. Am. J. Clin. Nutr. 2005, 82, 163–173. [Google Scholar] [CrossRef]
- Cavicchia, P.P.; Steck, S.E.; Hurley, T.G.; Hussey, J.R.; Ma, Y.; Ockene, I.S.; Hébert, J.R. A New Dietary Inflammatory Index Predicts Interval Changes in Serum High-Sensitivity C-Reactive Protein. J. Nutr. 2009, 139, 2365–2372. [Google Scholar] [CrossRef]
- Tabung, F.K.; Steck, S.E.; Zhang, J.; Ma, Y.; Liese, A.D.; Agalliu, I.; Hingle, M.; Hou, L.; Hurley, T.G.; Jiao, L.; et al. Construct Validation of the Dietary Inflammatory Index among Postmenopausal Women. Ann. Epidemiol. 2015, 25, 398–405. [Google Scholar] [CrossRef]
- Zeng, F.F.; Xue, W.Q.; Cao, W.T.; Wu, B.H.; Xie, H.L.; Fan, F.; Zhu, H.L.; Chen, Y.M. Diet-Quality Scores and Risk of Hip Fractures in Elderly Urban Chinese in Guangdong, China: A Case-Control Study. Osteoporos. Int. 2014, 25, 2131–2141. [Google Scholar] [CrossRef]
- Kim, H.-R.; Kang, M.G.; Kim, K.; Koh, J.-S.; Park, J.R.; Hwang, S.-J.; Jeong, Y.-H.; Ahn, J.H.; Park, Y.; Bae, J.S.; et al. Comparative Analysis of Three Nutrition Scores in Predicting Mortality after Acute Myocardial Infarction. Nutrition 2021, 90, 111243. [Google Scholar] [CrossRef] [PubMed]
- Castiglioni, S.; Cazzaniga, A.; Albisetti, W.; Maier, J.A.M. Magnesium and Osteoporosis: Current State of Knowledge and Future Research Directions. Nutrients 2013, 5, 3022–3033. [Google Scholar] [CrossRef] [PubMed]
- Sojka, J.E.; Weaver, C.M. Magnesium Supplementation and Osteoporosis. Nutr. Rev. 1995, 53, 71–74. [Google Scholar] [CrossRef] [PubMed]
- Aydin, H.; Deyneli, O.; Yavuz, D.; Gözü, H.; Mutlu, N.; Kaygusuz, I.; Akalin, S. Short-Term Oral Magnesium Supplementation Suppresses Bone Turnover in Postmenopausal Osteoporotic Women. Biol. Trace Elem. Res. 2010, 133, 136–143. [Google Scholar] [CrossRef]
- Kelly, O.J.; Gilman, J.C.; Ilich, J.Z. Utilizing Dietary Micronutrient Ratios in Nutritional Research May Be More Informative than Focusing on Single Nutrients. Nutrients 2018, 10, 107. [Google Scholar] [CrossRef]
- Rude, R.K.; Gruber, H.E.; Norton, H.J.; Wei, L.Y.; Frausto, A.; Mills, B.G. Bone Loss Induced by Dietary Magnesium Reduction to 10% of the Nutrient Requirement in Rats Is Associated with Increased Release of Substance P and Tumor Necrosis Factor-Alpha. J. Nutr. 2004, 134, 79–85. [Google Scholar] [CrossRef] [PubMed]
- Fouhy, L.E.; Mangano, K.M.; Zhang, X.; Hughes, B.D.; Tucker, K.L.; Noel, S.E. Association between a Calcium-to-Magnesium Ratio and Osteoporosis among Puerto Rican Adults. J. Nutr. 2023, 153, 2642–2650. [Google Scholar] [CrossRef] [PubMed]


| Osteoporosis Group n: 61 | Osteopenia Group n: 153 | Control Group n: 154 | p-Value | |
|---|---|---|---|---|
| Age (year) | 61 ± 9 | 57 ± 8 | 55 ± 8 | <0.001 a |
| Gravida | 4 ± 3 | 3 ± 2 | 3 ± 2 | 0.540 |
| Parity | 3 ± 2 | 2 ± 1 | 2 ± 1 | 0.107 |
| BMI (kg/m2) | 27.7 ± 35 | 28.5 ± 4.7 | 29.8 ± 5.6 | 0.029 b |
| Age of menopause (year) | 48 ± 4 | 48 ± 5 | 48 ± 4 | 0.485 |
| Duration of menopause (year) | 12 ± 10 | 9 ± 9 | 7 ± 8 | 0.001 b |
| STRAW stage | 0.008 | |||
| 1a | 5 (8.2%) | 34 (22.2%) | 51 (33.1%) | |
| 1b | 3 (4.9%) | 10 (6.5%) | 12 (7.8%) | |
| 1c | 12 (19.7%) | 27 (17.6%) | 23 (14.9%) | |
| 2 | 41 (67.2%) | 82 (53.6%) | 68 (44.2%) | |
| Bone mineral density (T-score) | −2.98 ± 0.44 | −1.72 ± 0.46 | 0.21 ± 1.02 | <0.001 |
| Albumin (g/dL) | 4.30 ± 0.27 | 4.24 ± 0.28 | 4.24 ± 0.29 | 0.450 |
| Total cholesterol (mg/dL) | 221.6 (183.9–259.8) | 221.1 (190.1–254) | 209.7 (191.7–236.7) | 0.170 |
| Triglyceride (mg/dL) | 137 (89.5–169) | 121 (83–171) | 128 (88–186) | 0.649 |
| Hemoglobin (g/dL) | 13.4 ± 1 | 13.3 ± 1.1 | 13.4 ± 1.2 | 0.999 |
| Neutrophil (×103/uL) | 3.69 (2.97–4.31) | 3.55 (2.81–4.42) | 3.53 (2.87–4.46) | 0.905 |
| Lymphocyte (×103/uL) | 1.96 (1.65–2.53) | 2.11 (1.64–2.52) | 2.22 (1.86–2.58) | 0.131 |
| Monocyte (×103/uL) | 0.39 (0.29–0.49) | 0.35 (0.28–0.41) | 0.36 (0.30–0.44) | 0.116 |
| Platelet (×103/uL) | 281 (226.5–317) | 259.5 (220–300) | 272 (230–309) | 0.186 |
| Osteoporosis Group n: 61 | Osteopenia Group n: 153 | Control Group n: 154 | p-Value | |
|---|---|---|---|---|
| GNRI | 116 ± 9.4 | 117.2 ± 9.8 | 119.9 ± 11.3 | 0.013 a |
| TCBI | 1757 (1245–2866) | 1941 (1183–2865) | 2040 (1165–3358) | 0.535 |
| PNI | 53.5 ± 4.5 | 52.8 ± 4.3 | 53.8 ± 4.9 | 0.176 |
| HALP score | 42.3 (34.6–54.4) | 46.9 (35.3–57.7) | 45.4 (34.8–59.7) | 0.508 |
| NLR | 1.70 (1.38–2.11) | 1.66 (1.36–2.17) | 1.59 (1.28–2.01) | 0.232 |
| PLR | 134 (111.2–159) | 123.3 (100–155) | 125 (102–155.9) | 0.351 |
| MLR | 0.17 (0.13–0.23) | 0.17 (0.14–0.20) | 0.16 (0.14–0.20) | 0.234 |
| SII | 466.8 (363.3–617.3) | 426.5 (330.9–576.4) | 416.2 (333.1–581.4) | 0.384 |
| SIRI | 0.64 (0.44–0.89) | 0.58 (0.43–0.81) | 0.57 (0.43–0.81) | 0.331 |
| PIV | 169.5 (118.2–259.5) | 147.3 (101.1–226) | 152.9 (108.7–216) | 0.166 |
| 25-OH Vitamin D (ng/mL) | 24.11 ± 11.51 | 26.51 ± 17.39 | 22.53 ± 10.80 | 0.438 |
| Na (mEq/L) | 139.1 ± 2.9 | 139.3 ± 2.3 | 139.4 ± 2.6 | 0.751 |
| K (mEq/L) | 4.32 ± 0.26 | 4.33 ± 0.34 | 4.26 ± 0.35 | 0.344 |
| Ca (mEq/L) | 9.50 (9.30–9.75) | 9.50 (9.30–9.82) | 9.50 (9.20–9.70) | 0.525 |
| Mg (mEq/L) | 2 (1.9–2) | 2.1 (1.9–2.1) | 2.2 (1.96–2.2) | 0.007 b |
| Na/K | 32.2 ± 2 | 32.4 ± 2.5 | 32.9 ± 2.8 | 0.430 |
| Na/Ca | 14.6 ± 0.8 | 14.7 ± 0.7 | 14.8 ± 0.7 | 0.226 |
| Na/Mg | 71.2 (67.4–74.7) | 71 (66.2–74.7) | 67.1 (65.2–72.5) | 0.009 b |
| K/Mg | 2.1 (2–2.26) | 2.19 (2.05–2.37) | 2.15 (1.95–2.39) | 0.263 |
| Ca/K | 2.21 ± 0.16 | 2.21 ± 0.19 | 2.23 ± 0.22 | 0.907 |
| Ca/Mg | 4.57 (4.33–4.95) | 4.80 (4.52–5.11) | 4.84 (4.52–5.17) | 0.045 a |
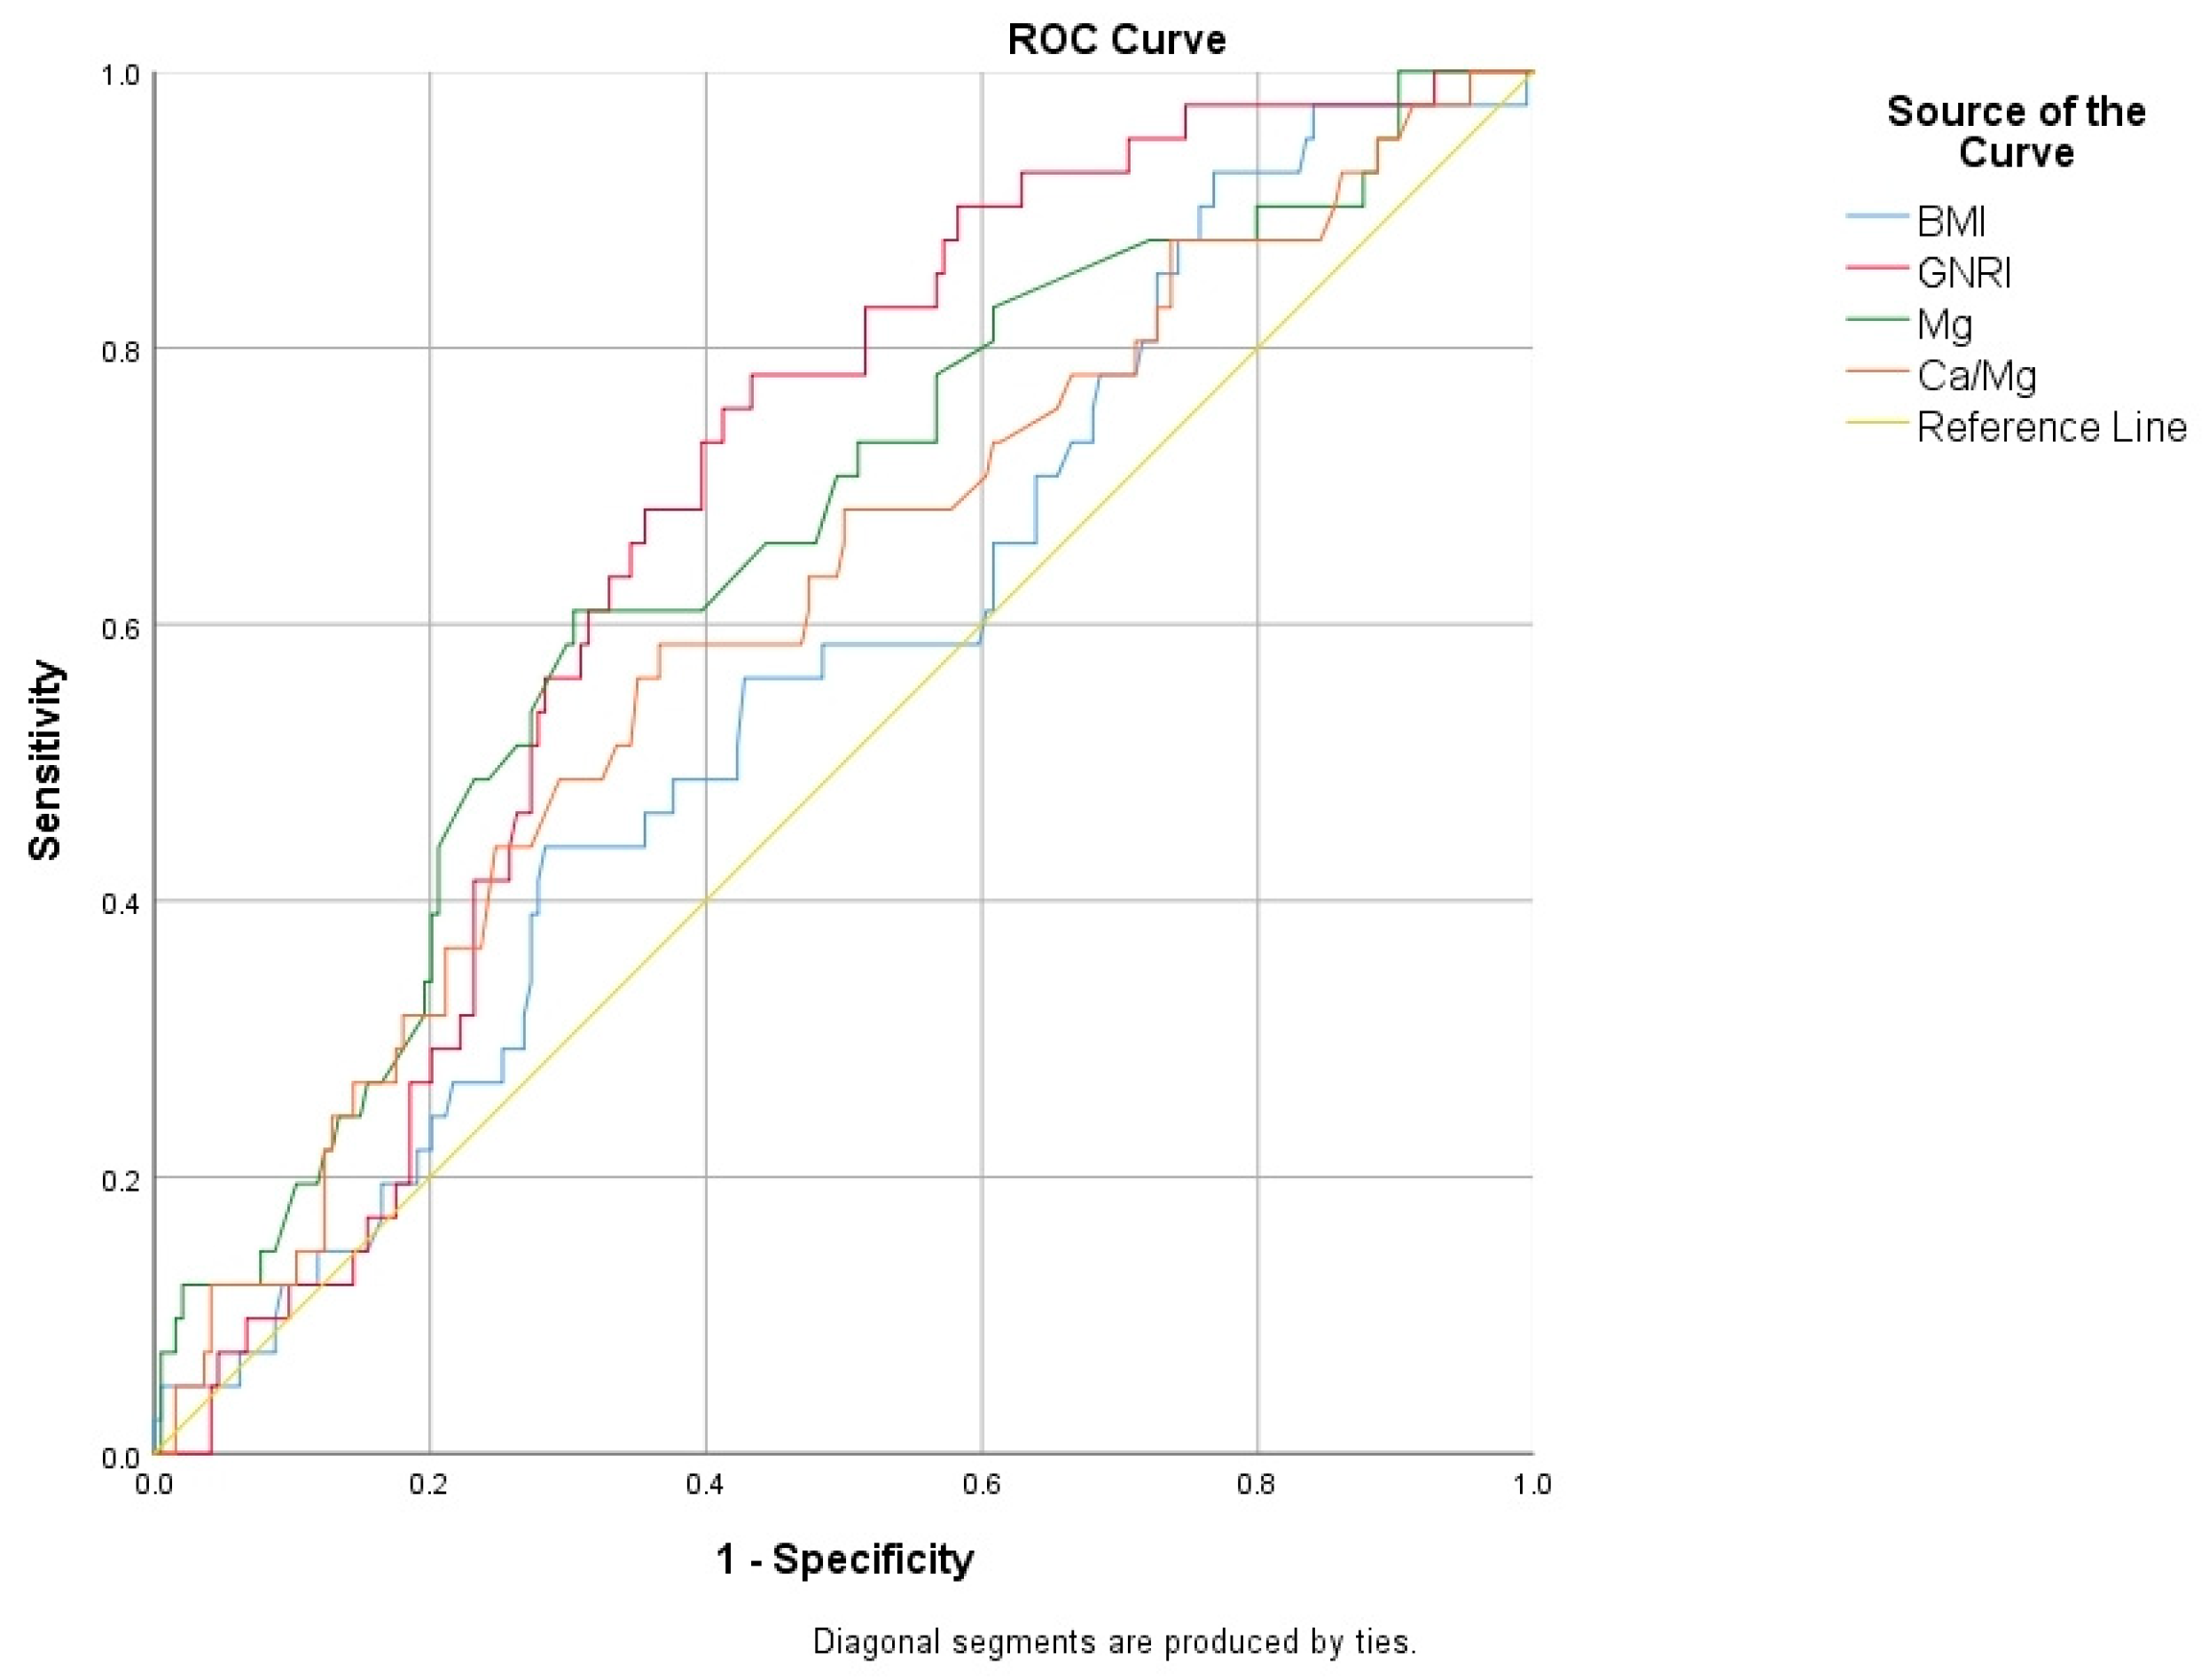
| AUC | 95% CI | Cut-Off Value | Sensitivity (%) | Specificity (%) | p-Value | |
|---|---|---|---|---|---|---|
| Age (year) | 0.627 | 0.556–0.698 | 56.5 | 65.6 | 53.8 | 0.002 |
| BMI (kg/m2) | 0.563 | 0.471–0.656 | 28.1 | 45 | 44.8 | 0.047 |
| Duration of menopause (year) | 0.624 | 0.551–0.698 | 7.5 | 60.7 | 58.3 | 0.002 |
| GNRI | 0.674 | 0.597–0.752 | 116.6 | 58.9 | 58.3 | 0.002 |
| Mg (mEq/L) | 0.652 | 0.560–0.743 | 1.98 | 72.5 | 54.3 | 0.002 |
| Na/Mg | 0.635 | 0.552–0.719 | 69.7 | 59.5 | 53.6 | 0.002 |
| Ca/Mg | 0.606 | 0.510–0.701 | 4.69 | 49.8 | 49.3 | 0.033 |
| r | p-Value | |
|---|---|---|
| Age (year) | −0.168 | 0.001 |
| Gravida | −0.094 | 0.178 |
| Parity | −0.164 | 0.014 |
| BMI (kg/m2) | 0.213 | <0.001 |
| Age of menopause (year) | 0.027 | 0.606 |
| Duration of menopause (year) | −0.173 | 0.001 |
| STRAW stage | −0.145 | 0.005 |
| Albumin (g/dL) | −0.072 | 0.168 |
| Total cholesterol (mg/dL) | −0.130 | 0.013 |
| Triglyceride (mg/dL) | 0.209 | <0.001 |
| Hemoglobin (g/dL) | 0.022 | 0.675 |
| Neutrophil (×103/uL) | −0.010 | 0.843 |
| Lymphocyte (×103/uL) | 0.099 | 0.059 |
| Monocyte (×103/uL) | −0.011 | 0.829 |
| Platelet (×103/uL) | 0.039 | 0.454 |
| r | p-Value | |
|---|---|---|
| GNRI | 0.179 | 0.001 |
| TCBI | 0.111 | 0.033 |
| PNI | 0.045 | 0.386 |
| HALP score | 0.035 | 0.504 |
| NLR | −0.036 | 0.500 |
| PLR | −0.044 | 0.407 |
| MLR | −0.063 | 0.236 |
| SII | −0.039 | 0.462 |
| SIRI | −0.030 | 0.576 |
| PIV | −0.033 | 0.540 |
| 25-OH Vitamin D (ng/mL) | −0.063 | 0.352 |
| Na (mEq/L) | 0.040 | 0.518 |
| K (mEq/L) | −0.059 | 0.334 |
| Ca (mEq/L) | −0.060 | 0.289 |
| Mg (mEq/L) | 0.155 | 0.006 |
| Na/K | 0.075 | 0.227 |
| Na/Ca | 0.078 | 0.223 |
| Na/Mg | −0.179 | 0.005 |
| K/Mg | −0.019 | 0.757 |
| Ca/K | 0.047 | 0.449 |
| Ca/Mg | 0.116 | 0.049 |
Disclaimer/Publisher’s Note: The statements, opinions and data contained in all publications are solely those of the individual author(s) and contributor(s) and not of MDPI and/or the editor(s). MDPI and/or the editor(s) disclaim responsibility for any injury to people or property resulting from any ideas, methods, instructions or products referred to in the content. |
© 2024 by the authors. Licensee MDPI, Basel, Switzerland. This article is an open access article distributed under the terms and conditions of the Creative Commons Attribution (CC BY) license (https://creativecommons.org/licenses/by/4.0/).
Share and Cite
Demir Cendek, B.; Bayraktar, B.; Sapmaz, M.A.; Yıldırım, A.E.; Can Ibanoglu, M.; Engin Ustun, Y. The Role of Inflammatory and Nutritional Indices in Postmenopausal Osteoporosis: A Retrospective Study. J. Clin. Med. 2024, 13, 7741. https://doi.org/10.3390/jcm13247741
Demir Cendek B, Bayraktar B, Sapmaz MA, Yıldırım AE, Can Ibanoglu M, Engin Ustun Y. The Role of Inflammatory and Nutritional Indices in Postmenopausal Osteoporosis: A Retrospective Study. Journal of Clinical Medicine. 2024; 13(24):7741. https://doi.org/10.3390/jcm13247741
Chicago/Turabian StyleDemir Cendek, Busra, Burak Bayraktar, Mehmet Alican Sapmaz, Ayse Ecenaz Yıldırım, Mujde Can Ibanoglu, and Yaprak Engin Ustun. 2024. "The Role of Inflammatory and Nutritional Indices in Postmenopausal Osteoporosis: A Retrospective Study" Journal of Clinical Medicine 13, no. 24: 7741. https://doi.org/10.3390/jcm13247741
APA StyleDemir Cendek, B., Bayraktar, B., Sapmaz, M. A., Yıldırım, A. E., Can Ibanoglu, M., & Engin Ustun, Y. (2024). The Role of Inflammatory and Nutritional Indices in Postmenopausal Osteoporosis: A Retrospective Study. Journal of Clinical Medicine, 13(24), 7741. https://doi.org/10.3390/jcm13247741