Abstract
Background: Early allograft failure (EAF) significantly contributes to mortality, necessitating re-transplantation following liver transplantation. The EAF simplified estimation (EASE) score has been recently developed to predict EAF. We aimed to assess the predictive capacity of high EASE scores for EAF and postoperative outcomes and to evaluate the association between the lymphocyte count-to-C-reactive protein ratio (LCR) and high EASE scores after living donor liver transplantation (LDLT). Methods: We retrospectively analyzed the data of 808 patients who underwent LDLT. After excluding 16 patients with incomplete laboratory data, the final cohort included 792 patients. Patients with EASE scores ≥−0.74 were categorized into the high EASE group. Multivariate logistic regression was used to examine the association between the LCR and high EASE scores. Results: High EASE scores demonstrated superior predictive accuracy for EAF development relative to that of the early allograft dysfunction (EAD) model (p = 0.018) and were more closely associated with overall mortality (p = 0.033). A preoperative LCR < 12.7 significantly increased the odds (odds ratio, 3.3; confidence interval, 1.997–5.493) of exhibiting high EASE scores post-LDLT, alongside preoperative hematocrit levels, operative duration, intraoperative continuous renal replacement therapy, administered calcium dose, mean heart rate, and donor age. Conclusions: The EASE score could offer enhanced utility for predicting EAF and overall mortality following LDLT relative to that of EAD. Identifying and managing risk factors, including low LCR values, for elevated EASE scores is essential for improving patient prognoses.
1. Introduction
Living donor liver transplantation (LDLT) is a well-established curative intervention in patients with advanced liver disease [1]. Early allograft failure (EAF) refers to the loss of the graft through either re-transplantation or patient death within the initial three months post-transplantation [2,3]. Consequently, EAF following liver transplantation (LT) poses a significant clinical challenge, which impacts both graft and recipient survival. Olthoff et al. [4] introduced a widely recognized method for predicting EAF using the early allograft dysfunction (EAD) model, which considers postoperative levels of aspartate aminotransferase (AST), alanine aminotransferase (ALT), serum bilirubin, and international normalized ratio (INR). The EAF simplified estimation (EASE) score, a newly developed model, estimates EAF by incorporating perioperative factors such as the model for end-stage liver disease (MELD) score, volume of packed red blood cell (PRBC) units transfused during the procedure, presence of hepatic vessel thrombosis, and case volume of the transplant center (≥70 per year) [5]. The EASE score has demonstrated high predictive value for estimating EAF after LT and has proven superior to the EAD model [5,6]. Therefore, early identification of patients with high EASE scores is essential for effective patient management and timely intervention. EASE risk groups for graft and patient survival range between 1 and 5, with higher numbers indicating increased risk. We considered risk groups 4 and 5 as high-risk and evaluated the predictive value of a high EASE score (≥−0.74) in relation to that using the EAD model.
A decreased total lymphocyte count helps predict the risk of postoperative complications owing to malnutrition [7]. Moreover, low lymphocyte counts correlate with the severity of liver cirrhosis [8]. C-reactive protein (CRP), an acute-phase inflammatory marker produced in the liver, manifests elevated levels in advanced liver disease and correlates with increased mortality from systemic inflammation [9]. The lymphocyte count-to-CRP ratio (LCR) has been associated with symptom severity in patients with coronavirus disease 2019 [10] and exhibits predictive value for various clinical conditions, including cancer and myocardial infarction [11,12]. However, the relationship between LCR and morbidity following LT remains unexplored.
Therefore, we investigated the predictive value of a high EASE score in estimating EAF and other outcomes, including acute kidney injury (AKI) and overall mortality. Moreover, we examined the risk factors for high EASE scores using multivariate logistic analysis.
2. Patients and Methods
2.1. Study Population
Data of 808 adult patients (aged over 19 years) who underwent elective LDLT at Seoul St. Mary’s Hospital from January 2009 to July 2022 were retrospectively collected using the electronic medical record system. The inclusion criteria included adult patients (age ≥ 19 years) undergoing primary LDLT. The exclusion criteria included cases of incomplete data resulting from death before postoperative day (POD) 10 or other causes. After these exclusions, the final cohort comprised 792 adult patients.
2.2. Living Donor Liver Transplantation
A team of expert surgeons and anesthesiologists performed transplantation surgery and administered general anesthesia. The transplantation procedure was performed under general anesthesia by an experienced team of surgeons and anesthesiologists. Using the piggyback technique, which preserved the recipient’s inferior vena cava, the right lobe of the liver was transplanted. Following the completion of the vascular and ductal connections, Doppler ultrasonography was used to confirm proper hepatic blood flow, such as portal venous flow and the hepatic artery resistive index. Interventions such as splenectomy or portocaval shunt were applied, if necessary. General anesthesia was adjusted for maintaining stable hemodynamics, ensuring that the mean blood pressure (MBP) was kept at or above 65 mmHg, and the central venous pressure (CVP) remained at or below 10 mmHg. Transfusion practices were employed to ensure adequate blood component supply and to stabilize vital signs [13]. PRBCs were administered to maintain a hematocrit level ≥25%. Furthermore, coagulation factors such as fresh frozen plasma (FFP), single donor platelets, and cryoprecipitate were provided based on laboratory test results or thromboelastography findings.
Patients experiencing severe preoperative kidney function loss underwent continuous renal replacement therapy (CRRT) during surgery [14,15]. Profound postreperfusion syndrome was identified by a decrease in MBP by ≥30% compared with that of the anhepatic phase, hypotension lasting ≥5 min, severe arrhythmias, or the need for vasopressors (epinephrine or norepinephrine).
Immunosuppression was managed according to the LDLT protocol of our institution, which included administration of basiliximab, calcineurin inhibitors, mycophenolate mofetil, and prednisolone, as well as postoperative tapering of immunosuppressants.
2.3. Early Allograft Failure Simplified Estimation Score
The EASE score was calculated using the following formula [16]: EASE = −0.602 + 0.044 × (MELD score at transplantation) + 0.065 × (number of transfused PRBC units during the procedure) + 2.567 (occurrence of hepatic vascular thrombosis during postoperative days [PODs] 1–10) + 0.000534 × (area under the receiver operating characteristic curve [AUC] for AST on PODs 1, 2, 3, 7, and 10)2 − 0.093 × (AUC for platelet count on PODs 1, 3, 7, and 10)–7.766 × (slope for platelet count on PODs 1, 3, 7, and 10) + 0.795 × (slope for bilirubin on PODs 1, 3, 7, and 10) − 0.402 (if annual center volume ≥70 cases). Risk groups were defined as follows: group 1: EASE score < −3.43, group 2: −3.43 ≤ EASE score ≤ −1.26, group 3: −1.25 ≤ EASE score ≤ −0.75, group 4: −0.74 ≤ EASE score ≤ −0.01, and group 5: 0 ≤ EASE score ≤ 5. Groups 4 and 5 were considered high-risk groups.
2.4. Early Allograft Failure
EAF was defined as a graft failure that resulted in death or the need for re-transplantation for any reason by 3 months after surgery [2,3].
2.5. Early Allograft Dysfunction
EAD was diagnosed if one or more of the following postoperative laboratory findings were present: total bilirubin ≥ 10 mg/dL on POD 7, an INR ≥ 1.6 on POD 7, or ALT or AST levels exceeding 2000 IU/L within the first seven PODs [4,17].
2.6. Lymphocyte and CRP Measurements
Laboratory parameters were measured using blood samples collected in tubes with either ethylenediaminetetraacetic acid (EDTA) as an anticoagulant (BD Vacutainer, K2 EDTA; Becton, Dickinson and Company, Franklin Lakes, NJ, USA) or with clot activator in a serum separator tube (BD Vacutainer, Becton, Dickinson and Co., Franklin Lakes, NJ, USA). Lymphocyte counts were measured in samples collected in EDTA-coated tubes, while CRP levels were measured in samples in serum clot activator tubes.
LCR = lymphocyte count (per µL)/CRP (mg/dL)/100.
The optimal cutoff value of LCR (<12.7) in predicting a high EASE score was identified using area under the curve analysis (AUC: 0.705; 95% confidence interval [CI]: 0.672–0.737; p < 0.001).
2.7. Recipient and Graft-Donor Variables
The study included variables such as sex, age, body mass index (BMI), underlying causes of end-stage liver disease, MELD score, diabetes mellitus, hypertension, hepatic decompensation (e.g., varices and ascites), and echocardiographic parameters (ejection fraction and presence of diastolic dysfunction). Varices were confirmed by either preoperative esophagogastroduodenoscopy or a history of variceal bleeding, while ascites was confirmed by CT or a history of ascites tapping. To assess left ventricular ejection fraction, we used the modified Simpson method, measuring the apical four-chamber and apical two-chamber views at end diastole and end systole. Diastolic dysfunction was diagnosed if at least three of the following criteria were met: (1) medial e’ < 7 cm/s (or lateral e’ < 10 cm/s); (2) average E/e’ ≥ 15; (3) left atrial volume index > 34 mL/m2; or (4) tricuspid regurgitation velocity > 2.8 m/s.
The laboratory variables included hematocrit, LCR, total bilirubin, INR, albumin level, platelet count, and white blood cell count, as well as calcium, glucose, creatinine, sodium, ammonia, and potassium concentrations, which were all assessed. The intraoperative variables included operative time, intraoperative CRRT, mean heart rate, MBP, CVP, occurrence of postreperfusion syndrome, total amount of calcium infused, blood product transfusion (PRBC, FFP, and PC) fluid infusion rate per hour, and urine output per hour. Donor-graft variables included graft-to-recipient weight ratio, the percentage of fatty change, the ischemic time of the graft, donor age, and sex.
Outcomes after surgery included overall patient mortality, AKI, and graft rejection [18].
2.8. Statistical Analysis
The perioperative findings were analyzed using the Chi-squared (χ2), Fisher’s exact, or Mann–Whitney U tests. The predictive values of the EASE score, a high EASE score, EAD for EAF occurrence, and postoperative outcomes were compared using the AUC method and Delong’s test. The relationship between the perioperative findings and a high EASE score was examined through both univariable and multivariable logistic regression analyses. After univariate logistic analysis, factors with possible significance (p < 0.1) were fitted into multivariate logistic regression analyses, conducted using both forward and backward selection methods. Laboratory findings are presented as numbers (percentages) or medians (interquartile ranges [IQRs]). Statistical significance was set at p < 0.05. SPSS for Windows (version 24.0, SPSS Inc., Chicago, IL, USA) and MedCalc Statistical Software, version 23.0.2 (MedCalc Software bv, Ostend, Belgium), were used for these analyses.
3. Results
3.1. Patient Characteristics
The study cohort consisted primarily of men, accounting for 70.2% of the population. The median age, BMI, and MELD scores were 54 years (IQR: 48–60), 24.1 kg/m2 (IQR: 21.9–26.6), and 14 points (IQR: 7–24), respectively. The etiologies of liver disease were hepatitis B (54.2%), alcoholic liver disease (22.3%), hepatitis C (6.7%), cryptogenic disease (6.7%), hepatitis A (4.3%), autoimmune disease (4.2%), and drug-induced or toxic disease (1.6%). The median EASE score and LCR were −3.0 (IQR: −3.9–−1.7) and 19.4 (IQR: 4.9–80.0), respectively.
3.2. Comparison of the Prevalence of a High EASE Score and EAD
The incidence of EAF at 3 months after LDLT was 44 of 792 (5.5%). In patients with EAF, the number of patients with a high EASE score and EAD was 31 (70.5%) and 22 (50%), respectively (Table 1).

Table 1.
Comparison of the prevalence of a high EASE score and EAD in patients with EAF.
3.3. Comparison of the Predictive Value of the EASE Score, High EASE Score, and EAD for EAF Development
We compared the AUCs for EAF among the EASE score, a high EASE score, and EAD (0.841, 0.791, and 0.690, respectively; Figure 1). According to Delong’s method, both the EASE score and a high EASE score showed a significantly better predictive ability than did the EAD (p < 0.001 and 0.018, respectively).
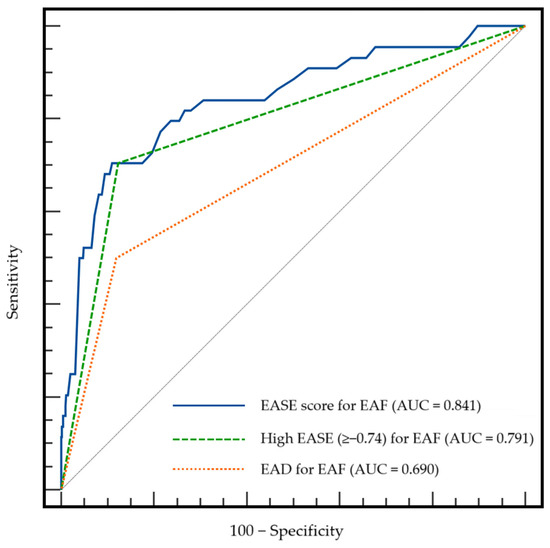
Figure 1.
Comparison of AUCs among the EASE score, a high EASE score, and EAD for EAF. AUC, area under the receiver operating characteristic curve; EAD, early allograft dysfunction; EAF, early allograft failure; EASE, early allograft failure simplified estimation.
3.4. Comparison of the Predictive Accuracy of a High EASE Score and EAD for Postoperative Outcomes
We compared the AUCs for postoperative outcomes of a high EASE score and EAD. A high EASE score showed significantly better predictive value for overall patient mortality than did the EAD (p = 0.033). However, AUCs for AKI, graft rejection, infection, and graft failure were not significantly different (p = 0.185, 0.798, 0.233, and 0.148, respectively; Table 2). The overall mortality rate was 14% (111 of 792 patients), with a median follow-up duration of 5.4 years (IQR: 2.9–7.6 years); the follow-up duration ranged from 10 days to 12 years. The primary cause of death after LT was infection, with an incidence of 8.5%.
Table 2.
Comparison of the predictive accuracy of a high EASE score and EAD for postoperative outcomes.
Regarding 1-year and 5-year mortality, the AUCs for high EASE and EAD scores were 0.684 vs. 0.621 and 0.650 vs. 0.593, respectively, indicating that early mortality was more accurately predicted.
3.5. Comparison of Perioperative Variables Between Low and High EASE Groups
Preoperative recipient variables, including the hematocrit, MELD score, ascites, LCR, platelets, creatinine, total bilirubin, and INR, were significantly different between the high and low EASE groups (Table 3).
Table 3.
Preoperative recipient variables in the low and high EASE groups.
Intraoperative and donor-graft variables, including intraoperative CRRT, operative time, calcium infusion dose, mean heart rate, blood product transfusion (PRBC, FFP, and platelet concentrate), hourly urine output, hourly fluid infusion, and donor age, were significantly different between the low and high EASE groups (Table 4).
Table 4.
Intraoperative recipient and donor-graft variables in the low and high EASE groups.
3.6. Association of Perioperative Variables with a High EASE Score
Multivariate logistic regression analysis (Table 5) helped identify LCR as a significant predictor of high EASE scores, along with factors including preoperative hematocrit, operative time, intraoperative CRRT, calcium infusion dose, mean heart rate, and donor age. The model had an AUC of 0.803 (95% CI: 0.774–0.831), with a sensitivity of 75.8% and a specificity of 72.6% (p < 0.001). Furthermore, patients with a low LCR were more than three times as likely to develop EAD than were those with a high LCR (odds ratio [OR]: 3.31; 95% CI: 1.997–5.493; p < 0.001). Compared with the AUC of the multivariate logistic regression model without LCR (0.786), the model incorporating LCR demonstrated significantly improved performance, as indicated by Delong’s test (p = 0.0033).
Table 5.
Association of pre- and intraoperative recipient and donor-graft variables with a high EASE score.
3.7. Comparison of LCR Levels in the Low and High EASE Groups
Patients in the high EASE group exhibited a lower median LCR of 5.3 (IQR: 2.2–20.0) relative to 26.1 (IQR: 6.0–93.5) in the low EASE group.
3.8. The Predictive Accuracy of LCR for EAF
The predictive value of LCR for EAF showed an AUC of 0.730 (95% CI: 0.698–0.761), with a sensitivity of 75% and a specificity of 65% (p < 0.001).
3.9. Association Between a Low LCR and Inflammatory Factors
We found a significant association between a low LCR and several inflammatory factors, including white blood cell count, albumin concentration, and CRP level (all, p < 0.001).
3.10. Association of Perioperative Variables with EAF
Using univariate analysis, the following variables were identified with a p-value < 0.1 and fitted into the multivariate analysis: preoperative BMI, ejection fraction, MELD score, ascites, creatinine, intraoperative CRRT, operative time, MBP, mean heart rate, mean CVP, total calcium infusion, hourly fluid infusion, hourly urine output, graft-recipient-weight ratio, and total ischemic time. Using multivariate analysis, BMI, operative time, intraoperative CRRT, and MBP were significantly associated with EAF. The model achieved an AUC of 0.753 (95% CI: 0.722–0.783), with a sensitivity of 75.0% and a specificity of 68.9% (p < 0.001).
3.11. Comparison of the Predictive Accuracy of Other Clinical Risk Scores for EAF
The predictive value of MELD, the balance of risk (BAR) score, and the liver graft assessment following transplantation (L-GrAFT) 7 for EAF were evaluated, revealing AUC values of 0.696, 0.697, and 0.806, respectively [2,3].
4. Discussion
Our findings indicated that a high EASE score was a more accurate predictor of EAF and other outcomes following LDLT than was the previously used EAD model. Moreover, a low LCR independently tripled the likelihood of a high EASE score post-LDLT, alongside preoperative hematocrit, intraoperative CRRT, calcium infusion dose, mean heart rate, and donor age.
Various factors influence outcomes after transplantation. Recipient and donor characteristics, as well as intra- and postoperative complications, can exacerbate graft dysfunction, ultimately leading to graft failure and death. Graft injury frequently results from ischemia and reperfusion injury (IRI) during LT, with poor recovery of the liver graft typically commencing with severe IRI, followed by ongoing coagulopathy [19]. EAF is a major contributor to patient death and re-transplantation within three months post-transplantation. Consequently, early assessment of graft function is crucial. EAD adversely affects outcomes after LT, leading to kidney damage, prolonged hospitalization, early liver graft failure, and increased mortality [4,17,20,21]. Several risk estimation models have been newly developed, including the recently introduced EASE score for EAF [5,6]. In previous studies, the EASE score showed better predictive value for EAF than did other prediction models, such as EAD. This is consistent with our finding that the EASE score was a better predictor of EAF than was EAD. We regarded the EASE score groups 4 and 5 as comprising the high EASE group (EASE score ≥−0.74), and a high EASE score also showed a higher predictive value than did EAD for both EAF and overall mortality. We also analyzed the predictive value of different scores, such as BAR and L-GrAFT 7, for EAF and found that the EASE score was the most accurate.
As prognostic markers, both lymphocyte count and CRP level have been extensively studied in various clinical contexts, including sepsis, cancer, and critical illness following ICU admission. A decreased lymphocyte count, often associated with advanced liver disease [8], possibly results from lymphocytes being recruited to the liver due to necroinflammation. Intrahepatic CD8+ T cells are significantly increased in patients with acute liver failure than the rate noted in healthy individuals [22]. Berres et al. reported that low lymphocyte counts were linked to higher mortality in patients with end-stage liver disease [23]. CRP, an acute-phase inflammatory marker synthesized primarily by the liver under conditions such as infection, trauma, and ischemia, increases in response to proinflammatory cytokines, particularly interleukin-6 [24,25,26,27,28,29,30,31,32]. Elevated CRP levels, observed during complex surgeries and in conditions such as sepsis and decompensated heart failure [28,29,30,33], correlate with increased morbidity and mortality in patients with advanced liver disease [9,34,35,36,37,38,39] and are significantly associated with outcomes related to hepatic injury or extrahepatic organ dysfunction [9,40]. Although CRP is primarily produced in the liver, other cells, such as macrophages and reserved hepatocytes, also contribute to CRP production in response to elevated interleukin-6 levels [41,42,43]. Thus, elevated CRP levels combined with a low lymphocyte count may indicate the severity and progression of liver injury.
Recent research has supported the use of the LCR as a tool for estimating outcomes in critically ill patients [44,45,46,47,48,49]. In a previous study, a low LCR, or in other words, a high CRP-to-lymphocyte ratio, was an effective prognostic marker in patients with cirrhosis [50]. Despite emerging evidence on the usefulness of the LCR, its utility in patients with LDLT has been limited. In the present study, the LCR independently predicted high postoperative EASE scores. Additionally, incorporating the LCR significantly improved the accuracy of the predictive model, suggesting that LCR could be a valuable preoperative risk factor for identifying patients at higher risk. LCR was significantly associated with inflammatory parameters such as CRP, white blood cell count, and albumin. Therefore, the association between the LCR and a high EASE score might reflect exacerbated systemic inflammation.
Our findings align with those of previous studies that identified operative time, intraoperative CRRT, and donor age as significant predictors of graft failure after LT. Lee et al. suggested that the duration from incision to the anhepatic phase was linked to graft survival [51]. Patients requiring CRRT are more likely to develop acute liver failure [52]. Moreover, donor age was significantly associated with an increased risk of graft failure [53]. According to multivariable analysis, preoperative anemia is associated with a higher number of intraoperative blood transfusions and postoperative complications, as previously reported [54]. The intraoperative calcium requirement is also related to the amount of blood transfused [55], and as a hemodynamic variable, the intraoperative heart rate is associated with negative outcomes after major surgery [56]. Although most variables are not adjustable, selection of younger donors when feasible may help improve patient outcomes.
This study has some limitations. First, although the LCR reflects systemic inflammation, further studies are required to understand the pathophysiological mechanisms linking the LCR to high EASE scores. Second, differences between the conditions of living and deceased donor liver transplantations might have affected the predictive value of a high EASE score for EAF. Third, as a retrospective study, we were unable to control for all potential confounders. Fourth, we used a p-value threshold of 0.1, instead of 0.05, to select clinically relevant variables to be fitted in multivariate analysis. Although including relevant variables up to a p-value of 0.1 is common in previous medical literature [57], this less stringent threshold could be considered a limitation to our study. Finally, although clinical factors associated with high EASE scores were accounted for in the multivariable analysis, the potential for selection bias cannot be entirely ruled out; thus, the results should be interpreted with caution.
5. Conclusions
Our findings suggest that a high EASE score, i.e., groups 4 and 5 of the recently developed EASE score for LT, was more useful for predicting EAF and overall mortality than was EAD. Moreover, preoperative LCR was a significant predictor of a high EASE score post-LDLT, along with operative time, preoperative hematocrit, intraoperative CRRT, amount of calcium infusion, mean heart rate, and donor age. Consequently, using the readily available LCR might help to estimate the risk of a high EASE score and to evaluate the overall status of patients. Factors such as BMI, operative time, intraoperative CRRT, and MBP were also significantly associated with EAF. Risk factors for a high EASE score and EAF, including the LCR, should be identified early, and these factors should be closely monitored. Due to the presence of multiple confounders and limitations in the study design, further prospective studies are required to validate the utility of the EASE score in clinical practice, particularly in patients undergoing LDLT.
Author Contributions
Conceptualization: J.P.; data curation: J.P., C.S.P., M.S.C., and H.J.C.; formal analysis: J.P. and S.H.H.; investigation: J.P. and H.J.C.; methodology: J.P.; supervision: S.H.H.; visualization: J.P.; writing—original draft: J.P.; writing—review and editing: J.P. and S.H.H. All authors have read and agreed to the published version of the manuscript.
Funding
This research received no external funding.
Institutional Review Board Statement
The study received approval from the Institutional Review Board of St. Mary’s Hospital, Seoul (C21RISI0576; September 17, 2021), and was conducted in accordance with the principles of the Declaration of Helsinki.
Informed Consent Statement
The requirement for informed consent was waived because of the retrospective design of the study.
Data Availability Statement
The data presented in this study are available on reasonable request.
Acknowledgments
The authors wish to acknowledge the financial support of the Catholic Medical Center Research Foundation made in the program year of 2023.
Conflicts of Interest
The authors declare no conflicts of interest.
References
- Feng, S. Living donor liver transplantation in high Model for End-Stage Liver Disease score patients. Liver Transpl. 2017, 23, S9–S21. [Google Scholar] [CrossRef] [PubMed]
- Agopian, V.G.; Markovic, D.; Klintmalm, G.B.; Saracino, G.; Chapman, W.C.; Vachharajani, N.; Florman, S.S.; Tabrizian, P.; Haydel, B.; Nasralla, D.; et al. Multicenter validation of the liver graft assessment following transplantation (L-GrAFT) score for assessment of early allograft dysfunction. J. Hepatol. 2021, 74, 881–892. [Google Scholar] [CrossRef] [PubMed]
- Agopian, V.G.; Harlander-Locke, M.P.; Markovic, D.; Dumronggittigule, W.; Xia, V.; Kaldas, F.M.; Zarrinpar, A.; Yersiz, H.; Farmer, D.G.; Hiatt, J.R.; et al. Evaluation of Early Allograft Function Using the Liver Graft Assessment Following Transplantation Risk Score Model. JAMA Surg. 2018, 153, 436–444. [Google Scholar] [CrossRef] [PubMed]
- Olthoff, K.M.; Kulik, L.; Samstein, B.; Kaminski, M.; Abecassis, M.; Emond, J.; Shaked, A.; Christie, J.D. Validation of a current definition of early allograft dysfunction in liver transplant recipients and analysis of risk factors. Liver Transpl. 2010, 16, 943–949. [Google Scholar] [CrossRef]
- Chen, S.; Wang, T.; Luo, T.; He, S.; Huang, C.; Jia, Z.; Zhan, L.; Wang, D.; Zhu, X.; Guo, Z.; et al. Prediction of Graft Survival Post-liver Transplantation by L-GrAFT Risk Score Model, EASE Score, MEAF Scoring, and EAD. Front. Surg. 2021, 8, 753056. [Google Scholar] [CrossRef]
- Avolio, A.W.; Lai, Q.; Cillo, U.; Romagnoli, R.; De Simone, P. L-GrAFT and EASE scores in liver transplantation: Need for reciprocal external validation and comparison with other scores. J. Hepatol. 2021, 75, 729–731. [Google Scholar] [CrossRef]
- Rocha, N.P.; Fortes, R.C. Total lymphocyte count and serum albumin as predictors of nutritional risk in surgical patients. Arq. Bras. Cir. Dig. 2015, 28, 193–196. [Google Scholar] [CrossRef]
- Zhang, H.; Sun, Q.; Mao, W.; Fan, J.; Ye, B. Neutrophil-to-Lymphocyte Ratio Predicts Early Mortality in Patients with HBV-Related Decompensated Cirrhosis. Gastroenterol. Res. Pract. 2016, 2016, 4394650. [Google Scholar] [CrossRef]
- Cervoni, J.P.; Thevenot, T.; Weil, D.; Muel, E.; Barbot, O.; Sheppard, F.; Monnet, E.; Di Martino, V. C-reactive protein predicts short-term mortality in patients with cirrhosis. J. Hepatol. 2012, 56, 1299–1304. [Google Scholar] [CrossRef]
- Zhang, J.N.; Gao, Y.; Wang, X.T.; Li, N.N.; Du, X.; Tang, Y.J.; Lai, Q.Q.; Chen, P.F.; Yue, C.S.; Wu, J.H.; et al. Lymphocyte-C-reactive protein ratio can differentiate disease severity of COVID-19 patients and serve as an assistant screening tool for hospital and ICU admission. Front. Immunol. 2022, 13, 957407. [Google Scholar] [CrossRef]
- Liu, Y.; Ye, T.; Chen, L.; Xu, B.; Wu, G.; Zong, G. Preoperative lymphocyte to C-reactive protein ratio: A new prognostic indicator of post-primary percutaneous coronary intervention in patients with ST-segment elevation myocardial infarction. Int. Immunopharmacol. 2023, 114, 109594. [Google Scholar] [CrossRef] [PubMed]
- Okugawa, Y.; Toiyama, Y.; Yamamoto, A.; Shigemori, T.; Ide, S.; Kitajima, T.; Fujikawa, H.; Yasuda, H.; Hiro, J.; Yoshiyama, S.; et al. Lymphocyte-C-reactive Protein Ratio as Promising New Marker for Predicting Surgical and Oncological Outcomes in Colorectal Cancer. Ann. Surg. 2020, 272, 342–351. [Google Scholar] [CrossRef] [PubMed]
- Practice guidelines for perioperative blood management: An updated report by the American Society of Anesthesiologists Task Force on Perioperative Blood Management*. Anesthesiology 2015, 122, 241–275. [CrossRef] [PubMed]
- Baek, S.D.; Jang, M.; Kim, W.; Yu, H.; Hwang, S.; Lee, S.G.; Hwang, G.S.; Lee, E.K.; Kim, S.M.; Chang, J.W. Benefits of Intraoperative Continuous Renal Replacement Therapy During Liver Transplantation in Patients with Renal Dysfunction. Transplant. Proc. 2017, 49, 1344–1350. [Google Scholar] [CrossRef]
- Douthitt, L.; Bezinover, D.; Uemura, T.; Kadry, Z.; Shah, R.A.; Ghahramani, N.; Janicki, P.K. Perioperative use of continuous renal replacement therapy for orthotopic liver transplantation. Transplant. Proc. 2012, 44, 1314–1317. [Google Scholar] [CrossRef]
- Avolio, A.W.; Franco, A.; Schlegel, A.; Lai, Q.; Meli, S.; Burra, P.; Patrono, D.; Ravaioli, M.; Bassi, D.; Ferla, F.; et al. Development and Validation of a Comprehensive Model to Estimate Early Allograft Failure Among Patients Requiring Early Liver Retransplant. JAMA Surg. 2020, 155, e204095. [Google Scholar] [CrossRef]
- Pomposelli, J.J.; Goodrich, N.P.; Emond, J.C.; Humar, A.; Baker, T.B.; Grant, D.R.; Fisher, R.A.; Roberts, J.P.; Olthoff, K.M.; Gillespie, B.W.; et al. Patterns of Early Allograft Dysfunction in Adult Live Donor Liver Transplantation: The A2ALL Experience. Transplantation 2016, 100, 1490–1499. [Google Scholar] [CrossRef]
- Horoldt, B.S.; Burattin, M.; Gunson, B.K.; Bramhall, S.R.; Nightingale, P.; Hubscher, S.G.; Neuberger, J.M. Does the Banff rejection activity index predict outcome in patients with early acute cellular rejection following liver transplantation? Liver Transpl. 2006, 12, 1144–1151. [Google Scholar] [CrossRef]
- Nicolau-Raducu, R.; Cohen, A.J.; Bokhari, A.; Bohorquez, H.; Bruce, D.; Carmody, I.; Bugeaud, E.; Seal, J.; Sonnier, D.; Nossaman, B.; et al. Predictive model and risk factors associated with a revised definition of early allograft dysfunction in liver transplant recipients. Clin. Transplant. 2017, 31, e13097. [Google Scholar] [CrossRef]
- Wadei, H.M.; Lee, D.D.; Croome, K.P.; Mai, M.L.; Golan, E.; Brotman, R.; Keaveny, A.P.; Taner, C.B. Early Allograft Dysfunction After Liver Transplantation Is Associated With Short- and Long-Term Kidney Function Impairment. Am. J. Transplant. 2016, 16, 850–859. [Google Scholar] [CrossRef]
- Lee, D.D.; Croome, K.P.; Shalev, J.A.; Musto, K.R.; Sharma, M.; Keaveny, A.P.; Taner, C.B. Early allograft dysfunction after liver transplantation: An intermediate outcome measure for targeted improvements. Ann. Hepatol. 2016, 15, 53–60. [Google Scholar] [CrossRef] [PubMed]
- Zou, Z.; Xu, D.; Li, B.; Xin, S.; Zhang, Z.; Huang, L.; Fu, J.; Yang, Y.; Jin, L.; Zhao, J.M.; et al. Compartmentalization and its implication for peripheral immunologically-competent cells to the liver in patients with HBV-related acute-on-chronic liver failure. Hepatol. Res. 2009, 39, 1198–1207. [Google Scholar] [CrossRef] [PubMed]
- Berres, M.L.; Schnyder, B.; Yagmur, E.; Inglis, B.; Stanzel, S.; Tischendorf, J.J.; Koch, A.; Winograd, R.; Trautwein, C.; Wasmuth, H.E. Longitudinal monocyte human leukocyte antigen-DR expression is a prognostic marker in critically ill patients with decompensated liver cirrhosis. Liver Int. 2009, 29, 536–543. [Google Scholar] [CrossRef]
- Juvela, S.; Kuhmonen, J.; Siironen, J. C-reactive protein as predictor for poor outcome after aneurysmal subarachnoid haemorrhage. Acta Neurochir. 2012, 154, 397–404. [Google Scholar] [CrossRef]
- Al-Subaie, N.; Reynolds, T.; Myers, A.; Sunderland, R.; Rhodes, A.; Grounds, R.M.; Hall, G.M. C-reactive protein as a predictor of outcome after discharge from the intensive care: A prospective observational study. Br. J. Anaesth 2010, 105, 318–325. [Google Scholar] [CrossRef]
- Silvestre, J.; Povoa, P.; Coelho, L.; Almeida, E.; Moreira, P.; Fernandes, A.; Mealha, R.; Sabino, H. Is C-reactive protein a good prognostic marker in septic patients? Intensive Care Med. 2009, 35, 909–913. [Google Scholar] [CrossRef]
- Ho, K.M.; Lee, K.Y.; Dobb, G.J.; Webb, S.A. C-reactive protein concentration as a predictor of in-hospital mortality after ICU discharge: A prospective cohort study. Intensive Care Med. 2008, 34, 481–487. [Google Scholar] [CrossRef]
- Villacorta, H.; Masetto, A.C.; Mesquita, E.T. C-reactive protein: An inflammatory marker with prognostic value in patients with decompensated heart failure. Arq. Bras. Cardiol. 2007, 88, 585–589. [Google Scholar] [CrossRef]
- Ho, K.M.; Dobb, G.J.; Lee, K.Y.; Towler, S.C.; Webb, S.A. C-reactive protein concentration as a predictor of intensive care unit readmission: A nested case-control study. J. Crit. Care 2006, 21, 259–265. [Google Scholar] [CrossRef]
- Povoa, P.; Almeida, E.; Moreira, P.; Fernandes, A.; Mealha, R.; Aragao, A.; Sabino, H. C-reactive protein as an indicator of sepsis. Intensive Care Med. 1998, 24, 1052–1056. [Google Scholar] [CrossRef]
- Sheldon, J.; Riches, P.; Gooding, R.; Soni, N.; Hobbs, J.R. C-reactive protein and its cytokine mediators in intensive-care patients. Clin. Chem. 1993, 39, 147–150. [Google Scholar] [CrossRef] [PubMed]
- Sproston, N.R.; Ashworth, J.J. Role of C-Reactive Protein at Sites of Inflammation and Infection. Front. Immunol. 2018, 9, 754. [Google Scholar] [CrossRef] [PubMed]
- Cousin, F.; Ortega-Deballon, P.; Bourredjem, A.; Doussot, A.; Giaccaglia, V.; Fournel, I. Diagnostic Accuracy of Procalcitonin and C-reactive Protein for the Early Diagnosis of Intra-abdominal Infection After Elective Colorectal Surgery: A Meta-analysis. Ann. Surg. 2016, 264, 252–256. [Google Scholar] [CrossRef] [PubMed]
- Wu, M.T.; He, S.Y.; Chen, S.L.; Li, L.F.; He, Z.Q.; Zhu, Y.Y.; He, X.; Chen, H. Clinical and prognostic implications of pretreatment albumin to C-reactive protein ratio in patients with hepatocellular carcinoma. BMC Cancer 2019, 19, 538. [Google Scholar] [CrossRef]
- Zhu, S.; Waili, Y.; Qi, X.; Chen, Y.; Lou, Y.; Chen, B. Serum C-reactive protein predicts early mortality in hospitalized patients with HBV-related decompensated cirrhosis. Medicine 2017, 96, e5988. [Google Scholar] [CrossRef]
- Huang, S.S.; Xie, D.M.; Cai, Y.J.; Wu, J.M.; Chen, R.C.; Wang, X.D.; Song, M.; Zheng, M.H.; Wang, Y.Q.; Lin, Z.; et al. C-reactive protein-to-albumin ratio is a predictor of hepatitis B virus related decompensated cirrhosis: Time-dependent receiver operating characteristics and decision curve analysis. Eur. J. Gastroenterol. Hepatol. 2017, 29, 472–480. [Google Scholar] [CrossRef]
- Kwon, J.H.; Jang, J.W.; Kim, Y.W.; Lee, S.W.; Nam, S.W.; Jaegal, D.; Lee, S.; Bae, S.H. The usefulness of C-reactive protein and neutrophil-to-lymphocyte ratio for predicting the outcome in hospitalized patients with liver cirrhosis. BMC Gastroenterol. 2015, 15, 146. [Google Scholar] [CrossRef]
- Chen, W.; Wang, J.B.; Abnet, C.C.; Dawsey, S.M.; Fan, J.H.; Yin, L.Y.; Yin, J.; Taylor, P.R.; Qiao, Y.L.; Freedman, N.D. Association between C-reactive protein, incident liver cancer, and chronic liver disease mortality in the Linxian Nutrition Intervention Trials: A nested case-control study. Cancer Epidemiol. Biomarkers Prev. 2015, 24, 386–392. [Google Scholar] [CrossRef]
- Vanbiervliet, G.; Le Breton, F.; Rosenthal-Allieri, M.A.; Gelsi, E.; Marine-Barjoan, E.; Anty, R.; Piche, T.; Benzaken, S.; Saint-Paul, M.C.; Huet, P.M.; et al. Serum C-reactive protein: A non-invasive marker of alcoholic hepatitis. Scand. J. Gastroenterol. 2006, 41, 1473–1479. [Google Scholar] [CrossRef]
- Di Martino, V.; Coutris, C.; Cervoni, J.P.; Dritsas, S.; Weil, D.; Richou, C.; Vanlemmens, C.; Thevenot, T. Prognostic value of C-reactive protein levels in patients with cirrhosis. Liver Transpl. 2015, 21, 753–760. [Google Scholar] [CrossRef]
- Heikkila, K.; Ebrahim, S.; Rumley, A.; Lowe, G.; Lawlor, D.A. Associations of circulating C-reactive protein and interleukin-6 with survival in women with and without cancer: Findings from the British Women’s Heart and Health Study. Cancer Epidemiol. Biomarkers Prev. 2007, 16, 1155–1159. [Google Scholar] [CrossRef] [PubMed][Green Version]
- Albillos, A.; de la Hera, A.; Gonzalez, M.; Moya, J.L.; Calleja, J.L.; Monserrat, J.; Ruiz-del-Arbol, L.; Alvarez-Mon, M. Increased lipopolysaccharide binding protein in cirrhotic patients with marked immune and hemodynamic derangement. Hepatology 2003, 37, 208–217. [Google Scholar] [CrossRef] [PubMed]
- Rosenbloom, A.J.; Pinsky, M.R.; Bryant, J.L.; Shin, A.; Tran, T.; Whiteside, T. Leukocyte activation in the peripheral blood of patients with cirrhosis of the liver and SIRS. Correlation with serum interleukin-6 levels and organ dysfunction. JAMA 1995, 274, 58–65. [Google Scholar] [CrossRef] [PubMed]
- Liu, A.; Hammond, R.; Chan, K.; Chukwuenweniwe, C.; Johnson, R.; Khair, D.; Duck, E.; Olubodun, O.; Barwick, K.; Banya, W.; et al. Comparison of Lymphocyte-CRP Ratio to Conventional Inflammatory Markers for Predicting Clinical Outcomes in COVID-19. J. Pers. Med. 2023, 13, 909. [Google Scholar] [CrossRef]
- Ullah, W.; Basyal, B.; Tariq, S.; Almas, T.; Saeed, R.; Roomi, S.; Haq, S.; Madara, J.; Boigon, M.; Haas, D.C.; et al. Lymphocyte-to-C-Reactive Protein Ratio: A Novel Predictor of Adverse Outcomes in COVID-19. J. Clin. Med. Res. 2020, 12, 415–422. [Google Scholar] [CrossRef]
- Okugawa, Y.; Toiyama, Y.; Yamamoto, A.; Shigemori, T.; Ichikawa, T.; Yin, C.; Suzuki, A.; Fujikawa, H.; Yasuda, H.; Hiro, J.; et al. Lymphocyte-to-C-reactive protein ratio and score are clinically feasible nutrition-inflammation markers of outcome in patients with gastric cancer. Clin. Nutr. 2020, 39, 1209–1217. [Google Scholar] [CrossRef]
- Nakamura, Y.; Shida, D.; Boku, N.; Yoshida, T.; Tanabe, T.; Takamizawa, Y.; Takashima, A.; Kanemitsu, Y. Lymphocyte-to-C-Reactive Protein Ratio Is the Most Sensitive Inflammation-Based Prognostic Score in Patients With Unresectable Metastatic Colorectal Cancer. Dis. Colon Rectum. 2021, 64, 1331–1341. [Google Scholar] [CrossRef]
- Liu, X.Y.; Zhang, X.; Zhang, Q.; Ruan, G.T.; Xie, H.L.; Liu, T.; Song, M.M.; Ge, Y.Z.; Deng, L.; Shi, H.P. Lymphocyte-C-reactive protein ratio with calf circumference could better predict survival of patients with non-metastatic cancer. Sci. Rep. 2023, 13, 7217. [Google Scholar]
- Li, X.; Wei, Y.; Xu, Z.; Li, T.; Dong, G.; Liu, X.; Zhu, Z.; Yang, J.; Yang, J. Lymphocyte-to-C-Reactive Protein Ratio as an Early Sepsis Biomarker for Neonates with Suspected Sepsis. Mediators Inflamm. 2023, 2023, 9077787. [Google Scholar] [CrossRef]
- Ye, B.; Ding, Q.; He, X.; Liu, X.; Shen, J. High C-Reactive Protein-to-Lymphocyte Ratio Is Predictive of Unfavorable Prognosis in HBV-Associated Decompensated Cirrhosis. Lab. Med. 2022, 53, e149–e153. [Google Scholar] [CrossRef]
- Lee, D.D.; Li, J.; Wang, G.; Croome, K.P.; Burns, J.M.; Perry, D.K.; Nguyen, J.H.; Hopp, W.J.; Taner, C.B. Looking inward: The impact of operative time on graft survival after liver transplantation. Surgery 2017, 162, 937–949. [Google Scholar] [CrossRef] [PubMed]
- Blanchette, E.; Pahlavan, S.; Yoeli, D.; Brigham, D.; Sater, A.; Wachs, M.; Bock, M.; Adams, M. Successful use of intra-operative continuous renal replacement therapy in pediatric liver transplant recipients: Single center case series. Pediatr. Transplant. 2022, 26, e14377. [Google Scholar] [CrossRef] [PubMed]
- Pratschke, S.; Bender, A.; Boesch, F.; Andrassy, J.; van Rosmalen, M.; Samuel, U.; Rogiers, X.; Meiser, B.; Kuchenhoff, H.; Driesslein, D.; et al. Association between donor age and risk of graft failure after liver transplantation: An analysis of the Eurotransplant database. Transpl. Int. 2019, 32, 270–279. [Google Scholar] [CrossRef] [PubMed]
- Lichtenegger, P.; Schiefer, J.; Graf, A.; Berlakovich, G.; Faybik, P.; Baron, D.M.; Baron-Stefaniak, J. The association of pre-operative anaemia with survival after orthotopic liver transplantation. Anaesthesia 2020, 75, 472–478. [Google Scholar] [CrossRef]
- Dorantes, R.P.; Boettcher, B.T.; Woehlck, H.J. Calcium Chloride Requirement and Postreperfusion Rebound During Massive Transfusion in Liver Transplantation. J. Cardiothorac. Vasc. Anesth. 2022, 36, 2400–2405. [Google Scholar] [CrossRef]
- Reich, D.L.; Bennett-Guerrero, E.; Bodian, C.A.; Hossain, S.; Winfree, W.; Krol, M. Intraoperative tachycardia and hypertension are independently associated with adverse outcome in noncardiac surgery of long duration. Anesth. Analg. 2002, 95, 273–277. [Google Scholar] [CrossRef]
- Bagley, S.C.; White, H.; Golomb, B.A. Logistic regression in the medical literature: Standards for use and reporting, with particular attention to one medical domain. J. Clin. Epidemiol. 2001, 54, 979–985. [Google Scholar] [CrossRef]
Disclaimer/Publisher’s Note: The statements, opinions and data contained in all publications are solely those of the individual author(s) and contributor(s) and not of MDPI and/or the editor(s). MDPI and/or the editor(s) disclaim responsibility for any injury to people or property resulting from any ideas, methods, instructions or products referred to in the content. |
© 2024 by the authors. Licensee MDPI, Basel, Switzerland. This article is an open access article distributed under the terms and conditions of the Creative Commons Attribution (CC BY) license (https://creativecommons.org/licenses/by/4.0/).