
Predictive Accuracy of Intraocular Lens Formulas Calculated by Biometers with Multiple Refractive Indices According to Axial Length


Abstract
1. Introduction
2. Materials and Methods
2.1. Subjects
2.2. Surgical Technique
2.3. Patient Evaluation
2.4. Statistical Analysis
3. Results
4. Discussion
Author Contributions
Funding
Institutional Review Board Statement
Informed Consent Statement
Data Availability Statement
Conflicts of Interest
Abbreviations
| ACD | anterior chamber depth |
| AL | axial length |
| BUII | Barrett Universal II |
| D | diopter |
| ELP | effective lens position |
| IOL | intraocular lens |
| PCI | partial coherence interferometry |
| IRB | institutional review board |
| RPE | retinal pigment epithelium |
| SS-OCT | swept-source optical coherence tomography |
| BTAL | Barrett True AL |
References
- Kane, J.X.; Van Heerden, A.; Atik, A.; Petsoglou, C. Intraocular lens power formula accuracy: Comparison of 7 formulas. J. Cataract. Refract. Surg. 2016, 42, 1490–1500. [Google Scholar] [CrossRef] [PubMed]
- Cooke, D.L.; Cooke, T.L. Comparison of 9 intraocular lens power calculation formulas. J. Cataract. Refract. Surg. 2016, 42, 1157–1164. [Google Scholar] [CrossRef]
- Melles, R.B.; Holladay, J.T.; Chang, W.J. Accuracy of Intraocular Lens Calculation Formulas. Ophthalmology 2018, 125, 169–178. [Google Scholar] [CrossRef]
- Olsen, T. Sources of error in intraocular lens power calculation. J. Cataract. Refract. Surg. 1992, 18, 125–129. [Google Scholar] [CrossRef]
- Yang, C.M.; Lim, D.H.; Kim, H.J.; Chung, T.Y. Comparison of two swept-source optical coherence tomography biometers and a partial coherence interferometer. PLoS ONE 2019, 14, e0223114. [Google Scholar] [CrossRef]
- Lee, H.K.; Kim, M.K. Comparison of a new swept-source optical biometer with a partial coherence interferometry. BMC Ophthalmol. 2018, 18, 269. [Google Scholar] [CrossRef] [PubMed]
- Shammas, H.J.; Taroni, L.; Pellegrini, M.; Shammas, M.C.M.; Jivrajka, R.V.M. Accuracy of newer intraocular lens power formulas in short and long eyes using sum-of-segments biometry. J. Cataract. Refract. Surg. 2022, 48, 1113–1120. [Google Scholar] [CrossRef] [PubMed]
- Wang, L.; Cao, D.; Weikert, M.P.; Koch, D.D. Calculation of Axial Length Using a Single Group Refractive Index versus Using Different Refractive Indices for Each Ocular Segment: Theoretical Study and Refractive Outcomes. Ophthalmology 2019, 126, 663–670. [Google Scholar] [CrossRef]
- Cooke, D.L.; Cooke, T.L. Approximating sum-of-segments axial length from a traditional optical low-coherence reflectometry measurement. J. Cataract. Refract. Surg. 2019, 45, 351–354. [Google Scholar] [CrossRef]
- Norrby, S. Sources of error in intraocular lens power calculation. J. Cataract. Refract. Surg. 2008, 34, 368–376. [Google Scholar] [CrossRef]
- Haigis, W. IOL power calculations. Ophthalmology 2010, 117, 400–401, author reply 401. [Google Scholar] [CrossRef] [PubMed]
- Haigis, W. The Haigis formula. In Intraocular Lens Power Calculations; Shammas, H.J., Ed.; Slack: Thorofare, NJ, USA, 2004; pp. 41–57. [Google Scholar]
- Barrett, G.D. Intraocular lens calculation formulas for new intraocular lens implants. J. Cataract. Refract. Surg. 1987, 13, 389–396. [Google Scholar] [CrossRef] [PubMed]
- Barrett, G.D. An improved universal theoretical formula for intraocular lens power prediction. J. Cataract. Refract. Surg. 1993, 19, 713–720. [Google Scholar] [CrossRef]
- Bernardes, J.; Raimundo, M.; Lobo, C.; Murta, J.N. A Comparison of Intraocular Lens Power Calculation Formulas in High Myopia. J. Refract. Surg. 2021, 37, 207–211. [Google Scholar] [CrossRef]
- Olsen, T. Calculation of intraocular lens power: A review. Acta Ophthalmol. Scand. 2007, 85, 472–485. [Google Scholar] [CrossRef] [PubMed]
- Zhang, Y.; Liang, X.Y.; Liu, S.; Lee, J.W.Y.; Bhaskar, S.; Lam, D.S.C. Accuracy of Intraocular Lens Power Calculation Formulas for Highly Myopic Eyes. J. Ophthalmol. 2016, 2016, 1917268. [Google Scholar] [CrossRef]
- Savini, G.; Hoffer, K.J.; Carballo, L.; Taroni, L.; Schiano-Lomoriello, D. Comparison of different methods to calculate the axial length measured by optical biometry. J. Cataract. Refract. Surg. 2022, 48, 685–689. [Google Scholar] [CrossRef]
- Cummings, A.B.; Naughton, S.; Coen, A.M.; Brennan, E.; E Kelly, G. Comparative Analysis of Swept-Source Optical Coherence Tomography and Partial Coherence Interferometry Biometers in the Prediction of Cataract Surgery Refractive Outcomes. Clin. Ophthalmol. 2020, 14, 4209–4220. [Google Scholar] [CrossRef]
- Tu, R.; Yu, J.; Savini, G.; Ye, J.; Ning, R.; Xiong, J.; Chen, S.; Huang, J. Agreement Between Two Optical Biometers Based on Large Coherence Length SS-OCT and Scheimpflug Imaging/Partial Coherence Interferometry. J. Refract. Surg. 2020, 36, 459–465. [Google Scholar] [CrossRef]
- Omoto, M.K.; Torii, H.; Masui, S.; Ayaki, M.; Tsubota, K.; Negishi, K. Ocular biometry and refractive outcomes using two swept-source optical coherence tomography-based biometers with segmental or equivalent refractive indices. Sci. Rep. 2019, 9, 6557. [Google Scholar] [CrossRef]
- Liu, J.; Wang, L.; Chai, F.; Han, Y.; Qian, S.; Koch, D.D.; Weikert, M.P. Comparison of intraocular lens power calculation formulas in Chinese eyes with axial myopia. J. Cataract. Refract. Surg. 2019, 45, 725–731. [Google Scholar] [CrossRef] [PubMed]
- Cheng, H.; Wang, L.; Kane, J.X.; Li, J.; Liu, L.; Wu, M. Accuracy of Artificial Intelligence Formulas and Axial Length Adjustments for Highly Myopic Eyes. Am. J. Ophthalmol. 2021, 223, 100–107. [Google Scholar] [CrossRef] [PubMed]
- Savini, G.; Hoffer, K.J.; Balducci, N.; Barboni, P.; Schiano-Lomoriello, D. Comparison of formula accuracy for intraocular lens power calculation based on measurements by a swept-source optical coherence tomography optical biometer. J. Cataract. Refract. Surg. 2020, 46, 27–33. [Google Scholar]
- Voytsekhivskyy, O.V.; Hoffer, K.J.; Tutchenko, L.; Cooke, D.L.; Savini, G. Accuracy of 24 IOL Power Calculation Methods. J. Refract. Surg. 2023, 39, 249–256. [Google Scholar] [CrossRef]
- Shammas, H.J.; Shammas, M.C.; Jivrajka, R.V.; Cooke, D.L.; Potvin, R. Effects on IOL Power Calculation and Expected Clinical Outcomes of Axial Length Measurements Based on Multiple vs Single Refractive Indices. Clin. Ophthalmol. 2020, 14, 1511–1519. [Google Scholar] [CrossRef]
- Kato, Y.; Ayaki, M.; Tamaoki, A.; Tanaka, Y.C.; Ichikawa, K.; Ichikawa, K. Accuracy of new intraocular lens power calculation formula for short and long eyes using segmental refractive indices. J. Cataract. Refract. Surg. 2022, 50, 810–815. [Google Scholar] [CrossRef]
- Carmona-Gonzalez, D.; Castillo-Gomez, A.; Palomino-Bautista, C.; Romero-Domínguez, M.; Gutiérrez-Moreno, M. Comparison of the accuracy of 11 intraocular lens power calculation formulas. Eur. J. Ophthalmol. 2021, 31, 2370–2376. [Google Scholar] [CrossRef] [PubMed]
- Maroun, A.; El Shami, M.; Hoyek, S.; Antoun, J. Comparison of the accuracy of nine intraocular lens power calculation formulas using partial coherence interferometry. J. Fr. Ophtalmol. 2023, 46, 341–347. [Google Scholar] [CrossRef]
- Chang, P.; Qian, S.; Wang, Y.; Li, S.; Yang, F.; Hu, Y.; Liu, Z.; Zhao, Y.-E. Accuracy of new-generation intraocular lens calculation formulas in eyes with variations in predicted refraction. Graefes Arch. Clin. Exp. Ophthalmol. 2023, 261, 127–135. [Google Scholar] [CrossRef]
- Yoon, J.H.; Whang, W.J. Comparison of Accuracy of Six Modern Intraocular Lens Power Calculation Formulas. Korean J. Ophthalmol. 2023, 37, 380–386. [Google Scholar] [CrossRef]
- Miao, A.; Lin, P.; Ren, S.; Xu, J.; Yang, F.; Qian, D.; Lu, Y.; Zheng, T. Influence of Ocular Biometry Parameters on the Predictive Accuracy of IOL Power Formulas in Patients with High Myopia. Ophthalmol. Ther. 2024, 13, 435–448. [Google Scholar] [CrossRef] [PubMed]
- Mo, E.; Chen, Z.; Feng, K.; Yang, F.; Li, J.; Zhao, Y.-E. Accuracy of Seven Modern Online IOL Formulas in Eyes With Axial Lengths Longer Than 30 mm. J. Refract. Surg. 2023, 39, 705–710. [Google Scholar] [CrossRef] [PubMed]
- Omoto, M.; Sugawara, K.; Torii, H.; Yotsukura, E.; Masui, S.; Shigeno, Y.; Nishi, Y.; Negishi, K. Investigating the Prediction Accuracy of Recently Updated Intraocular Lens Power Formulas with Artificial Intelligence for High Myopia. J. Clin. Med. 2022, 11, 4848. [Google Scholar] [CrossRef] [PubMed]
- Darcy, K.; Gunn, D.; Tavassoli, S.; Sparrow, J.; Kane, J.X. Assessment of the accuracy of new and updated intraocular lens power calculation formulas in 10 930 eyes from the UK National Health Service. J. Cataract. Refract. Surg. 2020, 46, 2–7. [Google Scholar]
- Savini, G.; Di Maita, M.; Hoffer, K.J.; Næser, K.; Schiano-Lomoriello, D.; Vagge, A.; Di Cello, L.; E Traverso, C. Comparison of 13 formulas for IOL power calculation with measurements from partial coherence interferometry. Br. J. Ophthalmol. 2021, 105, 484–489. [Google Scholar] [CrossRef]

| Normal AL (Group 1) | Long AL (Group 2) | p Value * | |
|---|---|---|---|
| Eyes (number) | 162 | 29 | |
| Age (years) | 71.23 ± 8.87 | 62.14 ± 12.28 | 0.309 |
| Laterality (right–left) | 79:83 | 13:16 | 0.696 † |
| Female [number (%)] | 70 (43.2%) | 14 (48.3%) | 0.125 † |
| AL (mm) | 23.60 ± 0.80 | 27.72 ± 1.37 | <0.001 |
| ACD (mm) | 3.19 ± 0.37 | 3.62 ± 0.40 | 0.331 |
| Flat K (D) | 43.57 ± 1.43 | 43.46 ± 1.38 | 0.906 |
| Steep K (D) | 44.45 ± 1.46 | 44.46 ± 1.44 | 0.934 |
| Mean K (D) | 44.01 ± 1.41 | 43.96 ± 1.38 | 0.907 |
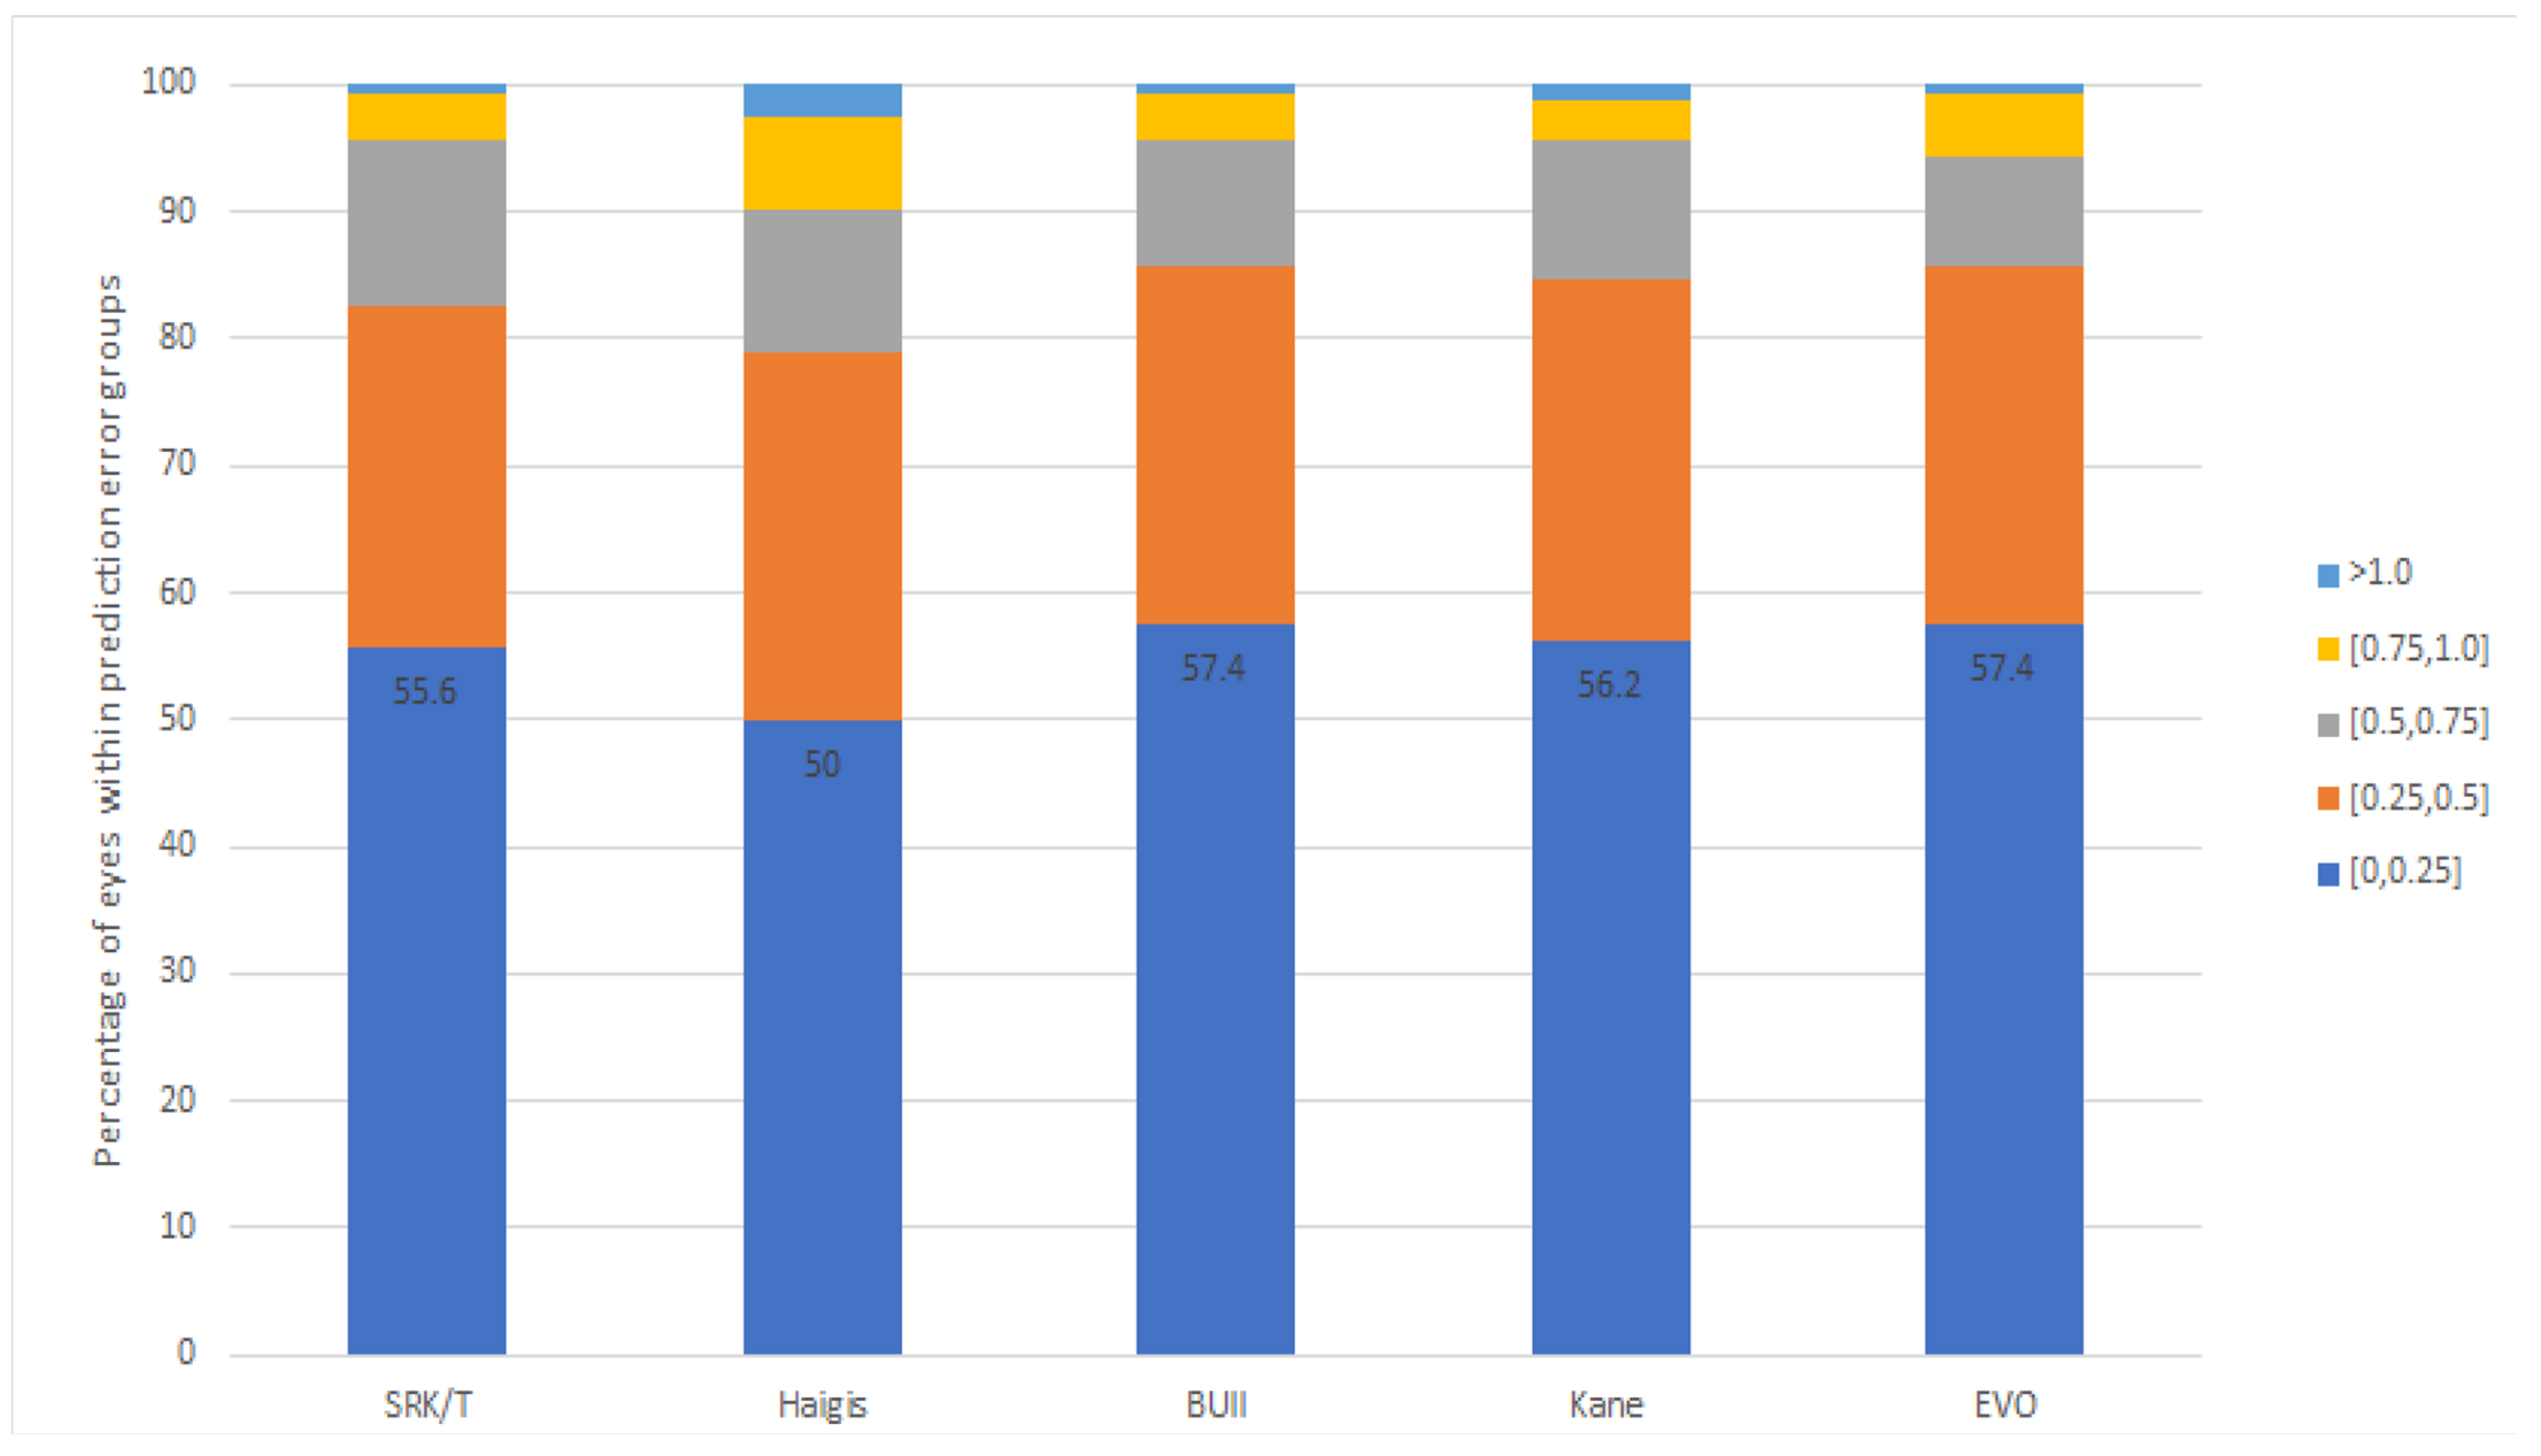
| PE (D) | p Value * | MAE | MedAE | IQR | PE ± 0.25 D | PE ± 0.5 D | PE ± 0.75 D | PE ± 1.0 D | Range (D) | |
|---|---|---|---|---|---|---|---|---|---|---|
| SRK-T | 0.00 ± 0.36 | 1.000 | 0.28 | 0.22 | 0.45 | 55.6% | 82.7% | 95.7% | 99.4% | −0.85 to 1.30 |
| Haigis | −0.00 ± 0.42 | 1.000 | 0.33 | 0.25 | 0.53 | 50.0% | 79.0% | 90.1% | 97.5% | −1.14 to 1.14 |
| Barrett | 0.00 ± 0.35 | 1.000 | 0.27 § | 0.20 | 0.42 | 57.4% | 85.8% | 95.7% | 99.4% | −0.98 to 1.18 |
| Kane | 0.00 ± 0.37 | 1.000 | 0.28 | 0.22 | 0.46 | 56.2% | 84.6% | 95.7% | 98.8% | −1.04 to 1.18 |
| EVO | 0.00 ± 0.35 | 1.000 | 0.26 ‡ | 0.19 | 0.40 | 57.4% | 85.8% | 94.4% | 99.4% | −0.92 to 1.21 |
| p value † | 0.573 | 0.043 | 0.231 | 0.068 | 0.106 | 0.575 |
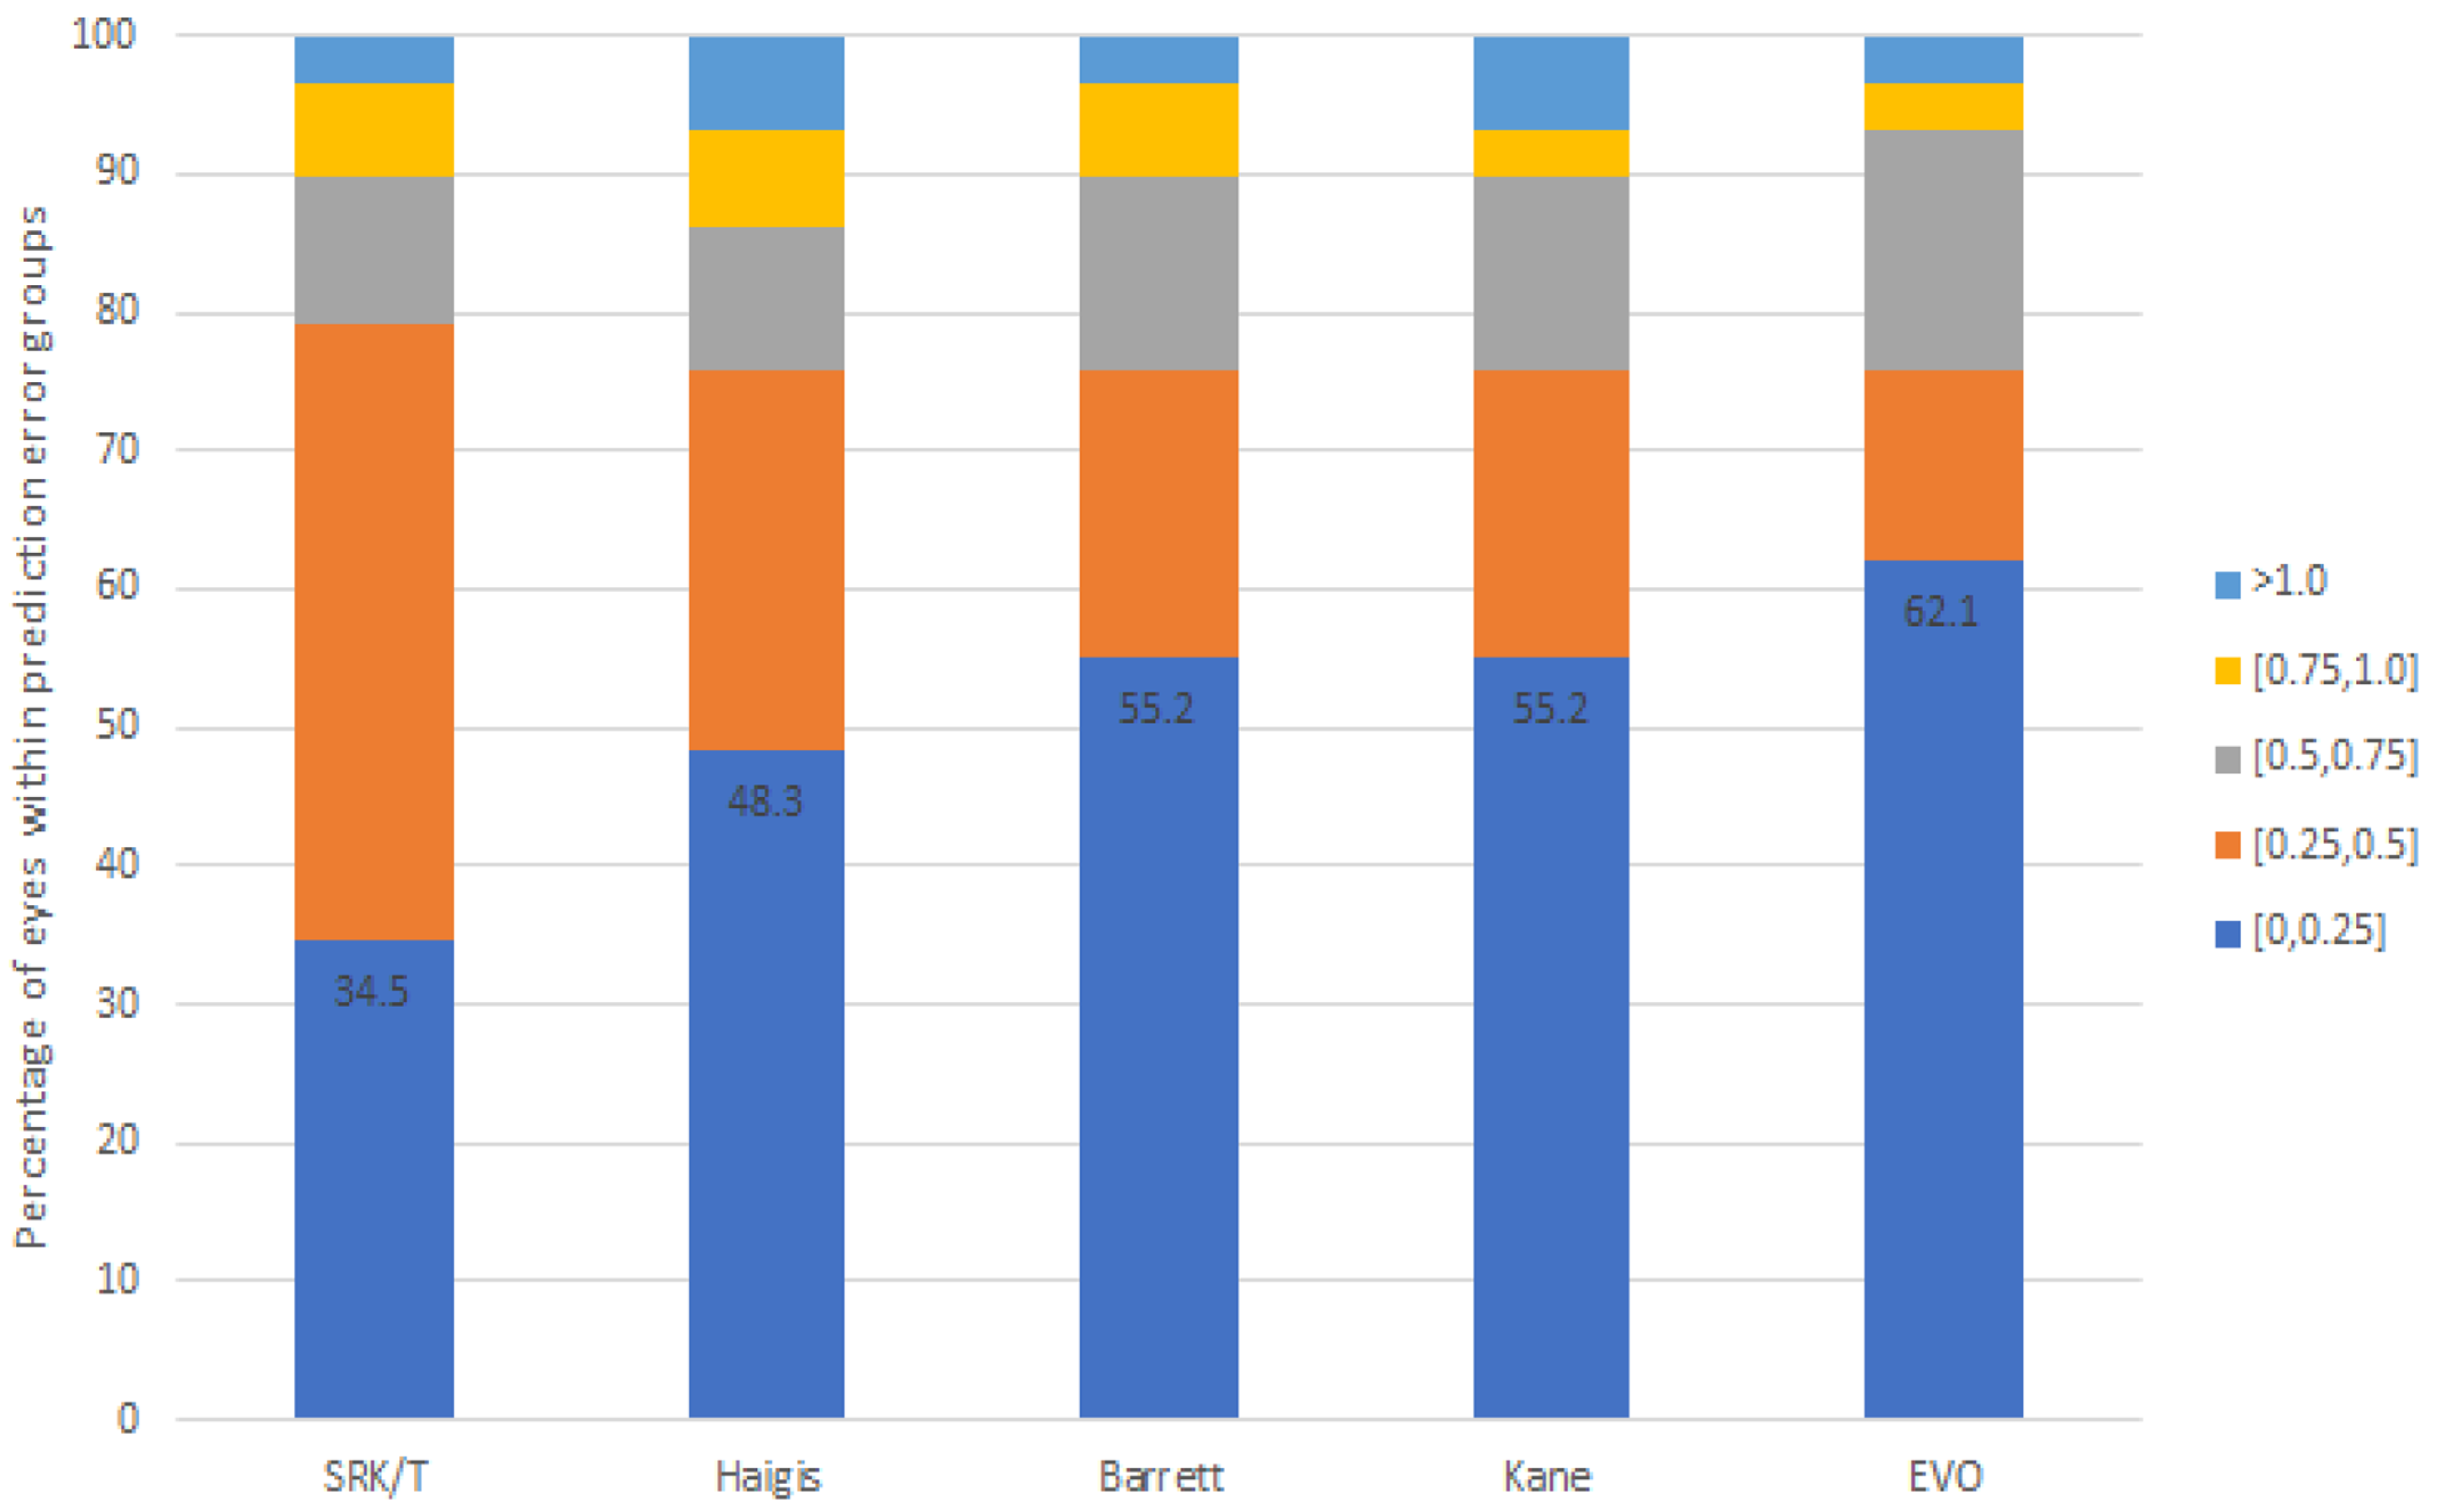
| PE (D) | p Value * | MAE | MedAE | IQR | PE ± 0.25 D | PE ± 0.5 D | PE ± 0.75 D | PE ± 1.0 D | Range (D) | |
|---|---|---|---|---|---|---|---|---|---|---|
| SRK-T | 0.00 ± 0.43 | 1.000 | 0.36 | 0.26 | 0.515 | 34.5% | 79.3% | 89.7% | 96.6% | −0.76 to 1.06 |
| Haigis | 0.00 ± 0.48 | 1.000 | 0.34 | 0.27 | 0.39 | 48.3% | 75.9% | 86.2% | 93.1% | −1.00 to 1.34 |
| Barrett | −0.00 ± 0.47 | 1.000 | 0.34 | 0.24 | 0.395 | 55.2% | 75.9% | 89.7% | 96.6% | −0.86 to 1.53 |
| Kane | −0.00 ± 0.48 | 1.000 | 0.35 | 0.21 | 0.385 | 55.2% | 75.9% | 89.7% | 93.1% | −0.83 to 1.28 |
| EVO | 0.00 ± 0.41 | 1.000 | 0.30 | 0.18 | 0.36 | 62.1% | 75.9% | 93.1% | 96.6% | −0.94 to 1.09 |
| p value † | 0.594 | 0.294 | 0.037 | 0.973 | 0.287 | 0.788 |
Disclaimer/Publisher’s Note: The statements, opinions and data contained in all publications are solely those of the individual author(s) and contributor(s) and not of MDPI and/or the editor(s). MDPI and/or the editor(s) disclaim responsibility for any injury to people or property resulting from any ideas, methods, instructions or products referred to in the content. |
© 2024 by the authors. Licensee MDPI, Basel, Switzerland. This article is an open access article distributed under the terms and conditions of the Creative Commons Attribution (CC BY) license (https://creativecommons.org/licenses/by/4.0/).
Share and Cite
Won, Y.K.; Yoo, Y.-S.; Yun, H.-j.; Chung, T.-Y.; Lim, D.H. Predictive Accuracy of Intraocular Lens Formulas Calculated by Biometers with Multiple Refractive Indices According to Axial Length. J. Clin. Med. 2024, 13, 6815. https://doi.org/10.3390/jcm13226815
Won YK, Yoo Y-S, Yun H-j, Chung T-Y, Lim DH. Predictive Accuracy of Intraocular Lens Formulas Calculated by Biometers with Multiple Refractive Indices According to Axial Length. Journal of Clinical Medicine. 2024; 13(22):6815. https://doi.org/10.3390/jcm13226815
Chicago/Turabian StyleWon, Yeo Kyoung, Young-Sik Yoo, Hee-jee Yun, Tae-Young Chung, and Dong Hui Lim. 2024. "Predictive Accuracy of Intraocular Lens Formulas Calculated by Biometers with Multiple Refractive Indices According to Axial Length" Journal of Clinical Medicine 13, no. 22: 6815. https://doi.org/10.3390/jcm13226815
APA StyleWon, Y. K., Yoo, Y.-S., Yun, H.-j., Chung, T.-Y., & Lim, D. H. (2024). Predictive Accuracy of Intraocular Lens Formulas Calculated by Biometers with Multiple Refractive Indices According to Axial Length. Journal of Clinical Medicine, 13(22), 6815. https://doi.org/10.3390/jcm13226815