
Do Neutrophil–Lymphocyte Ratio and Platelet–Lymphocyte Ratio Need to Be Stratified for Age and Comorbidities in COVID-19 Disease? A Subgroup Analysis of Two Distinct Cohorts over Disease Course
 ,
,
Abstract
1. Introduction
2. Materials and Methods
Statistical Analysis
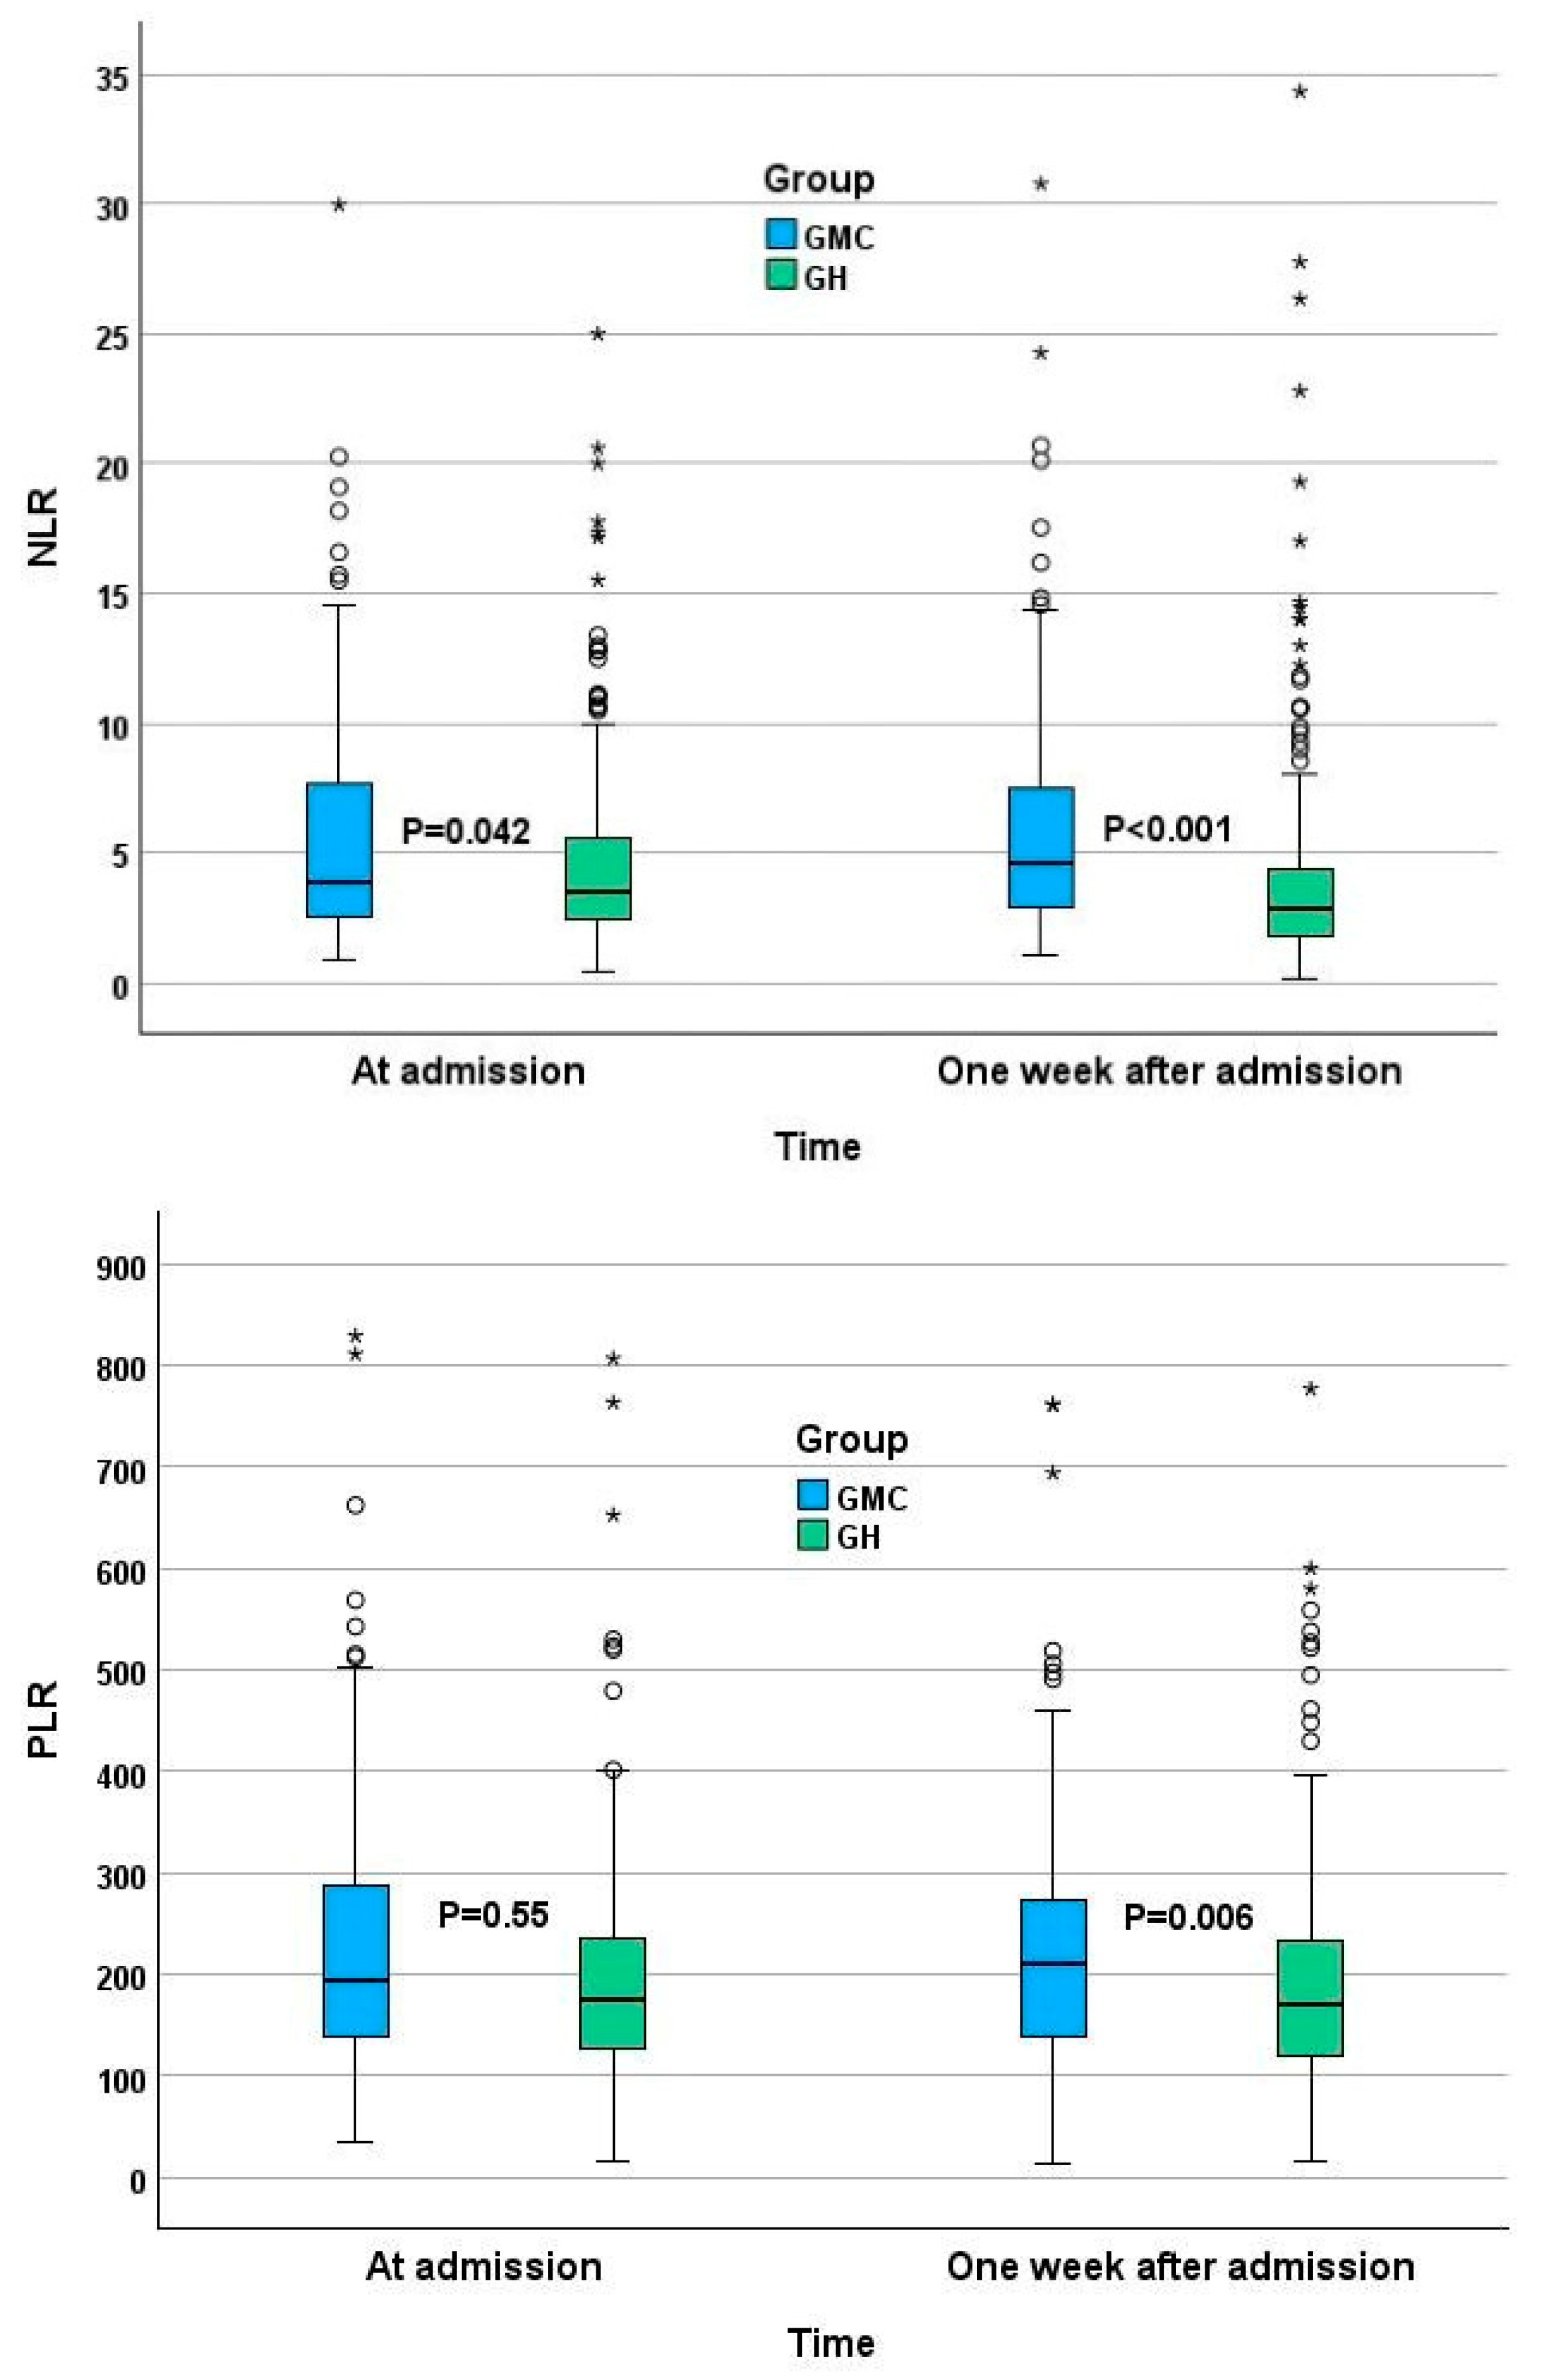
3. Results
4. Discussion
5. Conclusions
Author Contributions
Funding
Institutional Review Board Statement
Informed Consent Statement
Data Availability Statement
Conflicts of Interest
References
- COVID—Coronavirus Statistics—Worldometer. Available online: https://www.worldometers.info/coronavirus/ (accessed on 2 April 2023).
- COVID-19 Response: Living with COVID-19—GOV.UK. Available online: https://www.gov.uk/government/publications/covid-19-response-living-with-covid-19/covid-19-response-living-with-covid-19 (accessed on 3 March 2023).
- Ayalon, L.; Brammli-Greenberg, S.; Lauter, S.; Tsadok-Rosenbluth, S. COVID-19 and the Long-Term Care system in Israel. In LTCcovid International Living Report on COVID-19 and Long-Term Care; Comas-Herrera, A., Marczak, J., Byrd, W., Lorenz-Dant, K., Pharoah, D., Eds.; LTCcovid, Care Policy and Evaluation Centre, London School of Economics and Political Science: London, UK; Available online: https://ltccovid.org/country/=israel/ (accessed on 19 November 2022).
- Levy, Y.; Turjeman, A.; Cooper, L.; Kagansky, N.; Nagulevich, T.; Snir, T.; Hershkovitz, A.; Weiss, A.; Beloosesky, Y.; Weissman, Y.L. Frail Older Adults with Presymptomatic SARS-CoV-2 Infection: Clinical Course and Prognosis. Gerontology 2022, 68, 1393–1401. [Google Scholar] [CrossRef] [PubMed]
- Tsadok-Rosenbluth, S.; Hovav, B.; Horowitz, G.; Brammli-Greenberg, S. Centralized Management of the COVID-19 Pandemic in Long-Term Care Facilities in Israel. J. Long Term Care 2021, 92–99. [Google Scholar] [CrossRef]
- Margraf, A.; Lowell, C.A.; Zarbock, A. Neutrophils in acute inflammation: Current concepts and translational implications. Blood 2022, 139, 2130–2144. [Google Scholar] [CrossRef] [PubMed]
- Rokkam, V.R.; Killeen, R.B.; Kotagiri, R. Secondary Thrombocytosis. In StatPearls; StatPearls Publishing: St. Petersburg, FL, USA, 2023. [Google Scholar]
- Riff, R.; Cohen, Y.; Eini-Rider, H.; Naamani, O.; Mazar, J.; Haviv, Y.S.; Chaimovitz, C.; Douvdevani, A. Systemic inflammatory response syndrome–related lymphopenia is associated with adenosine A1 receptor dysfunction. J. Leukoc. Biol. 2017, 102, 95–103. [Google Scholar] [CrossRef] [PubMed]
- Li, J.; Zhang, K.; Zhang, Y.; Gu, Z.; Huang, C. Neutrophils in COVID-19: Recent insights and advances. Virol. J. 2023, 20, 169. [Google Scholar] [CrossRef]
- Asik, Z. The Role of the NLR and PLR in Urinary Tract Infection. Clin. Lab. 2021, 67, 2292–2297. [Google Scholar] [CrossRef] [PubMed]
- Liang, P.; Yu, F. Value of CRP, PCT, and NLR in Prediction of Severity and Prognosis of Patients with Bloodstream Infections and Sepsis. Front. Surg. 2022, 9, 857218. [Google Scholar] [CrossRef]
- Huang, Z.; Fu, Z.; Huang, W.; Huang, K. Prognostic value of neutrophil-to-lymphocyte ratio in sepsis: A meta-analysis. Am. J. Emerg. Med. 2020, 38, 641–647. [Google Scholar] [CrossRef]
- Mikami, T.D.; Funayama, A.D.; Niimi, K.D.; Haga, K.D.; Kawaharada, M.D.; Nakamura, A.D.; Katagiri, W.D.; Kobayashi, T.D. Prognostic value of preoperative systemic inflammatory response as a prognostic indicator in patients with early-stage oral squamous cell carcinoma. Medicine 2022, 101, e30855. [Google Scholar] [CrossRef]
- Feng, J.-F.; Huang, Y.; Chen, Q.-X. Preoperative platelet lymphocyte ratio (PLR) is superior to neutrophil lymphocyte ratio (NLR) as a predictive factor in patients with esophageal squamous cell carcinoma. World J. Surg. Oncol. 2014, 12, 58. [Google Scholar] [CrossRef]
- Hirahara, T.; Arigami, T.; Yanagita, S.; Matsushita, D.; Uchikado, Y.; Kita, Y.; Mori, S.; Sasaki, K.; Omoto, I.; Kurahara, H.; et al. Combined neutrophil-lymphocyte ratio and platelet-lymphocyte ratio predicts chemotherapy response and prognosis in patients with advanced gastric cancer. BMC Cancer 2019, 19, 672. [Google Scholar] [CrossRef] [PubMed]
- Liu, J.; Ao, W.; Zhou, J.; Luo, P.; Wang, Q.; Xiang, D. The correlation between PLR-NLR and prognosis in acute myocardial infarction. Am. J. Transl. Res. 2021, 13, 4892–4899. [Google Scholar] [PubMed]
- Liao, Y.; Liu, C.; He, W.; Wang, D. Study on the Value of Blood Biomarkers NLR and PLR in the Clinical Diagnosis of Influenza a Virus Infection in Children. Clin. Lab. 2021, 67, 2540–2547. [Google Scholar] [CrossRef] [PubMed]
- Kosidło, J.W.; Wolszczak-Biedrzycka, B.; Matowicka-Karna, J.; Dymicka-Piekarska, V.; Dorf, J. Clinical Significance and Diagnostic Utility of NLR, LMR, PLR and SII in the Course of COVID-19: A Literature Review. J. Inflamm. Res. 2023, 16, 539–562. [Google Scholar] [CrossRef] [PubMed]
- El Hussini, M.S.; El Hussieny, M.S.; Heiba, A.; Elsayed, E.S.M.; Hassan, N.E.; El-Masry, S.A. Correlation Between Neutrophil-Lymphocyte Ratio, Platelets-Lymphocyte Ratio, and High-Resolution CT in Patients with COVID-19. EMJ Radiol. 2023. [Google Scholar] [CrossRef]
- Yang, A.-P.; Liu, J.-P.; Tao, W.-Q.; Li, H.-M. The diagnostic and predictive role of NLR, d-NLR and PLR in COVID-19 patients. Int. Immunopharmacol. 2020, 84, 106504. [Google Scholar] [CrossRef]
- Levy, Y.; Derazne, E.; Shilovsky, A.; Kagansky, D.; Derkath, A.; Chepelev, V.; Mazurez, E.; Stambler, I.; Kagansky, N. Neutrophil to lymphocyte ratio and platelet to lymphocyte ratio, are they markers of COVID-19 severity or old age and frailty? A comparison of two distinct cohorts. Front. Med. 2023, 10, 1222692. [Google Scholar] [CrossRef]
- Parthasarathi, A.; Padukudru, S.; Arunachal, S.; Basavaraj, C.K.; Krishna, M.T.; Ganguly, K.; Upadhyay, S.; Anand, M.P. The Role of Neutrophil-to-Lymphocyte Ratio in Risk Stratification and Prognostication of COVID-19: A Systematic Review and Meta-Analysis. Vaccines 2022, 10, 1233. [Google Scholar] [CrossRef]
- Wang, J.; Zhang, F.; Jiang, F.; Hu, L.; Chen, J.; Wang, Y. Distribution and reference interval establishment of neutral-to-lymphocyte ratio (NLR), lymphocyte-to-monocyte ratio (LMR), and platelet-to-lymphocyte ratio (PLR) in Chinese healthy adults. J. Clin. Lab. Anal. 2021, 35, e23935. [Google Scholar] [CrossRef]
- Chen, L.; Yu, J.; He, W.; Chen, L.; Yuan, G.; Dong, F.; Chen, W.; Cao, Y.; Yang, J.; Cai, L.; et al. Risk factors for death in 1859 subjects with COVID-19. Leukemia 2020, 34, 2173–2183. [Google Scholar] [CrossRef]
- Chinnadurai, R.; Ogedengbe, O.; Agarwal, P.; Money-Coomes, S.; Abdurrahman, A.Z.; Mohammed, S.; Kalra, P.A.; Rothwell, N.; Pradhan, S. Older age and frailty are the chief predictors of mortality in COVID-19 patients admitted to an acute medical unit in a secondary care setting- a cohort study. BMC Geriatr. 2020, 20, 409. [Google Scholar] [CrossRef]
- Hewitt, J.; Carter, B.; Vilches-Moraga, A.; Quinn, T.J.; Braude, P.; Verduri, A.; Pearce, L.; Stechman, M.; Short, R.; Price, A.; et al. The effect of frailty on survival in patients with COVID-19 (COPE): A multicentre, European, observational cohort study. Lancet Public Health 2020, 5, e444–e451. [Google Scholar] [CrossRef] [PubMed]
- Giri, S.; Bal, S.; Godby, K.N.; Richman, J.; Olszewski, A.J.; Williams, G.R.; Costa, L.J.; Bhatia, S. Role of Neutrophil Lymphocyte Ratio [NLR] As a Biomarker of Frailty and Predictor of Survival Among Older Adults with Multiple Myeloma (MM). Blood 2020, 136 (Suppl. S1), 6. [Google Scholar] [CrossRef]
- Xu, W.; Liang, Y.; Lin, Z. Association Between Neutrophil–Lymphocyte Ratio and Frailty: The Chinese Longitudinal Healthy Longevity Survey. Front. Med. 2022, 8, 783077. [Google Scholar] [CrossRef] [PubMed]
- Nishijima, T.F.; Deal, A.M.; Williams, G.R.; Guerard, E.J.; Nyrop, K.A.; Muss, H.B. Frailty and inflammatory markers in older adults with cancer. Aging 2017, 9, 650–664. [Google Scholar] [CrossRef] [PubMed]
- Guan, L.; Liu, Q.; Yao, Y.; Wang, L.; Peng, Y.; Chen, S.; Zhou, L.; Zheng, X. Do neutrophil to lymphocyte ratio and platelet to lymphocyte ratio associate with frailty in elderly inpatient with comorbidity? Exp. Gerontol. 2022, 169, 111955. [Google Scholar] [CrossRef]
- McGovern, J.; Al-Azzawi, Y.; Kemp, O.; Moffitt, P.; Richards, C.; Dolan, R.D.; Laird, B.J.; McMillan, D.C.; Maguire, D. The relationship between frailty, nutritional status, co-morbidity, CT-body composition and systemic inflammation in patients with COVID-19. J. Transl. Med. 2022, 20, 98. [Google Scholar] [CrossRef]
- He, B.; Ma, Y.; Wang, C.; Jiang, M.; Geng, C.; Chang, X.; Ma, B.; Han, L. Prevalence and Risk Factors for Frailty Among Community-Dwelling Older People in China: A Systematic Review and Meta-Analysis. J. Nutr. Health Aging 2019, 23, 442–450. [Google Scholar] [CrossRef]
- Diez-Ruiz, A.; Bueno-Errandonea, A.; Nuñez-Barrio, J.; Sanchez-Martín, I.; Vrotsou, K.; Vergara, I. Factors associated with frailty in primary care: A prospective cohort study. BMC Geriatr. 2016, 16, 91. [Google Scholar] [CrossRef]

| GMC | GH | ||||
|---|---|---|---|---|---|
| N | Median (25th–75th) | N | Median (25th–75th) | p | |
| Age | 100 | 84.5 (78.0–91.0) | 287 | 52.0 (42.0–58.0) | <0.001 |
| BMI * | 37 | 24.1 (21.7–26.6) | 271 | 27.8 (24.7–31.6) | <0.001 |
| N | % | N | % | p | |
| Sex | 0.002 | ||||
| Male | 36 | 36.0 | 156 | 54.4 | |
| Female | 64 | 64.0 | 131 | 45.6 | |
| Residence | <0.001 | ||||
| Home | 51 | 51.5 | 267 | 93.0 | |
| Nursing Home | 48 | 48.5 | 20 | 7.0 | |
| Total number of diseases | <0.001 | ||||
| 0 | 0 | 0.0 | 98 | 34.1 | |
| 1 | 1 | 1.0 | 49 | 17.1 | |
| 2 | 2 | 2.0 | 58 | 20.2 | |
| 3 | 8 | 8.0 | 33 | 11.5 | |
| 4 | 9 | 9.0 | 25 | 8.7 | |
| ≥5 | 80 | 80.0 | 24 | 8.4 | |
| Heart failure | 25 | 25.0 | 10 | 3.5 | <0.001 |
| Chronic kidney disease | 23 | 23.0 | 11 | 3.8 | <0.001 |
| Dementia | 30 | 30.0 | 19 | 6.6 | <0.001 |
| Depression | 17 | 17.0 | 9 | 3.1 | <0.001 |
| Asthma–COPD | 9 | 9.0 | 24 | 8.4 | 0.837 |
| CVA | 21 | 21.0 | 2 | 0.7 | <0.001 |
| Diabetes mellitus | 44 | 44.0 | 69 | 24.0 | <0.001 |
| Anemia | 29 | 29.0 | 10 | 3.5 | <0.001 |
| Hypertension | 82 | 82.0 | 76 | 26.5 | <0.001 |
| Pressure Ulcers | 11 | 11.0 | 2 | 0.7 | <0.001 |
| Coronary Disease | 28 | 28.0 | 23 | 8.0 | <0.001 |
| PVD | 5 | 5.0 | 1 | 0.3 | 0.005 |
| Hyperlipidemia | 47 | 47.0 | 68 | 23.7 | <0.001 |
| Chronic Liver Disease | 6 | 6.0 | 7 | 2.4 | 0.107 |
| Hypothyroidism | 22 | 22.0 | 14 | 4.9 | <0.001 |
| Total number of medications | <0.001 | ||||
| 0 | 0 | 0.0 | 130 | 45.3 | |
| 1–3 | 5 | 5.0 | 73 | 25.4 | |
| 4–6 | 28 | 28.0 | 49 | 17.1 | |
| 6–9 | 67 | 67.0 | 35 | 12.2 | |
| Ace-Arb-inh | 42 | 42.0 | 53 | 18.5 | <0.001 |
| B-blockers | 52 | 52.0 | 39 | 13.6 | <0.001 |
| Insulin | 18 | 18.0 | 27 | 9.4 | 0.029 |
| Ca-blockers | 36 | 36.0 | 27 | 9.4 | <0.001 |
| Vitamin D | 33 | 33.0 | 11 | 3.8 | <0.001 |
| Antiplatelets | 31 | 31.0 | 42 | 14.6 | 0.001 |
| Levothyroxine | 19 | 19.0 | 12 | 4.2 | <0.001 |
| Anticoagulants | 43 | 43.0 | 15 | 5.2 | <0.001 |
| Antipsychotics | 35 | 35.0 | 21 | 7.3 | <0.001 |
| Antidepressants | 31 | 31.0 | 33 | 11.5 | <0.001 |
| Corticosteroids | 8 | 8.0 | 11 | 3.8 | 0.109 |
| GMC | GH | ||||
|---|---|---|---|---|---|
| N | % | N | % | p | |
| Anosmia | 0 | 0.0 | 13 | 4.5 | 0.025 |
| Diarrhea | 1 | 1.0 | 31 | 10.8 | 0.001 |
| Fatigue | 4 | 4.0 | 153 | 53.3 | <0.001 |
| Headache | 0 | 0.0 | 45 | 15.7 | <0.001 |
| Fever | 16 | 16.0 | 197 | 68.6 | <0.001 |
| Cough | 11 | 11.0 | 146 | 50.9 | <0.001 |
| Anxiety | 1 | 1.0 | 4 | 1.4 | 1.000 |
| Delirium | 2 | 2.0 | 1 | 0.3 | 0.165 |
| Dyspnea | 26 | 26.0 | 132 | 46.0 | 0.001 |
| Abdominal pain | 2 | 2.0 | 32 | 11.1 | 0.004 |
| Change of appetite | 2 | 2.0 | 48 | 16.7 | <0.001 |
| No symptoms | 62 | 62.0 | 6 | 2.1 | <0.001 |
| GMC Symptoms * | +/+ | +/− | −/+ | −/− | McNemar P |
|---|---|---|---|---|---|
| Anosmia | 0 | 0 | 0 | 100 | NA |
| Diarrhea | 0 | 1 | 2 | 97 | 1 |
| Fatigue | 1 | 3 | 1 | 95 | 0.625 |
| Headache | 0 | 0 | 0 | 100 | NA |
| Fever | 4 | 12 | 4 | 80 | 0.077 |
| Cough | 7 | 4 | 4 | 85 | 1 |
| Anxiety | 1 | 0 | 0 | 99 | 1 |
| Delirium | 1 | 1 | 0 | 98 | 1 |
| Dyspnea | 17 | 9 | 6 | 68 | 0.607 |
| Abdominal pain | 1 | 1 | 2 | 96 | 1 |
| Change of appetite | 2 | 0 | 0 | 98 | 1 |
| Any symptoms | 27 | 11 | 9 | 53 | 0.824 |
| GH Symptoms * | +/+ | +/− | −/+ | −/− | McNemar P |
| Anosmia | 0 | 13 | 1 | 273 | 0.002 |
| Diarrhea | 1 | 30 | 2 | 254 | <0.001 |
| Fatigue | 12 | 141 | 7 | 127 | <0.001 |
| Headache | 1 | 44 | 3 | 239 | <0.001 |
| Fever | 6 | 191 | 0 | 90 | <0.001 |
| Cough | 24 | 122 | 1 | 140 | <0.001 |
| Anxiety | 0 | 4 | 1 | 282 | 0.375 |
| Delirium | 0 | 1 | 0 | 286 | NA |
| Dyspnea | 15 | 117 | 6 | 149 | <0.001 |
| Abdominal pain | 1 | 31 | 1 | 254 | <0.001 |
| Change of appetite | 1 | 47 | 2 | 237 | <0.001 |
| Any symptoms | 89 | 192 | 1 | 5 | <0.001 |
| First Test | Changes from First to Second Test | ||||||||
|---|---|---|---|---|---|---|---|---|---|
| GMC | GH | M−W P | GMC | GH | M−W P | ||||
| N | Median (25th−75th) | N | Median (25th−75th) | Median (25th−75th) | Median (25th−75th) | ||||
| NLR | 100 | 3.86 (2.52–7.67) | 286 | 3.52 (2.44–5.56) | 0.042 | 0.20 (−1.70 to 2.09) | −0.08 (−1.85 to 0.02) | 0.006 | |
| PLR | 95 | 195 (139–302) | 285 | 175 (128–237) | 0.039 | −3.29 (−61.77 to 52.61) | 0 (−41.36 to 31.43) | 0.736 | |
| Hemoglobin | g/dL | 100 | 11.5 (10.3–13.4) | 286 | 13.4 (12.5–14.5) | <0.001 | −0.5 (−1.5 to 0.2) | 0 (−0.8 to 0.2) | 0.006 |
| WBC | 103/µL | 100 | 7.8(5.9–10.6) | 286 | 5.7 (4.20–7.40) | <0.001 | 0.8 (−2.1 to 2.5) | 0 (−0.6 to 1.4) | 0.730 |
| Monocytes% | % | 100 | 8.2 (5.9–10.1) | 284 | 8.2 (6.2–10.5) | 0.281 | −0.4 (−2.2 to 1.3) | 0 (−1.0 to 2.1) | 0.006 |
| Neutrophil TN | 103/µL | 100 | 5.7 (4.0–8.5) | 286 | 3.9 (2.7–5.3) | <0.001 | 0.5 (−1.4 to 2.4) | 0 (−0.8 to 0.7) | 0.147 |
| lymphocyte TN | 103/µL | 100 | 1.3 (0.9–1.7) | 287 | 1.0 (0.8–1.5) | 0.001 | 0.0 (−0.4 to 0.4) | 0.1 (0.0 to 0.6) | <0.001 |
| Platelets | 103/µL | 95 | 255 (187–334) | 285 | 184 (143–237) | <0.001 | 6 (−47 to 65) | 16 (0 to 120) | 0.001 |
| RDW | % | 100 | 14.5 (13.6–16.0) | 285 | 13.7 (13.1–14.5) | <0.001 | 0.2 (−0.3 to 0.7) | 0 (−0.1 to 0.2) | 0.070 |
| Creatinine | mg/dL | 99 | 1.0 (0.7–1.3) | 281 | 0.8 (0.6–09) | <0.001 | 0 (−0.15 to 0.14) | −0.05 (−0.1 to 0) | 0.003 |
| CRP | mg/L | 72 | 32 (17− 56) | 275 | 53 (21–112) | 0.005 | 0 (−16 to 35) | −3.62 (−61 to 0) | <0.001 |
| GMC | GH | ||||
|---|---|---|---|---|---|
| N | % | N | % | p | |
| NLR ≥ 2.15 | 83 | 83.0 | 229 | 79.8 | 0.558 |
| PLR ≥ 110 | 85 | 85.0 | 240 | 83.6 | 0.874 |
Disclaimer/Publisher’s Note: The statements, opinions and data contained in all publications are solely those of the individual author(s) and contributor(s) and not of MDPI and/or the editor(s). MDPI and/or the editor(s) disclaim responsibility for any injury to people or property resulting from any ideas, methods, instructions or products referred to in the content. |
© 2024 by the authors. Licensee MDPI, Basel, Switzerland. This article is an open access article distributed under the terms and conditions of the Creative Commons Attribution (CC BY) license (https://creativecommons.org/licenses/by/4.0/).
Share and Cite
Kagansky, N.; Levy, Y.; Awar, A.; Derazne, E.; Shilovsky, A.; Kagansky, D.; Chepelev, V.; Mazurez, E.; Stambler, I.; Levtzion-Korach, O. Do Neutrophil–Lymphocyte Ratio and Platelet–Lymphocyte Ratio Need to Be Stratified for Age and Comorbidities in COVID-19 Disease? A Subgroup Analysis of Two Distinct Cohorts over Disease Course. J. Clin. Med. 2024, 13, 605. https://doi.org/10.3390/jcm13020605
Kagansky N, Levy Y, Awar A, Derazne E, Shilovsky A, Kagansky D, Chepelev V, Mazurez E, Stambler I, Levtzion-Korach O. Do Neutrophil–Lymphocyte Ratio and Platelet–Lymphocyte Ratio Need to Be Stratified for Age and Comorbidities in COVID-19 Disease? A Subgroup Analysis of Two Distinct Cohorts over Disease Course. Journal of Clinical Medicine. 2024; 13(2):605. https://doi.org/10.3390/jcm13020605
Chicago/Turabian StyleKagansky, Nadya, Yochai Levy, Anas Awar, Estela Derazne, Alexander Shilovsky, Dana Kagansky, Victor Chepelev, Evelina Mazurez, Ilia Stambler, and Osnat Levtzion-Korach. 2024. "Do Neutrophil–Lymphocyte Ratio and Platelet–Lymphocyte Ratio Need to Be Stratified for Age and Comorbidities in COVID-19 Disease? A Subgroup Analysis of Two Distinct Cohorts over Disease Course" Journal of Clinical Medicine 13, no. 2: 605. https://doi.org/10.3390/jcm13020605
APA StyleKagansky, N., Levy, Y., Awar, A., Derazne, E., Shilovsky, A., Kagansky, D., Chepelev, V., Mazurez, E., Stambler, I., & Levtzion-Korach, O. (2024). Do Neutrophil–Lymphocyte Ratio and Platelet–Lymphocyte Ratio Need to Be Stratified for Age and Comorbidities in COVID-19 Disease? A Subgroup Analysis of Two Distinct Cohorts over Disease Course. Journal of Clinical Medicine, 13(2), 605. https://doi.org/10.3390/jcm13020605