Abstract
Background: Neutrophil-to-lymphocyte ratio (NLR), platelets-to-lymphocyte ratio (PLR) and C-reactive protein-to-albumin ratio (CAR) are believed to be potential inflammatory markers that are closely related to the prognosis and course of cardiovascular diseases. The main goal of this study was the evaluation of NLR, PLR and CAR as factors reflecting the clinical picture and the prognosis of elderly chronic heart failure (CHF) patients. Methods: In 150 elderly patients with newly diagnosed CHF, the NLR, PLR and CAR were correlated with cardiac, laboratory and nutritional parameters. Results: Systemic inflammatory ratios were correlated with selected patient’s parameters. CAR was associated with an unfavorable clinical picture of CHF—a reduced EF (p = 0.007), an elevated PASP (p = 0.014), an increased LVESD in both males and females (p = 0.032 and 0.024, respectively) and a decreased TAPSE (p = 0.023). CAR allowed us to distinguish between NYHA I–III and NYHA IV classes with AUC of 0.830. By analyzing the five-year mortality rate in patients with different CAR values, the greater death rate was recorded for patients with high CAR values—one-year death rate (40.3% vs. 17.2%) and five-year death rate (80% vs. 58.3%) (p = 0.002). Both NLR and PLR correlated only with selected parameters. Conclusion: An analysis of inflammatory markers, mainly CAR, allows the management of CHF, because its value can reflect the cardiac and nutritional status of patients with a prognostic value. NLR and PLR can serve as supplementary examinations for CAR evaluation.
1. Introduction
Chronic heart failure (CHF) is a complex disease that involves cardiac dysfunction frequently followed by systemic disorders and multiple organ failure [1,2]. CHF is one of the leading causes of death globally, mainly in elderly patients (aged over 65 years), and it is characterized by a negative impact on a patient’s quality of life and the reduced level of physical activity in daily life. According to the results of available meta-analyses, the estimated five-year survival rate in geriatric CHF individuals is less than 50% [3,4].
Systemic inflammation is considered as a key factor influencing CHF development. However, the connection between CHF and inflammatory response is complex and involves a relationship network between heart and different internal organs (the multiorgan hypothesis of CHF) [5]. The mechanism of inflammatory activation can be caused by hemodynamic stress (e.g., overload of the left heart ventricle), the coexistence of other systemic disorders (diabetes, obesity, and atherosclerosis), humoral activity, and imbalances in muscles and the gastrointestinal system [5,6]. As a result of inflammatory response due to the pro-inflammatory cytokines releases, such as tumor necrosis factor alpha (TNF-α) or interleukins (IL-1 and IL-6), released from different tissues, the systolic and diastolic dysfunction of cardiomyoctes and their atrophy and remodeling is caused [7,8].
Recent studies that have widely analyzed patients suffering from different systemic diseases have inferred that neutrophil-to-lymphocyte ratio (NLR), platelets-to-lymphocyte ratio (PLR) and C-reactive protein-to-albumin ratio (CAR) are potential inflammatory markers that are closely related to the prognosis of cardiovascular diseases [9,10]. They have been also proposed the cost-effective, easily obtainable and available markers of systemic inflammation [11,12]. The above-mentioned benefits of NLR, PLR and CAR encourage their evaluation in daily clinical practice. To the best of our knowledge, there is a lack of significant literature data on NLR, PLR and CAR in elderly CHF patients and even in other CHF patients. The main goal of the study was the evaluation of NLR, PLR and CAR as factors reflecting the clinical picture and the prognosis of elderly CHF patients.
2. Materials and Methods
A total of 150 elderly patients (85 men and 65 women; median age: 72 years; range: 65–94 years) with newly diagnosed CHF were retrospectively analyzed. All study participants were recruited for the research at the Clinic of Cardiology and Internal Medicine, 1st Military Hospital in Lublin, Poland, between 2013 and 2015. Criteria issued by the European Society of Cardiology were applied in order to diagnose CHF. It included an analysis of patients’ medical history, physical examination, laboratory testing and echocardiographic examination. The extent of the disease was assessed by the New York Heart Association (NYHA) functional classification (class I–IV, according to the disease severity). The parameters derived from echocardiography (with the use of Vivid™ T8 Ultra Edition, GE Healthcare, Chicago, IL, USA) that were analyzed are as follows: EF%—ejection fraction of the left ventricle; LVEDD and LVESD—left ventricular end-diastolic and end-systolic diameters; PASP—pulmonary artery systolic pressure; and TAPSE—tricuspid annular plane systolic excursion. Laboratory testing included the measurement of a number of circulating neutrophils, lymphocytes, and platelets as well as the concentration of serum albumin, NT-proBNP, hemoglobin and inflammatory markers: CRP, IL-6 and TNF-α. CAR was calculated by dividing the serum CRP concentration (mg/dL) by the serum albumin concentration (g/dL), NLR by dividing the absolute count for neutrophils (×109/L) by the absolute count for lymphocytes (×109/L), and PLR by dividing the absolute count for platelets (×109/L) by the absolute count for lymphocytes (×109/L). All laboratory parameters were analyzed during the routine examination of patients with the use of Roche Cobas 6000 (Basel, Switzerland), and Cormay Mythic 70 (Lublin, Poland). Inclusion and exclusion criteria were defined for study participants. Inclusion criteria were as follows: newly diagnosed CHF, age > 65 years, provided signed informed consent, and Polish ethnicity. Exclusion criteria were as follows: the presence of acute coronary syndrome, thyroid disorders (neither hypo- nor hyperthyroidism), implanted cardioverter defibrillator and coronary artery bypass grafting. The nutritional examination of the patients was conducted with the use of clinical questionnaires (Subjective Global Assessment (SGA) and Nutritional Risk Score (NRS-2002)) and the analysis of the body composition using bioimpedance analysis (BIA) that included the measurement of fat mass (FM) and fat-free mass (FFM). The ImpediMed bioimpedance analysis SFB7 BioImp v1.55 device (Pinkenba, QLD, Australia) was used to measure parameters reflecting the body composition. The study protocol was approved by the local ethics committee in Medical University in Lublin, Poland (no. of consent: KE-0254/64/2017). The baseline characteristic of studied CHF patients are presented in Table 1.

Table 1.
Baseline characteristics of CHF patients.
Statistical Analysis
MedCalc computer software (MedCalc, Ostend, Belgium), version 18.5, was used for statistical purposes. Differences in CAR, NLR and PLR values were compared between groups of patients according to the clinical, echocardiographic, laboratory and nutritional parameters using Mann–Whitney U test. The cut-off values of parameters were determined based on the literature data, clinical criteria or their median values. CAR, NLR and PLR values were presented as median scores with an interquartile range (IQR). Investigated ratios were correlated with different patient parameters with the use of Spearman’s rank correlation (Spearman’s rho). Receiver operating curve (ROC) analysis with the calculation of area under the ROC (AUC) was applied to assess CAR, NLR and PLR diagnostic values in order to distinguish between patients qualified to different NYHA classes. In order to select the predictors of an NYHA class, multiple regression analysis was carried out. Kaplan–Meier estimator (univariate) was used to analyze the independent prognostic values of CAR, NLR and PLR for patients’ overall survival (OS). Cox proportional-hazard analysis (multivariate) was applied to select factors affecting OS in the studied CHF patients. Statistically significant results of the used tests demonstrated p-values below 0.05 (p < 0.05).
3. Results
The median values of NLR, PLR and CAR in the studied group were as follows: 3.08 (2.19–4.44), 126.0 (90.1–162.1) and 1.76 (0.57–7.42), respectively. In Table 2, the median values of NLR, PLR and CAR were compared between patients with different clinical–demographic and echocardiographic parameters. The most significant results were recorded for CAR. Its value was higher in the following group of patients with NYHA III–IV (median: 4.74 vs. 1.03; p < 0.001), a reduced EF (median: 2.65 vs. 1.16; p = 0.007), an elevated PASP (2.96 vs. 1.13; p = 0.014), an increased LVESD in both males and females (p = 0.032 and 0.024, respectively) and a decreased TAPSE (median: 3.41 vs. 1.35; p = 0.023). Moreover, higher CAR values were associated with the presence of both dyspnea at rest (median: 3.61 vs. 1.13; p < 0.001) and cardiac arrhythmias (median: 2.87 vs. 1.13; p = 0.016). Regarding the higher NLR values, similar results were noticed for NYHA grade (median: 3.71 vs. 2.65; p = 0.002), PASP (median: 3.19 vs. 2.63; p = 0.016), TAPSE (median: 3.42 vs. 2.89; p = 0.040) and the occurrence of dyspnea at rest (median: 3.75 vs. 2.66; p < 0.001). As for elevated PLR, the significant results were achieved for age > 72 years (median: 138.9 vs. 107.9; p = 0.036), NYHA grade (median: 139.0 vs. 110.6; p = 0.042) and the presence of dyspnea at rest (median: 141.0 vs. 112.5; p = 0.028).
Table 2.
Differences in NLR, PLR and CAR values depending on patients’ clinical–demographic data and echocardiographic parameters.
Higher values of NLR and CAR were found in patients with the presence of elevated concentrations of serum inflammatory markers—CRP, IL-6, TNF-α, and NT-proBNP (all p < 0.05). Unlike both CAR and NLR, PLR was associated only with a higher serum CRP concentration (p = 0.046). Noticeably, both PLR (median: 146.6 vs. 110.6; p = 0.007) and CAR (median: 4.79 vs. 1.24; p = 0.002) were increased in patients with anemia. Investigating the relationship between studied markers and parameters reflecting nutritional status of the patients, we found their interdependencies. CAR and NLR were significantly higher in patients with hypoalbuminemia (p < 0.001 and p = 0.004, respectively) and individuals with a higher NRS-2002 score (both p < 0.001). Only CAR corresponded with SGA, and significantly higher CAR values were observed in PNS patients qualified as mildly (B) or severely malnourished (C) in contrast to those of well-nourished ones (A) (median: 3.57 vs. 0.96; p < 0.001). Regarding the body composition parameters, NLR was elevated in patients with lower FM (median: 3.59 vs. 2.67; p = 0.016), and PLR was elevated in patients with lower FFM (145.3 vs. 104.3; p = 0.011). Differences in NLR, PLR and CAR values depending on nutritional and laboratory parameters are presented in Table 3.
Table 3.
Differences in NLR, PLR and CAR values depending on patients’ nutritional status and the results of laboratory testing.
Then, NLR, PLR and CAR were correlated with the studied parameters. Figure 1A demonstrates the result of the correlation between NLR, PLR, CAR and echocardiographic and nutritional factors. The strongest positive correlation for CAR was observed with NYHA (rho = 0.413), and its strongest negative correlation was observed with EF% (rho = −0.263), whereas for NLR, its strongest positive correlation was observed with NRS (rho = 0.301), and its strongest negative correlation was observed with FM (rho = −0.224), respectively. PLR significantly correlated only between PASP (rho = 0.178) and FFM (rho = −0.246). Regarding the laboratory examination, despite the obvious correlation between CAR and both CRP and albumin, this parameter most positively correlated with IL-6 (rho = 0.556) and most negatively correlated with hemoglobin concentration (rho = −0.230). The strongest positive correlation for NLR was found with TNF-α (rho = 0.426), and its strongest negative correlation was found with albumin concentration (rho = −0.265). Noticeable positive and negative correlations for NLR were found with PLR and TNF-α (rho = 0.300) and hemoglobin concentration (rho = −0.345), respectively. Figure 1B demonstrates the result of correlation between the values of NLR, PLR, CAR and studied laboratory parameters.
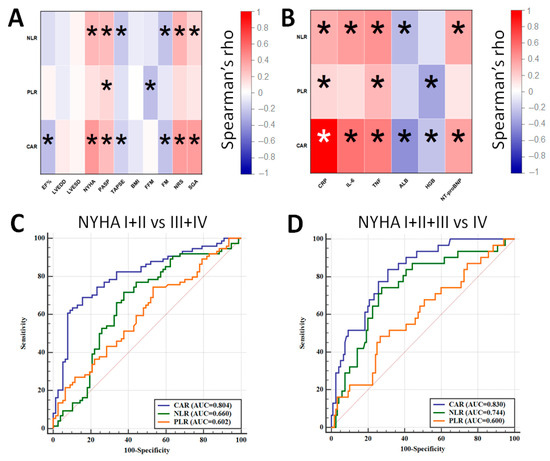
Figure 1.
Correlation between NLR, PLR, CAR and echocardiographic and nutritional parameters (A) and laboratory results (B). ROC curves demonstrating the diagnostic accuracy of NLR, PLR and CAR for distinguishing between NYHA I + II and NYHA III + IV patients (C) and between NYHA I–III and NYHA IV patients (D) (*—statistically significant results).
The next goal of the analysis was to assess the diagnostic accuracy of the studied parameters for distinguishing between patients qualified to NYHA I + II and NYHA III + IV classes as well as NYHA I–III and NYHA IV classes (Figure 1C,D). The best diagnostic accuracy was achieved for CAR as it allowed to distinguish between NYHA I + II and NYHA III + IV with 69.9% sensitivity and 84.6% specificity (AUC = 0.804; cut-off: 2.65) as well as between NYHA I–III and NYHA IV with a sensitivity of 83.9% and a specificity of 70.0% (AUC = 0.830; cut-off: 2.65). A combination of CAR with either NLR or NLR + PLR did not improve the diagnostic accuracy of the test.
Multiple regression model analysis selected the predictors of the higher NYHA classification in the studied group. Among the studied parameters, a low EF% (p < 0.001), the presence of dyspnea at rest (p < 0.001), a high CAR score (p = 0.029) and a high concentration of NT-proBNP (p = 0.031) were considered as significant predictors of higher NYHA classification—Table 4.
Table 4.
Significant predictors of the higher NYHA classification in the studied CHF patients—the result of multiple regression analysis.
Among the studied parameters, only CAR significantly affected patients’ survival. Applying median CAR value as the criterion distinguishing between its high and low value, we observed a significantly shorter overall survival (OS) time in individuals with a CAR value above the median score (median OS: 42 months vs. 16 months; HR = 1.87; p = 0.002—Figure 2A). By analyzing the five-year mortality rate in patients with different CAR values, the greater death rate was recorded for patients with high CAR values—one-year death rate (40.3% vs. 17.2%) and five-year death rate (80% vs. 58.3%) (p = 0.002)—Figure 2B. The more substantial differences in OS were observed between patients with CAR value > Q3 (CAR > 7.4) compared to Q1 or Q2 values (median OS: 41 months vs. 12 months; HR = 2.03; p = 0.001—Figure 2C). In this model, one-year death rate was 51% vs. 21%, and five-year death rate was 80% vs. 65%, respectively (p = 0.001). A combination of CAR with either NLR or PLR did not improve the prognostic value of CAR. The impact of NLR and PLR as well as their combination with CAR are demonstrated in Supplementary Figures S1 and S2.
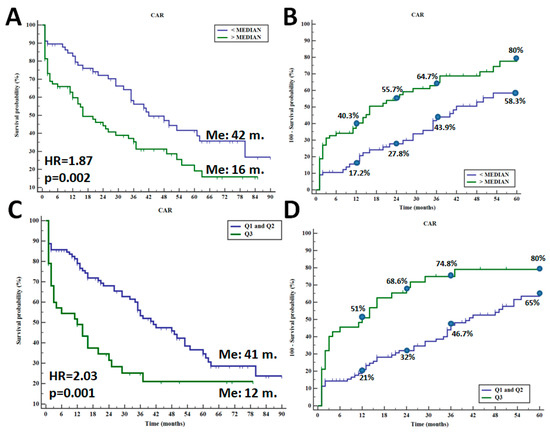
Figure 2.
Overall survival in CHF patients depending on median CAR value (A) and five-year death rate (B) as well as overall survival in CHF individuals with CAR value between Q1 + Q2 and Q3 (C) and five-year death rate (D).
All the studied factors including CAR, NLR, PLR, echocardiographic, clinical, laboratory and nutritional parameters were introduced into the Cox proportional-hazard model. As a result, the serum albumin concentration (HR = 1.61; p = 0.032), the CAR value (HR = 1.23; p = 0.040), patient’s age (HR = 1.10; p = 0.042) and EF% (HR = 1.10; p = 0.044) were selected as significant dependent factors affecting the survival in the studied group of CHF patients.
4. Discussion
For clinical purposes, cost-effective, easily obtainable and available markers of systemic inflammation are desirable in order to assess the level of inflammatory response and predict the course of the disease. To date, NLR, PLR and CAR were studied in different populations of patients, including in patients with chronic diseases, inflammatory-related diseases and cancer [13,14,15,16,17]. Most of the studies investigating these markers in cardiovascular diseases have focused on heart failure (HF) patients. However, its exact clinical utility for CHF patients is still unknown. It is also worth underlining that most of the available studies regarding cardiovascular diseases have focused on the prognostic value of the inflammatory markers. We have correlated their values with various factors reflecting patients’ clinical picture, such as echocardiographic and nutritional parameters.
Recently, Öztürk et al. found a higher NLR value in patients with a reduced LVEF compared to that of patients with preserved or mildly reduced LVEF (p = 0.002); however, their study demonstrated a poor diagnostic accuracy to distinguish between patients with different LVEF phenotypes (AUC < 0.60) [18]. Also, Durmus et al. investigated NLR and PLR in HF patients and observed the inverse correlation between NLR and LVEF (rho = −0.409), but not for PLR. ROC analysis demonstrated adequate accuracy for predicting the presence of HF with an AUC of 0.868, but PLR recorded an AUC of 0.689 [19]. In another study, the NLR and PLR were also found to be inversely correlated with LVEF, but only PLR served as a predictor for HF (AUC = 0.76) [20]. In our study, only CAR inversely correlated with LVEF (rho = −0.263), and its value was significantly higher in patients with reduced LVEF when compared to that of individuals with mildly or preserved LVEF (median CAR: 2.65 vs. 1.16; p = 0.007). Tamaki et al. found in patients suffering from acute decompensate HF, a relationship between both high NLR and PLR values and parameters reflecting a cardiac condition. Patients demonstrating high values of NLR and PLR had an increased PASP (p < 0.001), an increased NT-proBNP concentration (p < 0.001) and a decreased hemoglobin concentration (p < 0.001) in contrast to those of patients with other NLR and PLR values [21]. Our results are consistent with these findings, and we found higher values of CAR and NLR in patients with elevated PASP and increased NT-proBNP. Higher values of NLR and PLR were noticed in patients with anemia. Interestingly, we recorded significantly higher values of CAR, NLR and PLR in patients qualified to NYHA III-IV class (all p < 0.05). We have not found a relationship between the studied inflammatory markers and NYHA in the literature data so far. The best diagnostic accuracy to distinguish between patients with various NYHA classes was demonstrated by CAR—an AUC of 0.804 for NYHA I + II vs. III + IV and an AUC of 0.830 for NYHA I–III vs. IV. We also selected a lower EF% (p < 0.001), the presence of dyspnea at rest (p < 0.001), a high CAR score (p = 0.029) and the high concentration of NT-proBNP (p = 0.031) as significant predictors of higher NYHA classification. The higher CAR values were also noticed in patients with worse nutritional statuses (B and C according to the SGA and ≥3 according to the NRS-2002). Considering these results, it can be inferred that CAR can be a valuable marker for the selection of patients with poor clinical picture and severe symptoms of CHF. However, its clinical significance in HF and CHF is limited only to the investigation of its prognostic value.
A large data set derived from the study of Yang et al. indicated the role of high CAR as a risk factor of cardiovascular disease development, even better than CRP or albumin [22]. As for the prognostic value of CAR, recently, Sonsöz et al. investigated CAR in acute HF and noticed an increased mortality in the follow-up of the group of patients with high CAR values when compared with those of other patients (death rate: 36.7% vs. 12%; p < 0.001), and the HR was 1.69; p = 0.042 [23]. In another study that enrolled outpatients with HF, a high CAR value was selected as an unfavorable prognostic factor both by univariate and multivariate survival analysis (HR = 2.80 and HR = 2.13, respectively). In the group of survivors, 38% of HF patients had a CRP value over the median score, whereas in the non-survivor group, it was 95% (p < 0.001) [24]. In our research, we found the prognostic value only for CAR, but not for NLR or PLR. CHF patients with CAR values over the median score had worse prognosis than others (univariate median OS: 42 months vs. 16 months; HR = 1.87; p = 0.002; and multivariate HR = 1.23; p = 0.040). By analyzing the manner of CAR stratification, the five-year death rate was found to be 80% and 58.3%, respectively. Changing the manner stratification, patients with CAR value over the Q3 had five-year death rate of 80% vs. 65%, respectively (HR = 2.03). However, we did not achieve significant results for NLR or PLR, and the literature reports are not consistent; however, in most of them, both high NLR and PLR negatively affected HF patients’ survival. Lu et al. investigated the role of PLR in over 1200 HF patients and did not find a relationship between its value and either the mortality risk or the survival time of the patients. Regarding NLR, it demonstrated a prognostic value only when its value was at the highest quartile (HR = 1.59). Additionally, it demonstrated a rather low diagnostic accuracy for predicting death due to HF, with AUCs of 0.58 and 0.64, respectively [25]. A recent comprehensive review showed that PLR is not consistently an independent predictor for survival in HF, and this is probably related to the different cut-off values proposed by different authors [26].
5. Conclusions
The studied inflammatory markers, i.e., CAR, NLR and PLR, are easy to evaluate in clinical conditions, and they demonstrate utility for the evaluation of elderly CHF patients’ clinical condition. They correlate with the level of inflammatory markers, the NYHA class, and the selected cardiac and nutritional parameters. Among them, CAR seems to be most valuable due to its correlation with a large number of the studied parameters, its diagnostic accuracy for the NYHA class and its prognostic value. The obtained results underline the utility of inflammatory markers’ assessment in CHF patients. Our results are not free from limitations. We have evaluated selected inflammatory markers in a relatively small group of patients in a retrospective manner; thus, further studies should deal with these limitations.
Supplementary Materials
The following supporting information can be downloaded at: https://www.mdpi.com/article/10.3390/jcm13020433/s1. Figure S1: Overall survival in CHF patients depending on median NLR value (A) and NLR value within Q1 + Q2 and Q3 (B) as well as overall survival in CHF patients depending on median PLR value (C) and PLR value within Q1 + Q2 and Q3 (D). Figure S2: Overall survival in CHF patients depending on combination of: median CAR and NLR values (A), CAR and NLR values within Q1 + Q2 and Q3 (B) as well as overall survival in CHF patients depending on combination of median CAR, NLR and PLR values (C) and CAR, NLR and PLE values within Q1 + Q2 and Q3 (D).
Author Contributions
Conceptualization: T.P.; methodology and sampling: G.S. and A.S.-D.; data curation and statistics: T.P.; writing—original draft: T.P., G.S., A.S.-D. and T.M.-M.; writing—review and editing: T.P., G.S., A.S.-D. and T.M.-M.; funding acquisition: T.P. All authors have read and agreed to the published version of the manuscript.
Funding
Funding for this study was provided by Medical University of Lublin—Grant GI/5.
Institutional Review Board Statement
The study protocol was approved by the local ethics committee of Medical University in Lublin, Poland (no. of consent: KE-0254/64/2017).
Informed Consent Statement
Informed consent was obtained from all subjects involved in the study.
Data Availability Statement
The data presented in this study are available on request from the corresponding author. The data are not publicly available due to privacy and ethical reasons.
Conflicts of Interest
The authors declare no conflicts of interest.
References
- Edelman, F.; Knosalla, C.; Mörike, K.; Muth, C.; Prien, P.; Störk, S. Chronic Heart Failure. Dtsch. Ärzteblatt Int. 2018, 115, 124–130. [Google Scholar] [CrossRef] [PubMed]
- Shrestha, J.; Done, S. An overview of chronic heart failure. Nurs. Stand. 2023, 38, 43–49. [Google Scholar] [CrossRef]
- Jones, N.R.; Roalfe, A.K.; Adoki, I.; Hobbs, F.D.; Taylor, C.J. Survival of patients with chronic heart failure in the community: A systematic review and meta-analysis. Eur. J. Heart Fail. 2019, 21, 1306–1325. [Google Scholar] [CrossRef]
- Clark, A.L. Origin of symptoms in chronic heart failure. Heart 2006, 92, 12–16. [Google Scholar] [CrossRef] [PubMed]
- Murphy, S.P.; Kakkar, R.; McCarthy, C.P.; Januzzi, J. Inflammation in Heart Failure: JACC State-of-the-Art Review. Am. Coll. Cardiol. 2020, 75, 1324–1340. [Google Scholar] [CrossRef]
- Dick, S.A.; Epelman, S. Chronic Heart Failure and Inflammation: What Do We Really Know? Circ. Res. 2016, 119, 159–176. [Google Scholar] [CrossRef] [PubMed]
- Riehle, C.; Bauersachs, J. Key inflammatory mechanisms underlying heart failure. Herz 2019, 44, 96–106. [Google Scholar] [CrossRef]
- Halade, G.V.; Lee, D.H. Inflammation and resolution signaling in cardiac repair and heart failure. eBioMedicine 2022, 79, 103992. [Google Scholar] [CrossRef]
- Serra, R.; Ielapi, N.; Licastro, N.; Provenzano, M.; Andreucci, M.; Bracale, U.M.; Jiritano, F.; de Franciscis, S.; Mastroroberto, P.; Serraino, G.F. Neutrophil-to-lymphocyte Ratio and Platelet-to-lymphocyte Ratio as Biomarkers for Cardiovascular Surgery Procedures: A Literature Review. Rev. Recent. Clin. Trials 2021, 16, 173–179. [Google Scholar] [CrossRef]
- Wang, W.; Ren, D.; Wang, C.S.; Li, T.; Yao, H.C.; Ma, S.J. Prognostic efficacy of high-sensitivity C-reactive protein to albumin ratio in patients with acute coronary syndrome. Biomark. Med. 2019, 13, 811–820. [Google Scholar] [CrossRef]
- Ijsselmuiden, A.J.; Musters, R.J.; de Ruiter, G. Circulating white blood cells and platelets amplify oxidative stress in heart failure. Nat. Clin. Pract. Cardiovasc. Med. 2008, 5, 811–820. [Google Scholar] [CrossRef] [PubMed]
- Ponikowski, P.; Voors, A.A.; Anker, S.D.; Bueno, H.; Cleland, J.G.; Coats, A.J.; Falk, V.; González-Juanatey, J.R.; Harjola, V.P.; Jankowska, E.A.; et al. ESC guidelines for the diagnosis and treatment of acute and chronic heart failure: The task force for the diagnosis and treatment of acute and chronic heart failure of the European Society of Cardiology. Rev. ESP Cardiol. 2016, 69, 1167. [Google Scholar] [PubMed]
- Misiewicz, A.; Dymicka-Piekarska, V. Fashionable, but What is Their Real Clinical Usefulness? NLR, LMR, and PLR as a Promising Indicator in Colorectal Cancer Prognosis: A Systematic Review. J. Inflamm. Res. 2023, 16, 69–81. [Google Scholar] [CrossRef]
- Sevencan, N.; Ozkan, A. Associations between neutrophil/lymphocyte ratio, platelet/lymphocyte ratio, albuminuria and uric acid and the estimated glomerular filtration rate in hypertensive patients with chronic kidney disease stages 1–3. Arch. Med. Sci. 2019, 15, 1232–1239. [Google Scholar] [CrossRef] [PubMed]
- Wu, Y.; Cehn, Y.; Yang, X.; Chen, L.; Yang, Y. Neutrophil-to-lymphocyte ratio (NLR) and platelet-to-lymphocyte ratio (PLR) were associated with disease activity in patients with systemic lupus erythematosus. Int. Immunopharmacol. 2016, 36, 94–99. [Google Scholar] [CrossRef] [PubMed]
- Liao, C.K.; Yu, Y.L.; Lin, Y.C.; Hsu, Y.J.; Chern, Y.J.; Chiang, J.M.; You, J.F. Prognostic value of the C-reactive protein to albumin ratio in colorectal cancer: An updated systematic review and meta-analysis. World J. Surg. Oncol. 2021, 19, 139. [Google Scholar] [CrossRef] [PubMed]
- Onder, M.E.; Orucoglu, N.; Omar, F.; Canataroglu, A. C-Reactive Protein-to-Albumin Ratio: A Novel Inflammatory Marker and Disease Activity Sign in Early Rheumatoid Arthritis. Aktuelle Rheumatol. 2022, 47, 239–247. [Google Scholar] [CrossRef]
- Öztürk, S.; Basaran, A.; Erdogan, M.; Turan, Y. Association of Left Ventricular Ejection Fraction with Inflammation Parameters and Indexes. J. Tepecik Educ. Res. Hosp. 2022, 32, 439–447. [Google Scholar] [CrossRef]
- Durmus, E.; Kivrak, T.; Gerin, F.; Sunbul, M.; Sari, I.; Erdogan, O. Neutrophil-to-Lymphocyte Ratio and Platelet-to-Lymphocyte Ratio are Predictors of Heart Failure. Arq. Bras. Cardiol. 2015, 105, 606–613. [Google Scholar] [CrossRef]
- Yurtdas, M.; Ozdemir, M.; Aladag, N. Investigation of Neutrophil-to-Lymphocyte Ratio, Platelet-to-Lymphocyte Ratio and Mean Platelet Volume in Patients with Compensated Heart Failure. J. Acad. Res. Med. 2018, 8, 67–71. [Google Scholar] [CrossRef]
- Tamaki, S.; Nagai, Y.; Shutta, R.; Masuda, D.; Yamashita, S.; Seo, M.; Yamada, T.; Nakagawa, A.; Yasumura, Y.; Nakagawa, Y.; et al. Combination of Neutrophil-to-Lymphocyte and Platelet-to Lymphocyte Ratios as a Novel Predictor of Cardiac Death in Patients with Acute Decompensated Heart Failure with Preserved Left Ventricular Ejection Fraction: A Multicenter Study. J. Am. Heart Assoc. 2023, 12, e026326. [Google Scholar] [CrossRef] [PubMed]
- Yang, X.; Yang, X.; Yang, J.; Wen, X.; Wu, S.; Cui, L. High levels of high-sensitivity C reactive protein to albumin ratio can increase the risk of cardiovascular disease. J. Epidemiol. Community Health 2023, 77, 721–727. [Google Scholar] [CrossRef] [PubMed]
- Sonsöz, M.R.; Karadamar, N.; Yılmaz, H.Ç.; Eroğlu, Z.; Şahin, K.K.; Özateş, Y.; Güler, A.; Tekkeşin, A.İ. C-Reactive Protein to Albumin Ratio Predicts In-hospital Mortality in Patients with Acute Heart Failure. Türk Kardiyol. Derneği Arşivi 2023, 51, 174–181. [Google Scholar] [CrossRef] [PubMed]
- Kerkutluoglu, M. Prognostic role of C-reactive protein/albumin ratio on cardiovascular mortality in outpatients with heart failure. Med. Sci. 2023, 12, 1004–1009. [Google Scholar] [CrossRef]
- Wu, C.C.; Wu, C.H.; Lee, C.H.; Cheng, C.I. Association between neutrophil percentage-to-albumin ratio (NPAR), neutrophil-to-lymphocyte ratio (NLR), platelet-to-lymphocyte ratio (PLR) and long-term mortality in community-dwelling adults with heart failure: Evidence from US NHANES 2005–2016. BMC Cardiovasc. Disord. 2023, 23, 312. [Google Scholar] [CrossRef]
- Delcea, S.; Buzea, C.; Vijan, A.; Badila, E.; Dan, G.A. The platelet to lymphocyte ratio in heart failure: A comprehensive review. Rom. J. Intern. Med. 2023, 61, 84–97. [Google Scholar] [CrossRef]
Disclaimer/Publisher’s Note: The statements, opinions and data contained in all publications are solely those of the individual author(s) and contributor(s) and not of MDPI and/or the editor(s). MDPI and/or the editor(s) disclaim responsibility for any injury to people or property resulting from any ideas, methods, instructions or products referred to in the content. |
© 2024 by the authors. Licensee MDPI, Basel, Switzerland. This article is an open access article distributed under the terms and conditions of the Creative Commons Attribution (CC BY) license (https://creativecommons.org/licenses/by/4.0/).