Grip Strength, Anthropometric Indices, and Their Combination in Screening for Metabolic Syndrome in the Korean Population


Abstract
1. Introduction
2. Materials and Methods
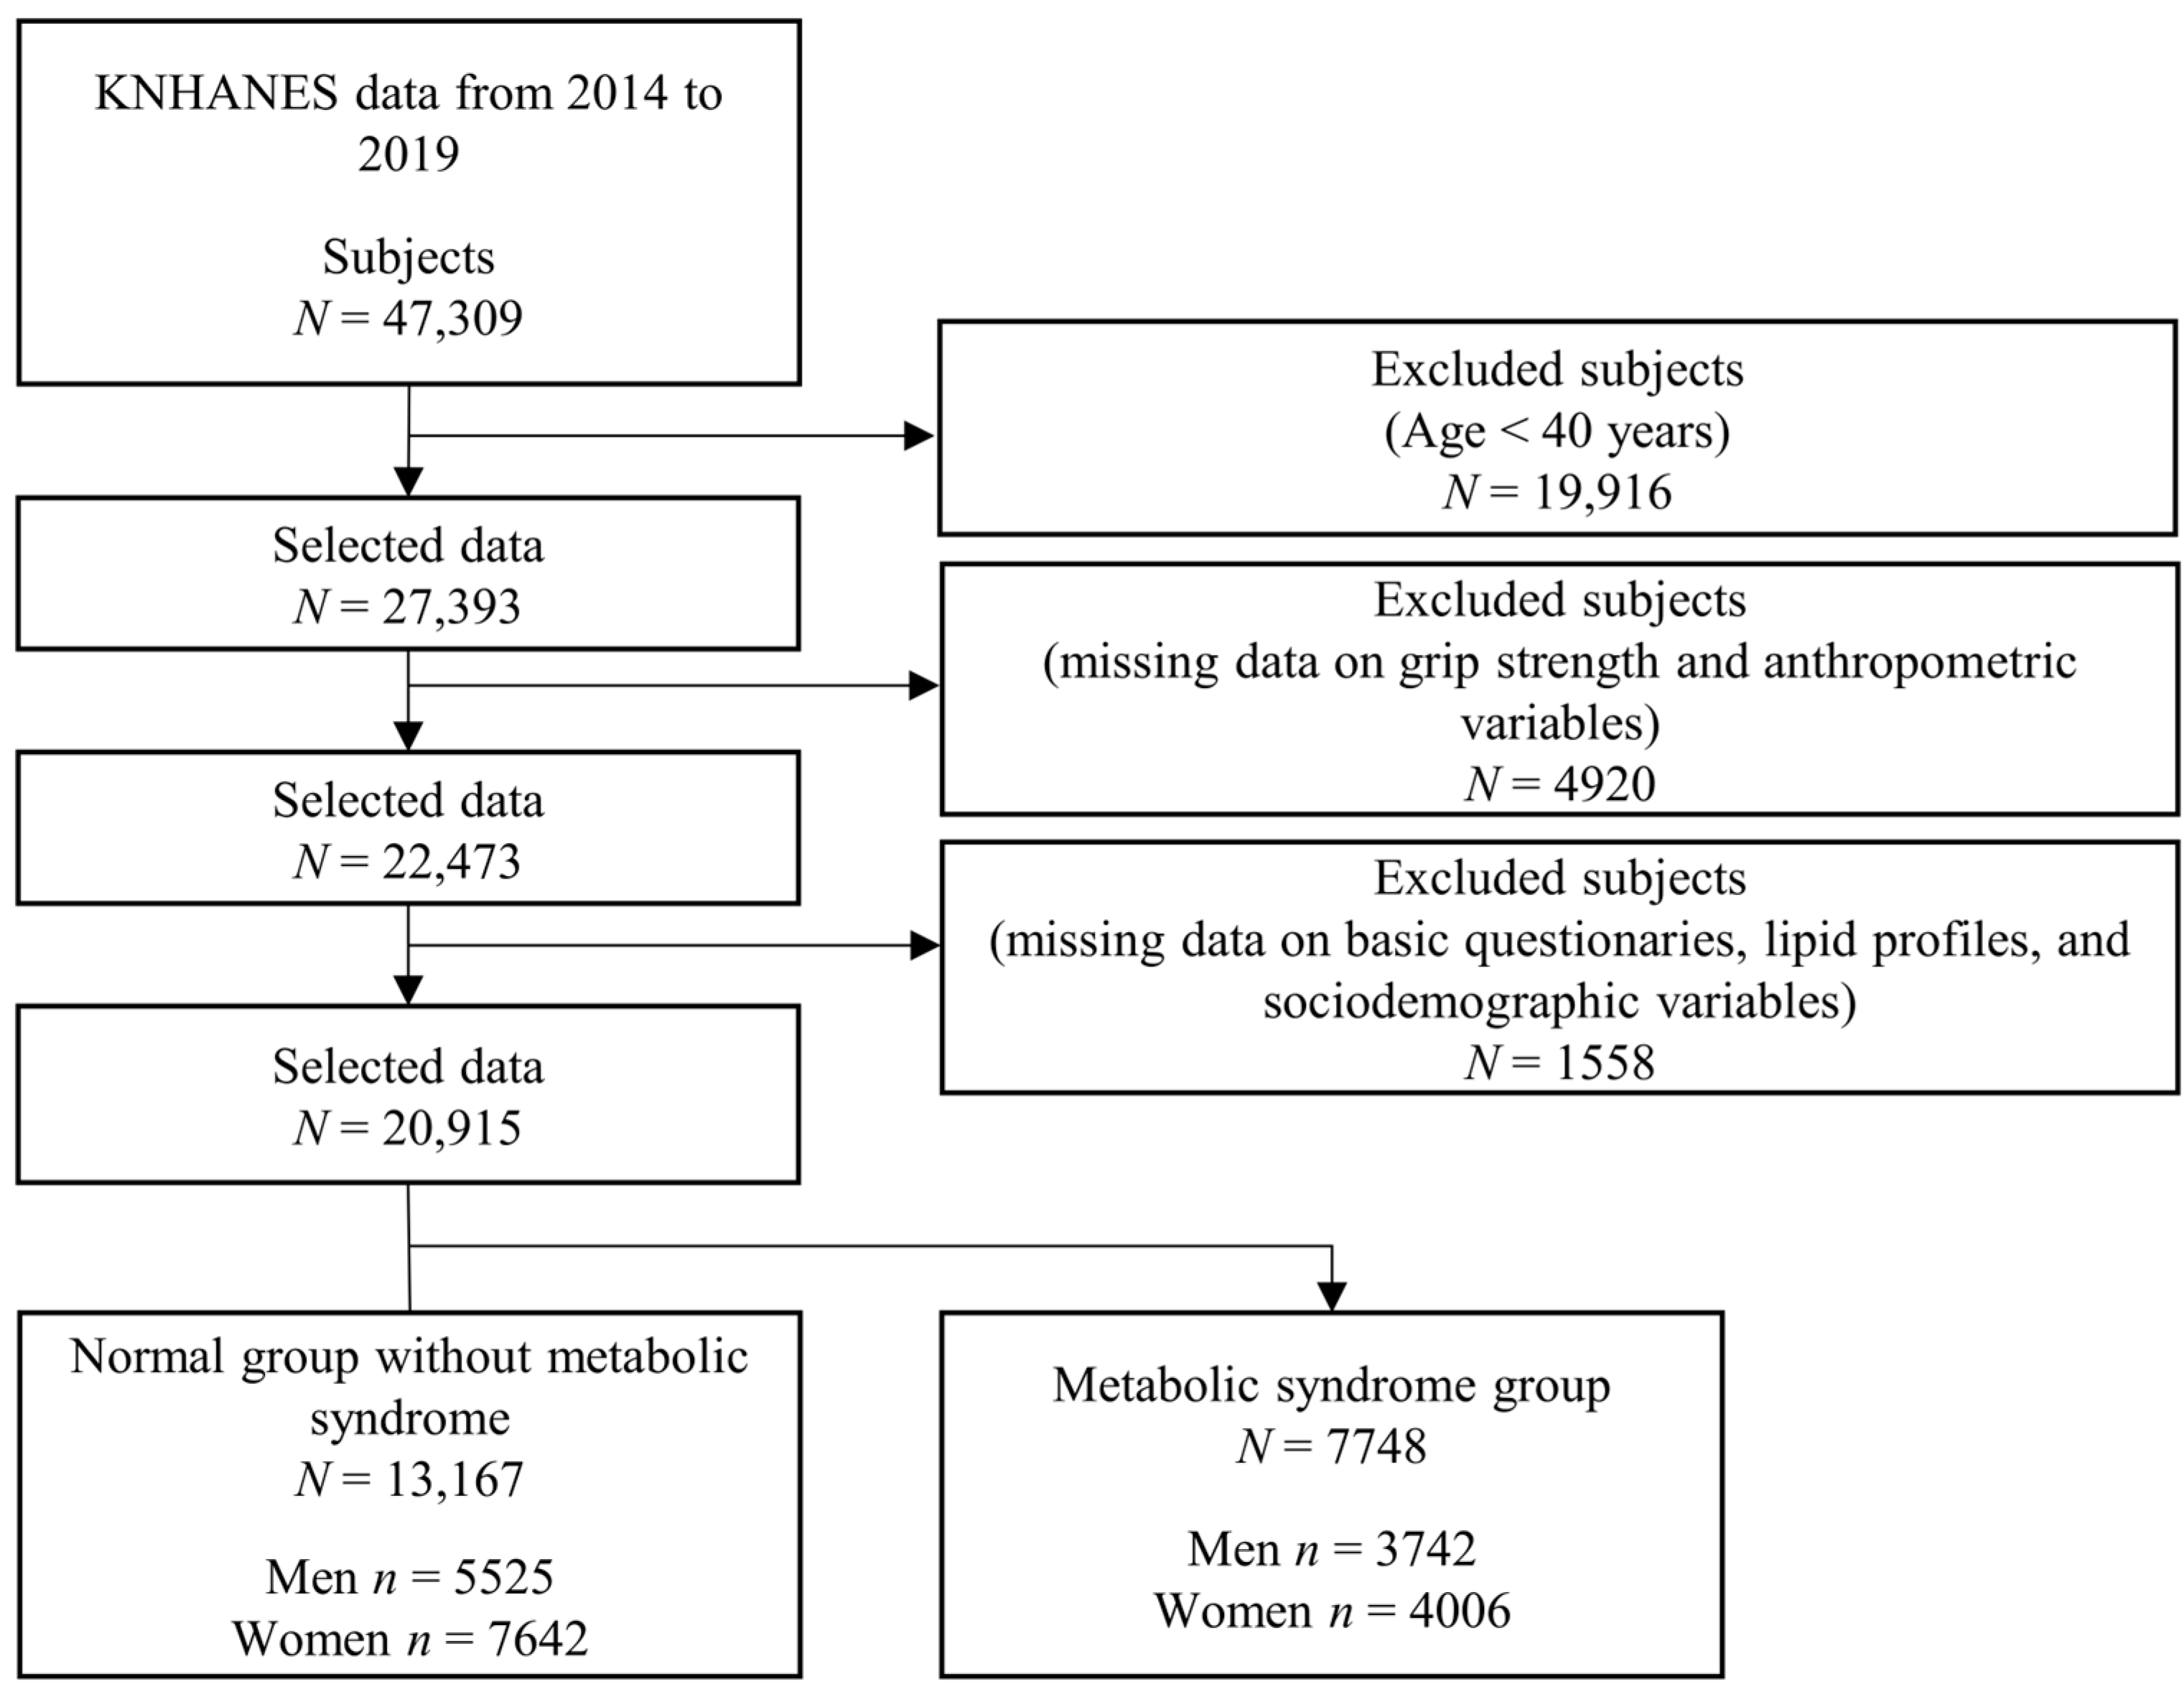
2.1. Study Population
2.2. Definition of Metabolic Syndrome
2.3. Measurements and Laboratory Tests
2.4. Covariates
2.5. Statistical Analysis
3. Results
4. Discussion
4.1. Comparison with Previous Studies
4.2. Limitations
5. Conclusions
Funding
Institutional Review Board Statement
Informed Consent Statement
Data Availability Statement
Conflicts of Interest
References
- Yang, S.; Yu, B.; Yu, W.; Dai, S.; Feng, C.; Shao, Y.; Zhao, X.; Li, X.; He, T.; Jia, P. Development and validation of an age-sex-ethnicity-specific metabolic syndrome score in the Chinese adults. Nat. Commun. 2023, 14, 6988. [Google Scholar] [CrossRef] [PubMed]
- Martin, S.S.; Aday, A.W.; Almarzooq, Z.I.; Anderson, C.A.M.; Arora, P.; Avery, C.L.; Baker-Smith, C.M.; Gibbs, B.B.; Beaton, A.Z.; Boehme, A.K.; et al. 2024 heart disease and stroke statistics: A report of us and global data from the American heart association. Circulation 2024, 149, e347–e913. [Google Scholar] [CrossRef] [PubMed]
- Wu, Q.; Li, J.; Sun, X.; He, D.; Cheng, Z.; Li, J.; Zhang, X.; Xie, Y.; Zhu, Y.; Lai, M. Multi-stage metabolomics and genetic analyses identified metabolite biomarkers of metabolic syndrome and their genetic determinants. EBioMedicine 2021, 74, 103707. [Google Scholar] [CrossRef] [PubMed]
- Alberti, K.G.; Zimmet, P.; Shaw, J. The metabolic syndrome—A new worldwide definition. Lancet 2005, 366, 1059–1062. [Google Scholar] [CrossRef] [PubMed]
- Lopez-Lopez, J.P.; Cohen, D.D.; Ney-Salazar, D.; Martinez, D.; Otero, J.; Gomez-Arbelaez, D.; Camacho, P.A.; Sanchez-Vallejo, G.; Arcos, E.; Narvaez, C.; et al. The prediction of metabolic syndrome alterations is improved by combining waist circumference and handgrip strength measurements compared to either alone. Cardiovasc. Diabetol. 2021, 20, 68. [Google Scholar] [CrossRef]
- Lee, W.J.; Peng, L.N.; Chiou, S.T.; Chen, L.K. Relative handgrip strength is a simple indicator of cardiometabolic risk among middle-aged and older people: A nationwide population-based study in Taiwan. PLoS ONE 2016, 11, e0160876. [Google Scholar] [CrossRef]
- Kawamoto, R.; Ninomiya, D.; Kasai, Y.; Kusunoki, T.; Ohtsuka, N.; Kumagi, T.; Abe, M. Handgrip strength is associated with metabolic syndrome among middle-aged and elderly community-dwelling persons. Clin. Exp. Hypertens. 2016, 38, 245–251. [Google Scholar] [CrossRef]
- Song, P.; Zhang, Y.; Wang, Y.; Han, P.; Fu, L.; Chen, X.; Yu, H.; Hou, L.; Yu, X.; Wang, L.; et al. Clinical relevance of different handgrip strength indexes and metabolic syndrome in Chinese community-dwelling elderly individuals. Arch. Gerontol. Geriatr. 2020, 87, 104010. [Google Scholar] [CrossRef]
- Shen, C.; Lu, J.; Xu, Z.; Xu, Y.; Yang, Y. Association between handgrip strength and the risk of new-onset metabolic syndrome: A population-based cohort study. BMJ Open 2020, 10, e041384. [Google Scholar] [CrossRef]
- Yi, D.W.; Khang, A.R.; Lee, H.W.; Son, S.M.; Kang, Y.H. Relative handgrip strength as a marker of metabolic syndrome: The Korea national health and nutrition examination survey (KNHANES) VI (2014-2015). Diabetes Metab. Syndr. Obes. 2018, 11, 227–240. [Google Scholar] [CrossRef]
- Lee, K. Mediation and moderation of adiposity indicators for the association between grip strength and cardiovascular disease risk scores. Metab. Syndr. Relat. Disord. 2021, 19, 422–427. [Google Scholar] [CrossRef] [PubMed]
- Noh, H.M.; Park, Y.S. Handgrip strength, dynapenia, and mental health in older Koreans. Sci. Rep. 2020, 10, 4004. [Google Scholar] [CrossRef] [PubMed]
- Jeon, Y.J.; Lee, S.K.; Shin, C. Normalized hand grip and back muscle strength as risk factors for incident type 2 diabetes mellitus: 16 years of follow-up in a population-based cohort study. Diabetes Metab. Syndr. Obes. 2021, 14, 741–750. [Google Scholar] [CrossRef]
- Jeon, Y.J.; Lee, S.K.; Shin, C. Relative hand grip and back muscle strength, but not mean muscle strength, as risk factors for incident metabolic syndrome and its metabolic components: 16 years of follow-up in a population-based cohort study. Appl. Sci. 2021, 11, 5198. [Google Scholar] [CrossRef]
- Sayer, A.A.; Syddall, H.E.; Dennison, E.M.; Martin, H.J.; Phillips, D.I.; Cooper, C.; Byrne, C.D. Grip strength and the metabolic syndrome: Findings from the hertfordshire cohort study. QJM 2007, 100, 707–713. [Google Scholar] [CrossRef]
- Wu, H.; Liu, M.; Chi, V.T.Q.; Wang, J.; Zhang, Q.; Liu, L.; Meng, G.; Yao, Z.; Bao, X.; Gu, Y.; et al. Handgrip strength is inversely associated with metabolic syndrome and its separate components in middle aged and older adults: A large-scale population-based study. Metabolism 2019, 93, 61–67. [Google Scholar] [CrossRef] [PubMed]
- d’Avila, J.C.; El Nabbout, T.G.M.; El Nabbout, H.G.M.; Silva, A.D.S.; Junior, A.C.B.R.; Fonseca, E.R.D.; Carlos, A.S.; Siqueira, R.D.A. Correlation between low handgrip strength and metabolic syndrome in older adults: A systematic review. Arch. Endocrinol. Metab. 2024, 68, e230026. [Google Scholar] [CrossRef]
- Chi, J.H.; Lee, B.J. Association between arthritis and hand grip strength indices combined with anthropometry in an older Korean population. PLoS ONE 2023, 18, e0291046. [Google Scholar] [CrossRef]
- Lee, B.J.; Chi, J.H. Association between anemia and grip strength indices combined with anthropometry in the Korean population. Sci. Rep. 2023, 13, 18517. [Google Scholar] [CrossRef]
- Chi, J.H.; Lee, B.J. Association of relative hand grip strength with myocardial infarction and angina pectoris in the Korean population: A large-scale cross-sectional study. BMC Public Health 2024, 24, 941. [Google Scholar] [CrossRef]
- Kweon, S.; Kim, Y.; Jang, M.J.; Kim, Y.; Kim, K.; Choi, S.; Chun, C.; Khang, Y.H.; Oh, K. Data resource profile: The Korea national health and nutrition examination survey (KNHANES). Int. J. Epidemiol. 2014, 43, 69–77. [Google Scholar] [CrossRef] [PubMed]
- Korea Disease Control and Prevention Agency. The Eighth Korea National Health and Nutrition Examination Survey (KNHANES VIII-1); Korea Disease Control and Prevention Agency: Cheongju-si, Republic of Korea, 2019.
- Korea Disease Control and Prevention Agency. The Sixth Korea National Health and Nutrition Examination Survey (KNHANES Ⅵ-2,3); Korea Disease Control and Prevention Agency: Cheongju-si, Republic of Korea, 2015.
- Korea Disease Control and Prevention Agency. The Seventh Korea National Health and Nutrition Examination Survey (KNHANES Ⅶ-1,2,3); Korea Disease Control and Prevention Agency: Cheongju-si, Republic of Korea, 2018.
- National Cholesterol Education Program Expert Panel on Detection Evaluation and Treatment of High Blood Cholesterol in Adults (Adult Treatment Panel III). Third report of the national cholesterol education program (NCEP) expert panel on detection, evaluation, and treatment of high blood cholesterol in adults (adult treatment panel III) final report. Circulation 2002, 106, 3143–3421. [Google Scholar] [CrossRef]
- Inoue, S.; Zimmet, P.; Catersen, I. Steering Committee of the WHO Western Pacific Region IASO&IOTF. In The Asia-Pacific Perspective: Redefining Obesity and Its Treatment; Health Communications Australia Pty Ltd.: Haymarket, Australia, 2000. [Google Scholar]
- Zhan, Y.; Yu, J.; Chen, R.; Gao, J.; Ding, R.; Fu, Y.; Zhang, L.; Hu, D. Socioeconomic status and metabolic syndrome in the general population of China: A cross-sectional study. BMC Public Health. 2012, 12, 921. [Google Scholar] [CrossRef]
- Lim, H.; Nguyen, T.; Choue, R.; Wang, Y. Sociodemographic disparities in the composition of metabolic syndrome components among adults in South Korea. Diabetes Care 2012, 35, 2028–2035. [Google Scholar] [CrossRef]
- Park, M.J.; Yun, K.E.; Lee, G.E.; Cho, H.J.; Park, H.S. A cross-sectional study of socioeconomic status and the metabolic syndrome in Korean adults. Ann. Epidemiol. 2007, 17, 320–326. [Google Scholar] [CrossRef]
- Chorong, O.; Hak-Seon, K. Metabolic Syndrome and Its Related Factors among Korean Elderly in Urban and Rural Areas. Culin. Sci. Hosp. Res. 2016, 22, 32–41. [Google Scholar]
- Gu, D.; Reynolds, K.; Wu, X.; Chen, J.; Duan, X.; Reynolds, R.F.; Whelton, P.K.; He, J.; InterASIA Collaborative Group. Prevalence of the metabolic syndrome and overweight among adults in China. Lancet 2005, 365, 1398–1405. [Google Scholar] [CrossRef] [PubMed]
- Kim, S.H.; Jeong, J.B.; Kang, J.; Ahn, D.W.; Kim, J.W.; Kim, B.G.; Lee, K.L.; Oh, S.; Yoon, S.H.; Park, S.J.; et al. Association between sarcopenia level and metabolic syndrome. PLoS ONE 2021, 16, e0248856. [Google Scholar] [CrossRef]
- Cheng, Y.J.; Gregg, E.W.; De Rekeneire, N.; Williams, D.E.; Imperatore, G.; Caspersen, C.J.; Kahn, H.S. Muscle-strengthening activity and its association with insulin sensitivity. Diabetes Care 2007, 30, 2264–2270. [Google Scholar] [CrossRef]
- Cooper, S.A.; Whaley-Connell, A.; Habibi, J.; Wei, Y.; Lastra, G.; Manrique, C.; Stas, S.; Sowers, J.R. Renin-angiotensin-aldosterone system and oxidative stress in cardiovascular insulin resistance. Am. J. Physiol. Heart Circ. Physiol. 2007, 293, H2009–H2023. [Google Scholar] [CrossRef]
- Oda, E. The metabolic syndrome as a concept of adipose tissue disease. Hypertens. Res. 2008, 31, 1283–1291. [Google Scholar] [CrossRef]
- Gallagher, E.J.; Leroith, D.; Karnieli, E. Insulin resistance in obesity as the underlying cause for the metabolic syndrome. Mt. Sinai J. Med. 2010, 77, 511–523. [Google Scholar] [CrossRef] [PubMed]
- Welty, F.K.; Alfaddagh, A.; Elajami, T.K. Targeting inflammation in metabolic syndrome. Transl. Res. 2016, 167, 257–280. [Google Scholar] [CrossRef] [PubMed]
- Esposito, K.; Pontillo, A.; Giugliano, F.; Giugliano, G.; Marfella, R.; Nicoletti, G.; Giugliano, D. Association of low interleukin-10 levels with the metabolic syndrome in obese women. J. Clin. Endocrinol. Metab. 2003, 88, 1055–1058. [Google Scholar] [CrossRef] [PubMed]
- Kim, S.J.; Lim, J.; Nam, G.E.; Park, H.S. Correlation between serum lipid parameters and interleukin-10 concentration in obese individuals. J. Obes. Metab. Syndr. 2021, 30, 173–177. [Google Scholar] [CrossRef]
- Chang, K.V.; Wu, W.T.; Chen, Y.H.; Chen, L.R.; Hsu, W.H.; Lin, Y.L.; Han, D.S. Enhanced serum levels of tumor necrosis factor-α, interleukin-1β, and -6 in sarcopenia: Alleviation through exercise and nutrition intervention. Aging 2023, 15, 13471–13485. [Google Scholar] [CrossRef] [PubMed]
- Ribeiro, J.C.; Duarte, J.G.; Gomes, G.A.O.; Costa-Guarisco, L.P.; de Jesus, I.T.M.; Nascimento, C.M.C.; Santos-Orlandi, A.A.; Orlandi, F.S.; Vasilceac, F.A.; Zazzetta, M.S.; et al. Associations between inflammatory markers and muscle strength in older adults according to the presence or absence of obesity. Exp. Gerontol. 2021, 151, 111409. [Google Scholar] [CrossRef]
- Kulshrestha, H.; Gupta, V.; Mishra, S.; Mahdi, A.A.; Awasthi, S.; Kumar, S. Interleukin-10 as a novel biomarker of metabolic risk factors. Diabetes Metab. Syndr. 2018, 12, 543–547. [Google Scholar] [CrossRef]

| Variable | Men | Women | ||||
|---|---|---|---|---|---|---|
| Healthy | MS | p Value a | Healthy | MS | p Value b | |
| Participants (n) | 5525 | 3742 | 7642 | 4006 | ||
| Age (years) *** | 55.12 ± 0.17 | 57.11 ± 0.21 | <0.001 | 53.92 ± 0.15 | 62.77 ± 0.22 | <0.001 |
| Anthropometric data | ||||||
| Height (cm) *** | 169.4 ± 0.11 | 169.8 ± 0.12 | 0.034 | 157.1 ± 0.08 | 154.9 ± 0.11 | <0.001 |
| Weight (kg) *** | 67.35 ± 0.16 | 75.31 ± 0.20 | <0.001 | 56.25 ± 0.11 | 62.85 ± 0.19 | <0.001 |
| WC (cm) *** | 83.66 ± 0.12 | 92.16 ± 0.14 | <0.001 | 77.25 ± 0.12 | 88.09 ± 0.17 | <0.001 |
| WHtR (ratio) ** | 0.49 ± 0.00 | 0.54 ± 0.00 | <0.001 | 0.49 ± 0.00 | 0.57 ± 0.00 | <0.001 |
| BMI (kg/m2) *** | 23.42 ± 0.04 | 26.08 ± 0.06 | <0.001 | 22.77 ± 0.04 | 26.16 ± 0.06 | <0.001 |
| Systolic BP (mmHg) *** | 118.6 ± 0.23 | 127.2 ± 0.32 | <0.001 | 115.1 ± 0.21 | 129.0 ± 0.34 | <0.001 |
| Diastolic BP (mmHg) *** | 77.22 ± 0.15 | 81.34 ± 0.23 | <0.001 | 73.89 ± 0.13 | 76.98 ± 0.19 | <0.001 |
| Grip strength | ||||||
| Absolute GS (kg) *** | 38.06 ± 0.13 | 38.06 ± 0.15 | 0.980 | 22.72 ± 0.07 | 21.19 ± 0.11 | <0.001 |
| GS/weight (kg/Weight) *** | 0.57 ± 0.00 | 0.51 ± 0.00 | <0.001 | 0.41 ± 0.00 | 0.34 ± 0.00 | <0.001 |
| GS/BMI (kg/BMI) *** | 1.64 ± 0.01 | 1.47 ± 0.01 | <0.001 | 1.01 ± 0.00 | 0.82 ± 0.00 | <0.001 |
| GS/WHtR (kg/WHtR) *** | 77.63 ± 0.29 | 70.63 ± 0.32 | <0.001 | 46.75 ± 0.17 | 37.69 ± 0.21 | <0.001 |
| Geographic area ** | ||||||
| Urban | 82.87 (1.21) | 80.63 (1.35) | <0.001 | 85.09 (1.08) | 79.52 (1.42) | <0.001 |
| Rural | 17.13 (1.21) | 19.37 (1.35) | 14.91 (1.08) | 20.48 (1.42) | ||
| Education level *** | ||||||
| <= Elementary school | 13.34 (0.54) | 16.27 (0.69) | <0.001 | 17.94 (0.58) | 47.05 (1.01) | <0.001 |
| Middle school | 11.55 (0.50) | 13.98 (0.67) | 11.54 (0.44) | 14.82 (0.68) | ||
| High school | 33.4 (0.80) | 33.84 (0.95) | 38.62 (0.72) | 26.35 (0.88) | ||
| >= University | 41.71 (0.97) | 35.91 (1.08) | 31.9 (0.82) | 11.79 (0.64) | ||
| Occupation type *** | ||||||
| White-collar worker | 17.56 (0.68) | 15.72 (0.77) | <0.001 | 11.79 (0.45) | 3.89 (0.35) | <0.001 |
| Office worker | 13.14 (0.60) | 12.08 (0.63) | 9.03 (0.37) | 3.42 (0.35) | ||
| Service worker | 10.36 (0.54) | 9.9 (0.61) | 18.35 (0.55) | 15.43 (0.74) | ||
| Farmer or fisher | 5.59 (0.47) | 6.29 (0.54) | 2.34 (0.24) | 4.24 (0.48) | ||
| Blue-collar worker | 26.06 (0.80) | 23.93 (0.87) | 3.73 (0.28) | 2.63 (0.31) | ||
| Elementary occupations | 8.44 (0.42) | 7.65 (0.50) | 10.85 (0.41) | 13.67 (0.66) | ||
| Unemployed (housewife, etc.) | 18.85 (0.58) | 24.42 (0.83) | 43.91 (0.72) | 56.73 (0.98) | ||
| Household income level *** | ||||||
| Low | 13.08 (0.53) | 17.13 (0.76) | <0.001 | 14.83 (0.53) | 32.63 (0.91) | <0.001 |
| Middle-low | 23.25 (0.70) | 24.38 (0.85) | 22.72 (0.62) | 27.58 (0.83) | ||
| Middle-high | 29.15 (0.74) | 26.97 (0.91) | 27.9 (0.64) | 22.16 (0.78) | ||
| High | 34.52 (0.94) | 31.52 (1.00) | 34.56 (0.84) | 17.62 (0.78) | ||
| Smoking status *** | ||||||
| Daily | 33.57 (0.81) | 36.55 (0.94) | <0.001 | 4.38 (0.29) | 4.25 (0.39) | <0.001 |
| Past | 46.45 (0.79) | 48.14 (0.97) | 4.43 (0.27) | 3.85 (0.33) | ||
| Never | 19.98 (0.63) | 15.31 (0.68) | 91.19 (0.4) | 91.9 (0.50) | ||
| Alcohol intake *** | ||||||
| Yes | 81.34 (0.64) | 83.61 (0.75) | <0.001 | 66.06 (0.63) | 52.43 (0.97) | <0.001 |
| No | 18.66 (0.64) | 16.39 (0.75) | 33.94 (0.63) | 47.57 (0.97) | ||
| Stress status ** | ||||||
| Extreme | 2.84 (0.26) | 3.92 (0.38) | <0.001 | 3.9 (0.26) | 5.28 (0.41) | <0.001 |
| High | 18.43 (0.63) | 18.73 (0.74) | 19.82 (0.52) | 18.89 (0.75) | ||
| Slight | 60.9 (0.78) | 58.39 (0.93) | 60.78 (0.63) | 53.42 (0.90) | ||
| Rare | 17.82 (0.56) | 18.96 (0.75) | 15.5 (0.47) | 22.41 (0.74) | ||
| Physical activity status (days) *** | ||||||
| 0 | 65.79 (0.72) | 71.48 (0.87) | <0.001 | 80.64 (0.54) | 89.17 (0.57) | <0.001 |
| 1~2 | 10.24 (0.49) | 8.54 (0.53) | 7.4 (0.35) | 3.62 (0.34) | ||
| 3~4 | 11.45 (0.51) | 7.94 (0.51) | 6.71 (0.35) | 3.63 (0.34) | ||
| >5 | 12.52 (0.50) | 12.04 (0.62) | 5.26 (0.29) | 3.57 (0.32) | ||
| Menopause status | ||||||
| Yes | 54.47 (0.73) | 81.04 (0.80) | <0.001 | |||
| No | 45.53 (0.73) | 18.96 (0.80) | ||||
| Blood profiles | ||||||
| FPG (mg/dL) *** | 100.0 ± 0.34 | 117.6 ± 0.63 | <0.001 | 94.34 ± 0.18 | 114.7 ± 0.56 | <0.001 |
| HDL (mg/dL) *** | 49.76 ± 0.17 | 42.69 ± 0.20 | <0.001 | 57.27 ± 0.17 | 46.41 ± 0.19 | <0.001 |
| TG (mg/dL) *** | 132.9 ± 1.77 | 236.4 ± 4.00 | <0.001 | 98.24 ± 0.67 | 174.6 ± 2.09 | <0.001 |
| High BP *** | ||||||
| No | 75.87 (0.68) | 28.41 (0.89) | <0.001 | 81.7 (0.50) | 27.14 (0.83) | <0.001 |
| Yes | 24.13 (0.68) | 71.59 (0.89) | 18.3 (0.50) | 72.86 (0.83) | ||
| High FPG *** | ||||||
| No | 66.71 (0.76) | 18.79 (0.79) | <0.001 | 80.88 (0.54) | 25.32 (0.79) | <0.001 |
| Yes | 33.29 (0.76) | 81.21 (0.79) | 19.12 (0.54) | 74.68 (0.79) | ||
| Low HDL *** | ||||||
| No | 81.83 (0.61) | 35.12 (0.96) | <0.001 | 68.06 (0.63) | 12.88 (0.61) | <0.001 |
| Yes | 18.17 (0.61) | 64.88 (0.96) | 31.94 (0.63) | 87.12 (0.61) | ||
| High TG *** | ||||||
| No | 75.87 (0.68) | 27.26 (0.85) | <0.001 | 89.99 (0.41) | 45.31 (0.94) | <0.001 |
| Yes | 24.13 (0.68) | 72.74 (0.85) | 10.01 (0.41) | 54.69 (0.94) | ||
| High WC *** | ||||||
| No | 84.98 (0.55) | 33.33 (0.92) | <0.001 | 86.85 (0.47) | 31.33 (0.90) | <0.001 |
| Yes | 15.02 (0.55) | 66.67 (0.92) | 13.15 (0.47) | 68.67 (0.90) | ||
| Dominant hand | ||||||
| Right | 88.47 (0.54) | 88.78 (0.60) | 0.573 | 90.09 (0.41) | 89.05 (0.56) | 0.572 |
| Left | 4.96 (0.34) | 5.13 (0.40) | 4.32 (0.28) | 4.9 (0.40) | ||
| Both | 6.57 (0.42) | 6.09 (0.45) | 5.58 (0.31) | 6.05 (0.43) | ||
| Variable | Crude | Model 1 | Model 2 | |||
|---|---|---|---|---|---|---|
| OR | p Value | adj. OR | adj. p Value | adj. OR | adj. p Value | |
| Anthropometry | ||||||
| Height | 1.05 (1.00–1.10) | 0.035 | 1.17 (1.11–1.24) | <0.001 | 1.19 (1.13–1.26) | <0.001 |
| Weight | 2.41 (2.26–2.57) | <0.001 | 3.15 (2.92–3.40) | <0.001 | 3.36 (3.10–3.64) | <0.001 |
| BMI | 3.02 (2.80–3.26) | <0.001 | 3.33 (3.08–3.61) | <0.001 | 3.49 (3.21–3.79) | <0.001 |
| WHtR | 3.98 (3.65–4.35) | <0.001 | 3.99 (3.65–4.36) | <0.001 | 4.08 (3.72–4.46) | <0.001 |
| Grip strength | ||||||
| Absolute GS | 1.00 (0.95–1.05) | 0.98 | 1.13 (1.07–1.20) | <0.001 | 1.16 (1.09–1.23) | <0.001 |
| GS/weight | 0.53 (0.50–0.56) | <0.001 | 0.53 (0.50–0.57) | <0.001 | 0.52 (0.49–0.55) | <0.001 |
| GS/BMI | 0.57 (0.54–0.60) | <0.001 | 0.56 (0.53–0.60) | <0.001 | 0.55 (0.51–0.59) | <0.001 |
| GS/WHtR | 0.64 (0.60–0.67) | <0.001 | 0.62 (0.58–0.67) | <0.001 | 0.62 (0.58–0.66) | <0.001 |
| Variable | Crude | Model 1 | Model 2 | |||
|---|---|---|---|---|---|---|
| OR | p Value | adj. OR | adj. p Value | adj. OR | adj. p Value | |
| Anthropometry | ||||||
| Height | 0.68 (0.65–0.71) | <0.001 | 1.02 (0.96–1.08) | 0.536 | 1.10 (1.03–1.16) | 0.002 |
| Weight | 2.24 (2.12–2.37) | <0.001 | 3.11 (2.91–3.33) | <0.001 | 3.08 (2.88–3.29) | <0.001 |
| BMI | 3.37 (3.15–3.60) | <0.001 | 3.48 (3.25–3.73) | <0.001 | 3.39 (3.17–3.63) | <0.001 |
| WHtR | 5.27 (4.87–5.71) | <0.001 | 4.49 (4.14–4.87) | <0.001 | 4.40 (4.05–4.79) | <0.001 |
| Grip strength | ||||||
| Absolute GS | 0.73 (0.69–0.76) | <0.001 | 1.06 (1.01–1.13) | 0.03 | 1.09 (1.03–1.16) | 0.003 |
| GS/weight | 0.43 (0.40–0.45) | <0.001 | 0.52 (0.49–0.55) | <0.001 | 0.53 (0.50–0.56) | <0.001 |
| GS/BMI | 0.40 (0.38–0.42) | <0.001 | 0.51 (0.48–0.54) | <0.001 | 0.53 (0.50–0.56) | <0.001 |
| GS/WHtR | 0.41 (0.38–0.43) | <0.001 | 0.54 (0.51–0.58) | <0.001 | 0.57 (0.53–0.60) | <0.001 |
Disclaimer/Publisher’s Note: The statements, opinions and data contained in all publications are solely those of the individual author(s) and contributor(s) and not of MDPI and/or the editor(s). MDPI and/or the editor(s) disclaim responsibility for any injury to people or property resulting from any ideas, methods, instructions or products referred to in the content. |
© 2024 by the author. Licensee MDPI, Basel, Switzerland. This article is an open access article distributed under the terms and conditions of the Creative Commons Attribution (CC BY) license (https://creativecommons.org/licenses/by/4.0/).
Share and Cite
Lee, B.J. Grip Strength, Anthropometric Indices, and Their Combination in Screening for Metabolic Syndrome in the Korean Population. J. Clin. Med. 2024, 13, 5988. https://doi.org/10.3390/jcm13195988
Lee BJ. Grip Strength, Anthropometric Indices, and Their Combination in Screening for Metabolic Syndrome in the Korean Population. Journal of Clinical Medicine. 2024; 13(19):5988. https://doi.org/10.3390/jcm13195988
Chicago/Turabian StyleLee, Bum Ju. 2024. "Grip Strength, Anthropometric Indices, and Their Combination in Screening for Metabolic Syndrome in the Korean Population" Journal of Clinical Medicine 13, no. 19: 5988. https://doi.org/10.3390/jcm13195988
APA StyleLee, B. J. (2024). Grip Strength, Anthropometric Indices, and Their Combination in Screening for Metabolic Syndrome in the Korean Population. Journal of Clinical Medicine, 13(19), 5988. https://doi.org/10.3390/jcm13195988