
Associations between Kidney Disease Progression and Metabolomic Profiling in Stable Kidney Transplant Recipients—A 3 Year Follow-Up Prospective Study

 , , ,
, , ,
Abstract
1. Introduction
2. Methods
3. Results
4. Discussion
Author Contributions
Funding
Institutional Review Board Statement
Informed Consent Statement
Data Availability Statement
Conflicts of Interest
References
- Hariharan, S.; Israni, A.K.; Danovitch, G. Long-Term Survival after Kidney Transplantation. N. Engl. J. Med. 2021, 385, 729–743. [Google Scholar] [CrossRef] [PubMed]
- Loupy, A.; Aubert, O.; Orandi, B.J.; Naesens, M.; Bouatou, Y.; Raynaud, M.; Divard, G.; Jackson, A.M.; Viglietti, D.; Giral, M.; et al. Prediction system for risk of allograft loss in patients receiving kidney transplants: International derivation and validation study. BMJ 2019, 366, l4923. [Google Scholar] [CrossRef] [PubMed]
- Divard, G.; Raynaud, M.; Tatapudi, V.S.; Abdalla, B.; Bailly, E.; Assayag, M.; Binois, Y.; Cohen, R.; Zhang, H.; Ulloa, C.; et al. Comparison of artificial intelligence and human-based prediction and stratification of the risk of long-term kidney allograft failure. Commun. Med. 2022, 2, 150. [Google Scholar] [CrossRef] [PubMed]
- Raynaud, M.; Al-Awadhi, S.; Louis, K.; Zhang, H.; Su, X.; Goutaudier, V.; Wang, J.; Demir, Z.; Wei, Y.; Truchot, A.; et al. Prognostic Biomarkers in Kidney Transplantation: A Systematic Review and Critical Appraisal. J. Am. Soc. Nephrol. 2024, 35, 177–188. [Google Scholar] [CrossRef] [PubMed]
- Steinbrenner, I.; Schultheiss, U.T.; Bachle, H.; Cheng, Y.; Behning, C.; Schmid, M.; Yeo, W.J.; Yu, B.; Grams, M.E.; Schlosser, P.; et al. Associations of Urine and Plasma Metabolites With Kidney Failure and Death in a Chronic Kidney Disease Cohort. Am. J. Kidney Dis. 2024, 84, 469–481. [Google Scholar] [CrossRef] [PubMed]
- Kalim, S.; Rhee, E.P. An overview of renal metabolomics. Kidney Int. 2017, 91, 61–69. [Google Scholar] [CrossRef]
- Raynaud, M.; Al-Awadhi, S.; Juric, I.; Divard, G.; Lombardi, Y.; Basic-Jukic, N.; Aubert, O.; Dubourg, L.; Masson, I.; Mariat, C.; et al. Race-free estimated glomerular filtration rate equation in kidney transplant recipients: Development and validation study. BMJ 2023, 381, e073654. [Google Scholar] [CrossRef]
- Grams, M.E.; Sang, Y.; Ballew, S.H.; Matsushita, K.; Astor, B.C.; Carrero, J.J.; Chang, A.R.; Inker, L.A.; Kenealy, T.; Kovesdy, C.P.; et al. Evaluating Glomerular Filtration Rate Slope as a Surrogate End Point for ESKD in Clinical Trials: An Individual Participant Meta-Analysis of Observational Data. J. Am. Soc. Nephrol. 2019, 30, 1746–1755. [Google Scholar] [CrossRef] [PubMed]
- Rhee, E.P.; Clish, C.B.; Wenger, J.; Roy, J.; Elmariah, S.; Pierce, K.A.; Bullock, K.; Anderson, A.H.; Gerszten, R.E.; Feldman, H.I. Metabolomics of Chronic Kidney Disease Progression: A Case-Control Analysis in the Chronic Renal Insufficiency Cohort Study. Am. J. Nephrol. 2016, 43, 366–374. [Google Scholar] [CrossRef]
- Bassi, R.; Niewczas, M.A.; Biancone, L.; Bussolino, S.; Merugumala, S.; Tezza, S.; D’Addio, F.; Ben Nasr, M.; Valderrama-Vasquez, A.; Usuelli, V.; et al. Metabolomic Profiling in Individuals with a Failing Kidney Allograft. PLoS ONE 2017, 12, e0169077. [Google Scholar] [CrossRef]
- Iwamoto, H.; Okihara, M.; Akashi, I.; Kihara, Y.; Konno, O.; Kawachi, S.; Sunamura, M.; Sugimoto, M. Metabolomic Profiling of Plasma, Urine, and Saliva of Kidney Transplantation Recipients. Int. J. Mol. Sci. 2022, 23, 13938. [Google Scholar] [CrossRef] [PubMed]
- Yeo, W.J.; Surapaneni, A.L.; Hasson, D.C.; Schmidt, I.M.; Sekula, P.; Kottgen, A.; Eckardt, K.U.; Rebholz, C.M.; Yu, B.; Waikar, S.S.; et al. Serum and Urine Metabolites and Kidney Function. J. Am. Soc. Nephrol. 2024, 35, 1252–1265. [Google Scholar] [CrossRef]
- Klein, A.; Kosinski, L.; Loupy, A.; Frey, E.; Stegall, M.; Helantera, I.; Newell, K.; Meier-Kriesche, H.U.; Mannon, R.B.; Fitzsimmons, W.E.; et al. Comparing the prognostic performance of iBOX and biopsy-proven acute rejection for long-term kidney graft survival. Am. J. Transplant. 2024, 24, 1784–1793. [Google Scholar] [CrossRef]
- Knol, M.G.E.; Wulfmeyer, V.C.; Muller, R.U.; Rinschen, M.M. Amino acid metabolism in kidney health and disease. Nat. Rev. Nephrol. 2024. [Google Scholar] [CrossRef]
- Chan, W.; Chin, S.H.; Whittaker, A.C.; Jones, D.; Kaur, O.; Bosch, J.A.; Borrows, R. The Associations of Muscle Strength, Muscle Mass, and Adiposity With Clinical Outcomes and Quality of Life in Prevalent Kidney Transplant Recipients. J. Ren. Nutr. 2019, 29, 536–547. [Google Scholar] [CrossRef]
- van Vliet, I.M.Y.; Post, A.; Kremer, D.; Boslooper-Meulenbelt, K.; van der Veen, Y.; de Jong, M.F.C.; Pol, R.A.; TransplantLines, I.; Jager-Wittenaar, H.; Navis, G.J.; et al. Muscle mass, muscle strength and mortality in kidney transplant recipients: Results of the TransplantLines Biobank and Cohort Study. J. Cachexia Sarcopenia Muscle 2022, 13, 2932–2943. [Google Scholar] [CrossRef] [PubMed]
- Ozcan, S.G.; Sonmez, O.; Atli, Z.; Karaca, C.; Alagoz, S.; Akman, Z.; Koroglu, A.E.; Pekmezci, S.; Trabulus, S.; Seyahi, N. Sarcopenia, an overlooked diagnosis in kidney transplant recipients. Clin. Nephrol. 2024, 101, 59–70. [Google Scholar] [CrossRef] [PubMed]
- Neinast, M.D.; Jang, C.; Hui, S.; Murashige, D.S.; Chu, Q.; Morscher, R.J.; Li, X.; Zhan, L.; White, E.; Anthony, T.G.; et al. Quantitative Analysis of the Whole-Body Metabolic Fate of Branched-Chain Amino Acids. Cell Metab. 2019, 29, 417–429.e414. [Google Scholar] [CrossRef] [PubMed]
- Hu, Y.; Jiang, W. Mannose and glycine: Metabolites with potentially causal implications in chronic kidney disease pathogenesis. PLoS ONE 2024, 19, e0298729. [Google Scholar] [CrossRef] [PubMed]
- Post, A.; Groothof, D.; Kremer, D.; Knobbe, T.J.; Abma, W.; Koops, C.A.; Tsikas, D.; Wallimann, T.; Dullaart, R.P.F.; Franssen, C.F.M.; et al. Creatine homeostasis and the kidney: Comparison between kidney transplant recipients and healthy controls. Amino Acids 2024, 56, 42. [Google Scholar] [CrossRef] [PubMed]
- Chasapi, S.A.; Karagkouni, E.; Kalavrizioti, D.; Vamvakas, S.; Zompra, A.; Takis, P.G.; Goumenos, D.S.; Spyroulias, G.A. NMR-Based Metabolomics in Differential Diagnosis of Chronic Kidney Disease (CKD) Subtypes. Metabolites 2022, 12, 490. [Google Scholar] [CrossRef] [PubMed]
- Manca, M.L.; Solini, A.; Haukka, J.K.; Sandholm, N.; Forsblom, C.; Groop, P.H.; Ferrannini, E. Differential metabolomic signatures of declining renal function in Types 1 and 2 diabetes. Nephrol. Dial. Transplant. 2021, 36, 1859–1866. [Google Scholar] [CrossRef] [PubMed]

| Parameter | Negative GFR Slope, n = 45 | Positive GFR Slope, n = 27 | p-Value |
|---|---|---|---|
| Women, n (%) | 15 (33.3%) | 10 (37%) | 0.749 |
| Age, mean (±standard deviation) | 46.3 (±11.8) | 45.2 (±11.7) | 0.716 |
| Years since transplantation, mean (±standard deviation) | 7.4 (±6.4) | 6 (±4.8) | 0.33 |
| CKD etiology Glomerulonephritis, n (%) | 27 (60%) | 13 (48.1%) | 0.614 |
| Deceased donor, n (%) | 23 (51.1%) | 14 (51.9%) | 0.951 |
| Preemptive transplantation, n (%) | 13 (29.5%) | 7 (25.9%) | 0.631 |
| Dialysis vintage, mean (±standard deviation) | 2.16 (±2.8) | 1.8 (±1.9) | 0.576 |
| Estimated GFR in mL/min/1.73 m2, mean (±standard deviation) | 63.4 (±13.9) | 55.8 (±11.1) | 0.019 |
| GFR slope in mL/min/1.73 m2, mean (±standard deviation) | −3.99 (±4.1) | 1.89 (±1.7) | <0.001 |
| Smokers, n (%) | 8 (17.8%) | 5 (18.5%) | 0.937 |
| Systolic blood pressure in mmHg, mean (±standard deviation) | 140.8 (±15.7) | 142.2 (±18) | 0.731 |
| Body mass index in kg/m2, mean (±standard deviation) | 26.2 (± 3.9) | 26.3 (±4.4) | 0.866 |
| Hemoglobin in g/dL, mean (±standard deviation) | 13.5 (±1.5) | 13.7 (±1.4) | 0.586 |
| Urinary protein on creatinine ratio in mg/g, mean (±standard deviation) | 0.43 (±1.07) | 0.21 (±0.58) | 0.332 |
| Total cholesterol in mg/dL, mean (±standard deviation) | 200 (±47.5) | 214.6 (±40.7) | 0.203 |
| Triglycerides in mg/dL, mean (±standard deviation) | 154.2 (±71.6) | 156.7 (±83) | 0.895 |
| Tacrolimus-based immunosuppression, n (%) | 26 (57.8%) | 19 (70.4%) | 0.467 |
| Mycophenolate use, n (%) | 44 (97.8%) | 26 (96.3%) | 0.711 |
| Corticosteroid use, n (%) | 32 (71.1%) | 21 (77.8%) | 0.534 |
| Pulse wave velocity in cm/s, mean (±standard deviation) | 6.47 (±1.83) | 6.47 (±1.44) | 0.992 |
| Hand grip strength in kg, mean (±standard deviation) | 34.6 (±8.1) | 38.3 (±10.5) | 0.102 |
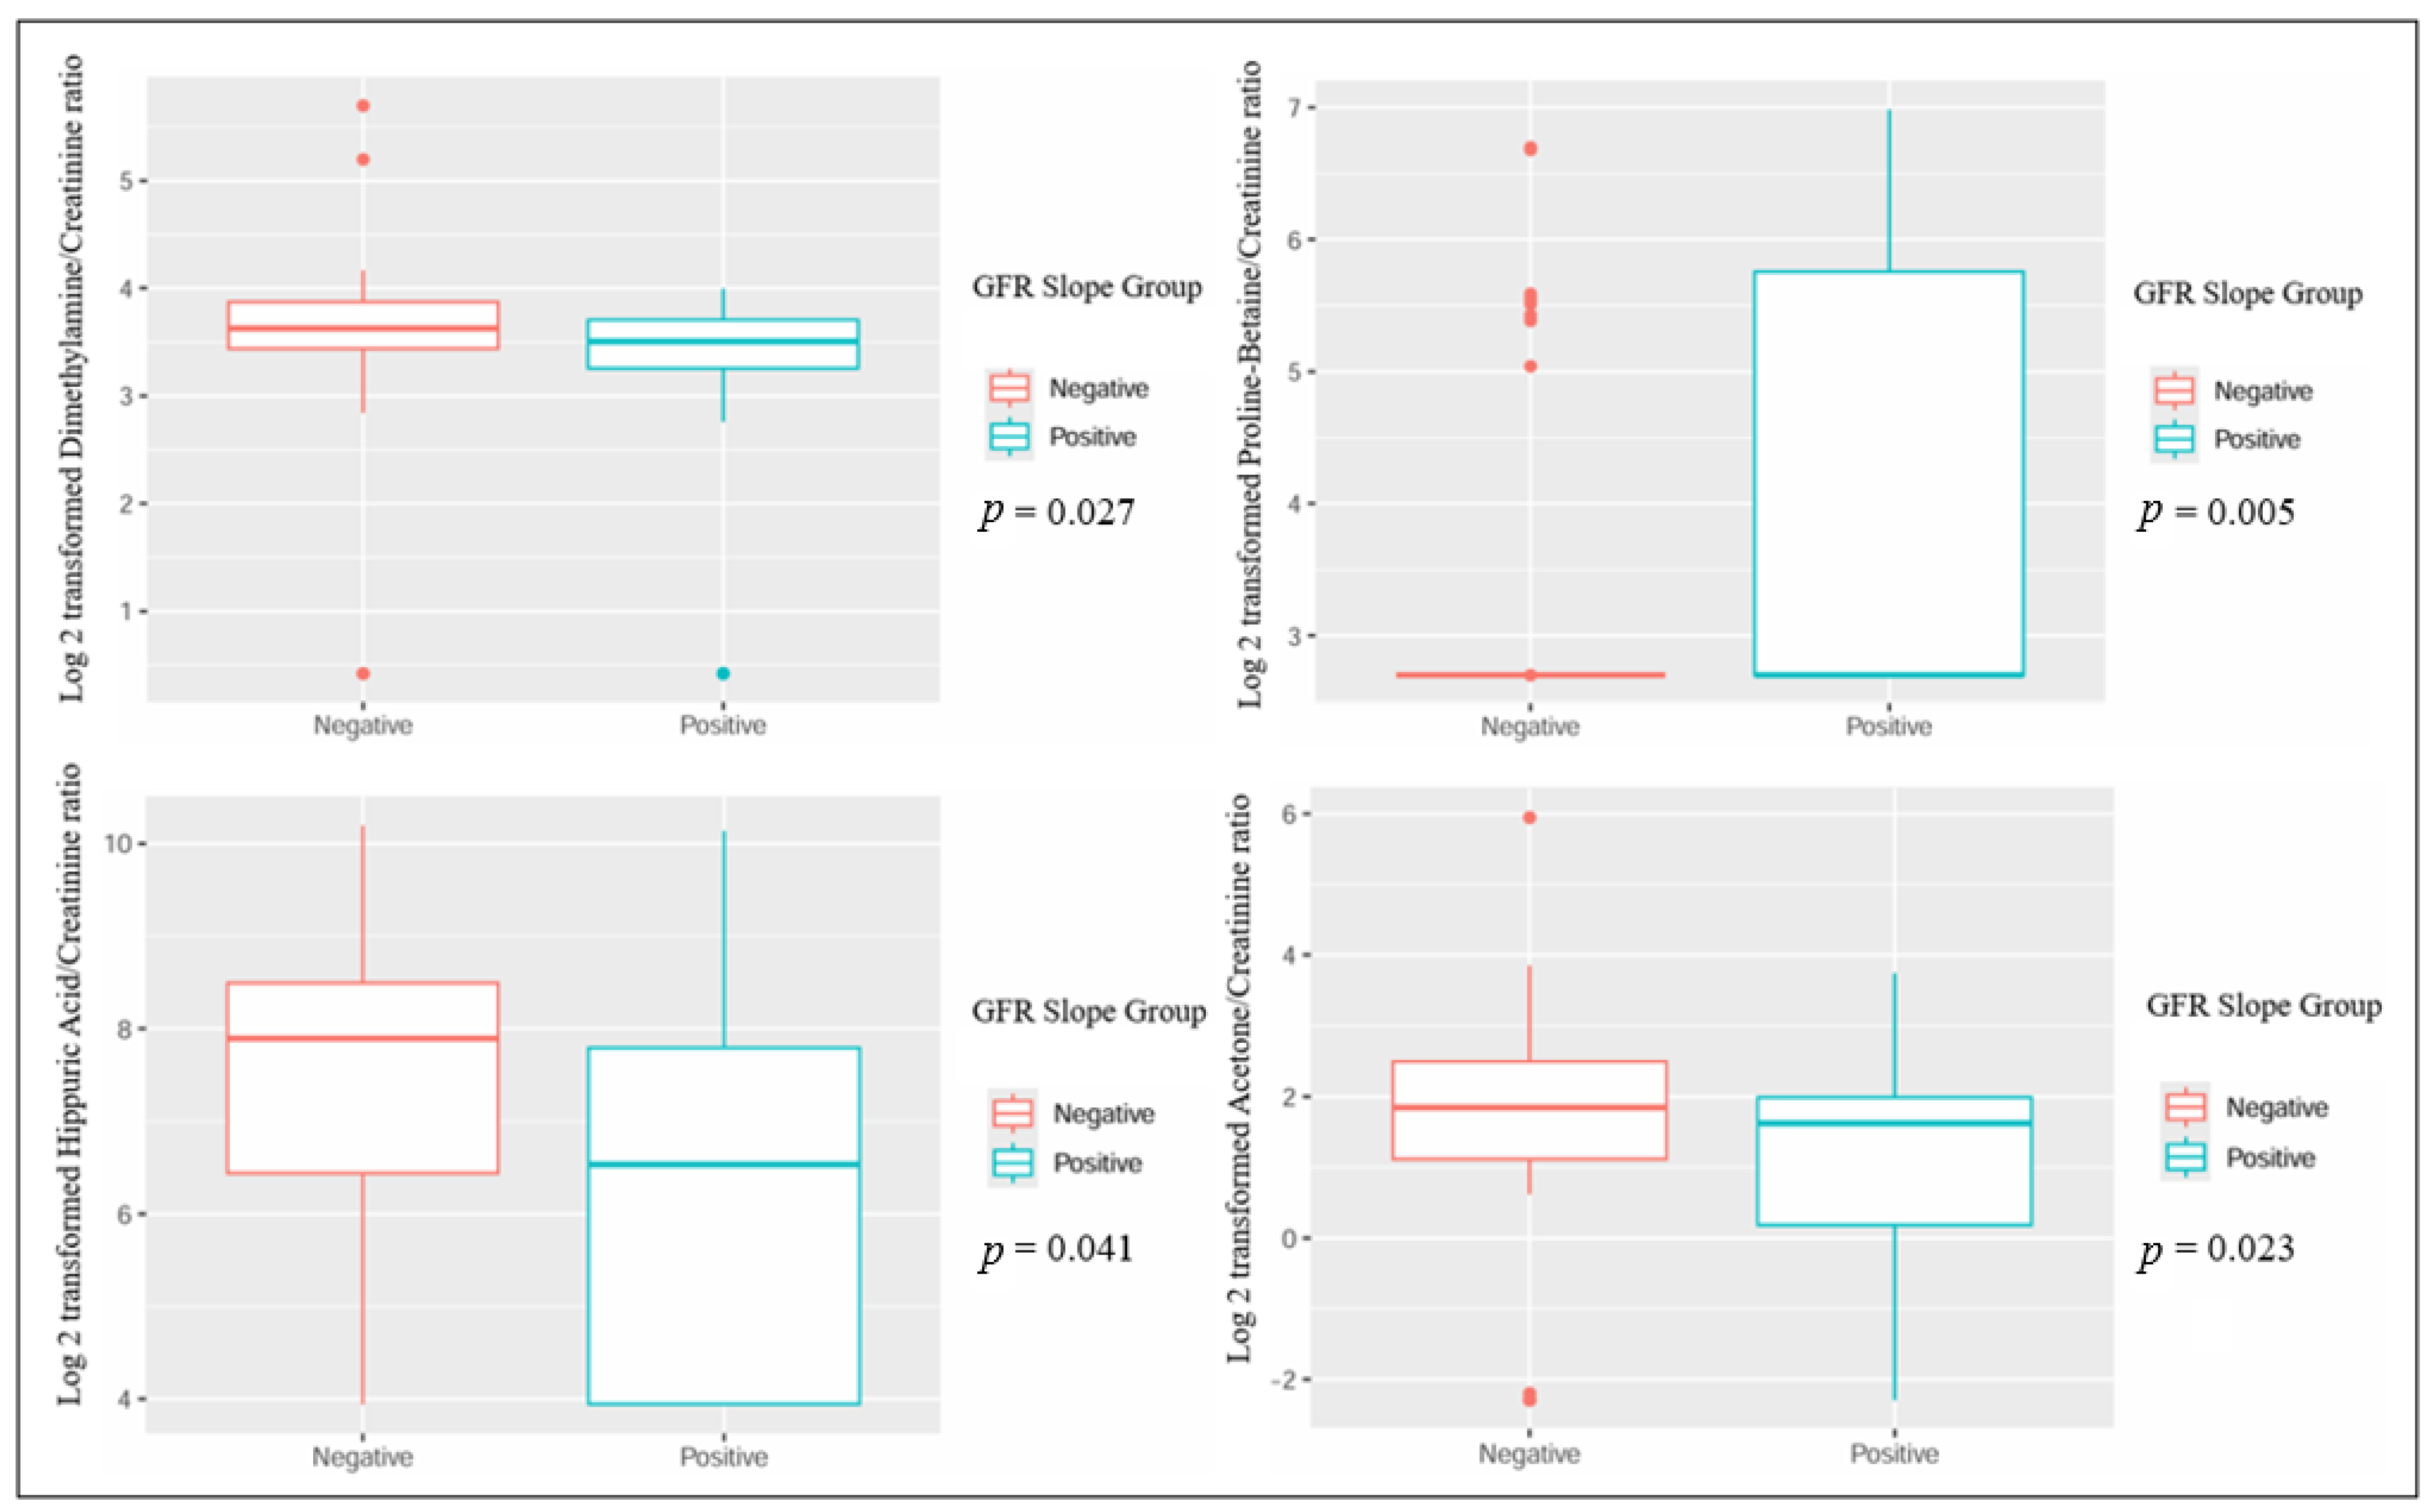
| Metabolite | Negative GFR Slope, n = 45 | Positive GFR Slope, n = 27 | p Value |
|---|---|---|---|
| Log 2 transformation of dimethylamine/creatinine ratio, mean (±standard deviation) | 3.63 (±0.69) | 3.16 (±1.04) | 0.027 |
| Log 2 transformation of alanine/creatinine ratio, mean (±standard deviation) | 3.56 (±1.39) | 3.40 (±1.62) | 0.680 |
| Log 2 transformation of glycine/creatinine ratio, mean (±standard deviation) | 4.42 (±1.61) | 4.09 (±1.83) | 0.439 |
| Log 2 transformation of proline betaine/creatinine ratio, mean (±standard deviation) | 3.18 (±1.15) | 4.14 (±1.62) | 0.005 |
| Log 2 transformation of valine/creatinine ratio, mean (±standard deviation) | 0.68 (±1.56) | 0.66 (±1.78) | 0.960 |
| Log 2 transformation of hippuric acid/creatinine ratio, mean (±standard deviation) | 7.33 (±1.93) | 6.29 (±2.12) | 0.041 |
| Log 2 transformation of citric acid/creatinine ratio, mean (±standard deviation) | 5.83 (±1.91) | 5.65 (±1.87) | 0.699 |
| Log 2 transformation of formic acid/creatinine ratio, mean (±standard deviation) | 1.23 (±1.8) | 1.02 (±1.51) | 0.611 |
| Log 2 transformation of succinic acid/creatinine ratio, mean (±standard deviation) | 2.83 (±1.44) | 2.91 (±1.22) | 0.815 |
| Log 2 transformation of acetoacetic acid/creatinine ratio, mean (±standard deviation) | 3.71 (±1.42) | 3.41 (±1.52) | 0.408 |
| Log 2 transformation of acetone/creatinine ratio, mean (±standard deviation) | 1.88 (±1.33) | 1 (±1.82) | 0.023 |
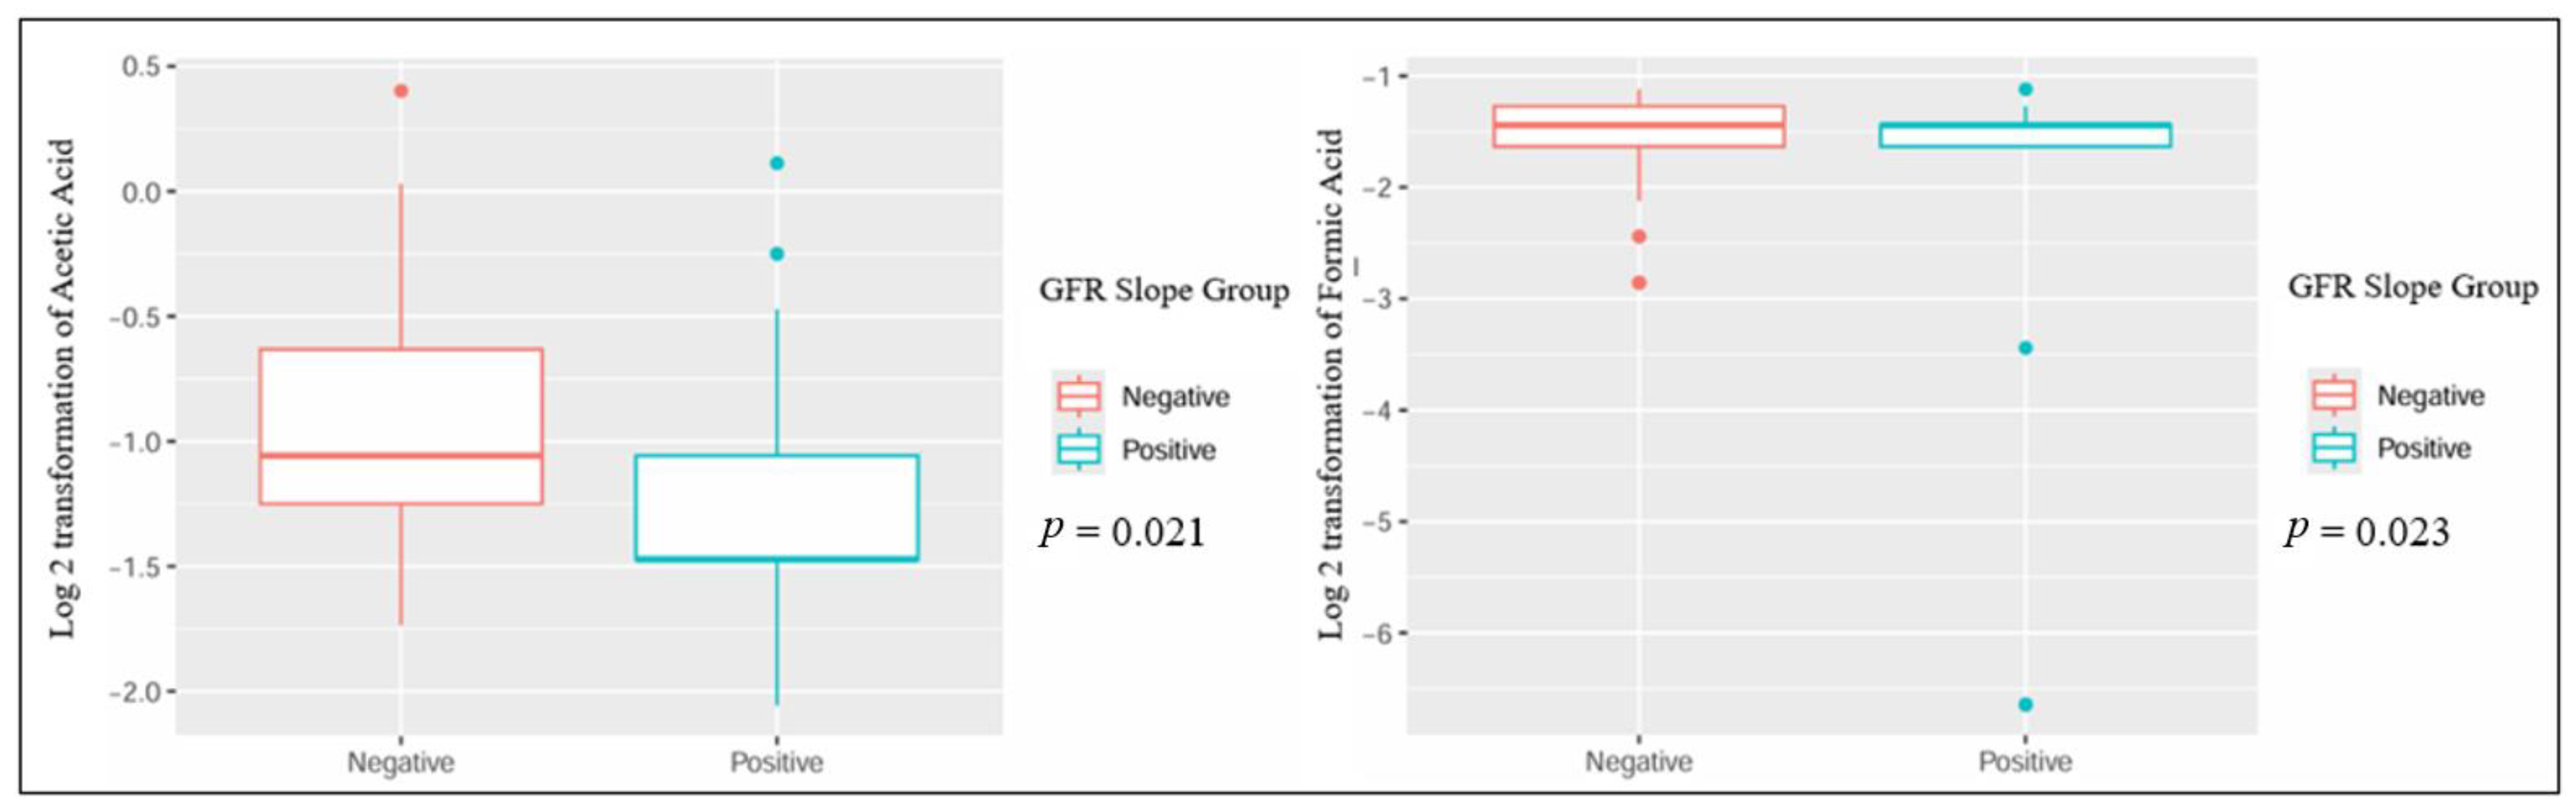
| Metabolite | Negative GFR Slope, n = 45 | Positive GFR Slope, n = 27 | p Value |
|---|---|---|---|
| Log 2 transformation of alanine, mean (±standard deviation) | 2.11 (±0.29) | 2.14 (±0.21) | 0.587 |
| Log 2 transformation of glutamic acid, mean (±standard deviation) | 2.16 (±0.5) | 2.03 (±0.49) | 0.275 |
| Log 2 transformation of glutamine, mean (±standard deviation) | 2.77 (±0.69) | 2.87 (±0.34) | 0.509 |
| Log 2 transformation of glycine, mean (±standard deviation) | 1.43 (±0.37) | 1.33 (±0.43) | 0.284 |
| Log 2 transformation of histidine, mean (±standard deviation) | 0.82 (±0.3) | 0.77 (±0.31) | 0.506 |
| Log 2 transformation of isoleucine, mean (±standard deviation) | −0.13 (±0.36) | −0.19 (±0.38) | 0.523 |
| Log 2 transformation of leucine, mean (±standard deviation) | 0.76 (±0.34) | 0.74(±0.33) | 0.790 |
| Log 2 transformation of methionine, mean (±standard deviation) | −1.14 (±1.48) | −1.30 (±1.52) | 0.661 |
| Log 2 transformation of phenylalanine, mean (±standard deviation) | 0.79 (± 0.34) | 0.64 (±0.3) | 0.08 |
| Log 2 transformation of tyrosine, mean (±standard deviation) | 0.08 (±0.3) | 0.13 (±0.35) | 0.553 |
| Log 2 transformation of valine, mean (±standard deviation) | 1.59 (±0.23) | 1.57 (±0.25) | 0.694 |
| Log 2 transformation of acetic acid, mean (±standard deviation) | −0.95 (±0.46) | 1.57 (±0.25) | 0.021 |
| Log 2 transformation of formic acid, mean (±standard deviation) | −1.53 (±0.43) | −2.14 (±1.67) | 0.023 |
| Log 2 transformation of lactic acid, mean (±standard deviation) | 4.71 (±0.49) | 4.69 (±0.56) | 0.868 |
| Log 2 transformation of acetone, mean (±standard deviation) | −1.87 (±1.07) | −2.05 (±1.2) | 0.513 |
| Parameter | Negative GFR Slope, n = 41 | Positive GFR Slope, n = 26 | p-Value |
|---|---|---|---|
| Estimated GFR in mL/min/1.73 m2, mean (±standard deviation) | 53.5 (±17) | 60.6 (±11.5) | 0.058 |
| Hemoglobin in g/dL, mean (±standard deviation) | 12.1 (±2.2) | 13.4 (±1.3) | 0.01 |
| Urinary protein in creatinine ratio in mg/g, mean (±standard deviation) | 0.57 (±1.07) | 0.25 (±0.57) | 0.177 |
| Patients with infection episodes, n (%) | 17 (38.6%) | 11 (40.7%) | 0.860 |
| Patients with rejection episodes, n (%) | 9 (20.5%) | 5 (18.5%) | 0.842 |
| Renal outcomes (one of progression to end-stage kidney disease, dialysis, or retransplantation, 40% loss of GFR, death) | 6 (13.6%) | 1 (3.7%) | 0.173 |
Disclaimer/Publisher’s Note: The statements, opinions and data contained in all publications are solely those of the individual author(s) and contributor(s) and not of MDPI and/or the editor(s). MDPI and/or the editor(s) disclaim responsibility for any injury to people or property resulting from any ideas, methods, instructions or products referred to in the content. |
© 2024 by the authors. Licensee MDPI, Basel, Switzerland. This article is an open access article distributed under the terms and conditions of the Creative Commons Attribution (CC BY) license (https://creativecommons.org/licenses/by/4.0/).
Share and Cite
Andrian, T.; Siriteanu, L.; Voroneanu, L.; Nicolescu, A.; Deleanu, C.; Covic, A.; Covic, A. Associations between Kidney Disease Progression and Metabolomic Profiling in Stable Kidney Transplant Recipients—A 3 Year Follow-Up Prospective Study. J. Clin. Med. 2024, 13, 5983. https://doi.org/10.3390/jcm13195983
Andrian T, Siriteanu L, Voroneanu L, Nicolescu A, Deleanu C, Covic A, Covic A. Associations between Kidney Disease Progression and Metabolomic Profiling in Stable Kidney Transplant Recipients—A 3 Year Follow-Up Prospective Study. Journal of Clinical Medicine. 2024; 13(19):5983. https://doi.org/10.3390/jcm13195983
Chicago/Turabian StyleAndrian, Titus, Lucian Siriteanu, Luminița Voroneanu, Alina Nicolescu, Calin Deleanu, Andreea Covic, and Adrian Covic. 2024. "Associations between Kidney Disease Progression and Metabolomic Profiling in Stable Kidney Transplant Recipients—A 3 Year Follow-Up Prospective Study" Journal of Clinical Medicine 13, no. 19: 5983. https://doi.org/10.3390/jcm13195983
APA StyleAndrian, T., Siriteanu, L., Voroneanu, L., Nicolescu, A., Deleanu, C., Covic, A., & Covic, A. (2024). Associations between Kidney Disease Progression and Metabolomic Profiling in Stable Kidney Transplant Recipients—A 3 Year Follow-Up Prospective Study. Journal of Clinical Medicine, 13(19), 5983. https://doi.org/10.3390/jcm13195983