Abstract
Postoperative pulmonary complications have a deleterious impact in regards to thoracic surgery. Pneumonectomy is associated with the highest perioperative risk in elective thoracic surgery. The data from 152 patients undergoing pneumonectomy in this multicenter retrospective study were extracted from the German Thorax Registry database and presented after univariate and multivariate statistical processing. This retrospective study investigated the incidence of postoperative pulmonary complications (PPCs) and their impact on perioperative morbidity and mortality. Patient-specific, preoperative, procedural, and postoperative risk factors for PPCs and in-hospital mortality were analyzed. A total of 32 (21%) patients exhibited one or more PPCs, and 11 (7%) died during the hospital stay. Multivariate stepwise logistic regression identified a preoperative FEV1 < 50% (OR 9.1, 95% CI 1.9–67), the presence of medical complications (OR 7.4, 95% CI 2.7–16.2), and an ICU stay of more than 2 days (OR 14, 95% CI 3.9–59) as independent factors associated with PPCs. PPCs (OR 13, 95% CI 3.2–52), a preoperative FEV1 < 60% in patients with previous pulmonary infection (OR 21, 95% CI 3.2–52), and continued postoperative mechanical ventilation (OR 8.4, 95% CI 2–34) were independent factors for in-hospital mortality. Our data emphasizes that PPCs are a significant risk factor for morbidity and mortality after pneumonectomy. Intensified perioperative care targeting the underlying risk factors and effects of PPCs, postoperative ventilation, and preoperative respiratory infections, especially in patients with reduced pulmonary reserve, could improve patient outcomes.
1. Introduction
Patients with extensive lung cancer or other diseases requiring who undergo pneumonectomy surgery have a high perioperative risk of morbidity and mortality [1,2].
Recent advances in perioperative care, surgical techniques, and systemic oncologic therapy have led to improved outcomes in lung cancer patients, allowing those previously considered as inoperable to receive surgical therapy [3,4].
However, short-term morbidity and mortality have not changed significantly in patients undergoing pneumonectomy who experience postoperative pulmonary complications (PPC), which are the leading cause of non-surgical morbidity. In spite of this, within the recent literature, there is little information regarding perioperative risk factors [5].
The aim of this clinical study was to identify the effect of patient and procedure-related elements, along with postoperative factors, on the incidence of postoperative pulmonary complications as the primary endpoint. In addition, the effects of surgical, pulmonary, and non-pulmonary complications on perioperative morbidity and mortality were quantified as secondary endpoints.
2. Materials and Methods
2.1. Data Source
The data were collected from the German Thorax Registry, a retrospective multicenter cohort register and database reporting >150 perioperative items, investigating patients undergoing noncardiac thoracic surgery from 2017–2021. A total of 152 consecutive patients undergoing pneumonectomy at all 4 contributing tertiary care hospitals (University Hospital of Freiburg, the Hospital of the University Witten/Herdecke-Cologne, and the University Hospitals of Düsseldorf and Munich) were identified during this 4-year period and were included in this analysis (Figure 1). The data were submitted via a web-based application into a central database. Patient data were anonymized.

Figure 1.
Consort diagram depicting the case selection. PPC = postoperative pulmonary complications.
2.2. Ethics
The present study was performed according to the published guidelines of the German Thorax Registry. The application for data analysis was granted by the advisory board. Ethics approval for this study (Ethical Committee of the University Witten/Herdecke, approval No.: 64/2014, 24 June 2014) was obtained.
The study was planned and designed in compliance with the initiative for strengthening the reporting of observational studies in epidemiology (STROBE) (Supplementary Table S1) [6].
2.3. Patient-Related Factors
Figure 1 defines the selection process for the cases presented in this study. Patient-specific risk factors included gender, body mass index (BMI), age, ASA physical status, smoking status, and the presence of a preoperative pulmonary infection within 4 weeks before surgery. The preoperative therapies were examined, including previous lung surgery, as well as neoadjuvant/preoperative radio- and/ or chemotherapy (RCT). Preoperative laboratory parameters (hemoglobin, leukocytes, C-reactive protein) and preoperative pulmonary function tests (forced expiratory volume in one second (FEV1), functional vital capacity (FVC), and diffusion capacity of carbon monoxide (DLCO single breath), expressed as percentages of the predicted value, and the results of the capillary blood gas analysis were analyzed.
2.4. Procedure-Related Factors
The extent of the surgical resection, amount of intraoperative blood loss, the duration (incision–suture time), and location of the operation were analyzed. Relevant complications requiring surgical or interventional therapy during the primary postoperative hospital stay were documented. Surgical complications such as the rate of reoperations, chylothorax, bronchial stump insufficiency (BSI), postoperative empyema, postoperative bleeding, duration of bronchopleural fistula (BPF), and subsequent need for a new chest drain were recorded. The perioperative management was planned and performed by the anesthesiologist in charge. All patients underwent the pneumonectomy under general anesthesia, with one-lung ventilation (OLV). Analysis of the anesthetic management focused on the type of regional anesthesia, i.e., continuous thoracic epidural analgesia (TEA) or continuous thoracic paravertebral block, single shot paravertebral block (PVB), or intercostal nerve block (ICB). The intraoperative ventilator settings (fraction of inspired oxygen (FiO2), respiratory rate per minute, level of positive endexpiratory airway pressure (PEEP), inspiratory airway pressure, and driving pressure) indicating invasiveness of ventilation and additional measures in case of hypoxemia during OLV (pulmonary artery banding, CPAP to the nonventilated lung) and the duration of OLV were recorded. The amount of intraoperative infusion of crystalloids, colloids, and blood products transfused was analyzed. The sum of blood loss and urine output was subtracted from the total volume of fluids infused, and the resulting net intraoperative balance was calculated to assess the effects on postoperative pulmonary complications.
2.5. Postoperative Factors
Complications with therapeutic consequences were recorded during the primary postoperative hospital stay.
The general assessment of the postoperative respiratory status included oxygen requirement, along with the respiratory parameters (respiratory rate, Horowitz oxygenation index (PaO2 (mmHg)/FiO2), ventilator settings) for spontaneous breathing and postoperative mechanical ventilation, if primary extubation in the operation theater was not possible. The need for therapeutic non-invasive ventilation (NIV) for respiratory failure, the rate of re-intubation and mechanical ventilation following the operation, and the duration of mechanical ventilation were analyzed.
Postoperative pulmonary complications (PPC) were the primary endpoint of the study due to their deleterious effects on pneumonectomy patients.
PPCs were defined as the following
- Acute respiratory distress syndrome according to the Berlin classification, excluding the criterion regarding “bilateral infiltrates” after pneumonectomy [7];
- Postoperative respiratory failure, with increasing oxygen requirement (≥4 L/min) and intensified physiotherapy;
- Re-intubation following the postoperative endotracheal extubation due to respiratory failure;
- Therapeutical non-invasive ventilation (NIV) for respiratory failure;
- New onset postoperative pneumonia (EPCO), defined as: new pulmonary infiltrates with associated leukocytosis, fever, new purulent sputum, the need for antibiotic therapy, and increased oxygen demand [8];
- The need for extracorporeal membrane oxygenation (ECMO) for respiratory failure subsequent to mechanical ventilation.
The definitions chosen in our study aimed at identifying severe complications and were tailored to the specific patient group. Commonly used PPCs, including pneumothorax and pleural effusion on the operative side, are not necessarily complications after pneumonectomy.
The secondary outcomes included the incidence of postoperative medical complications, surgical complications, postoperative in-hospital mortality during the primary postoperative stay until discharge, and the length of postoperative stay, including ICU and total hospital stay. Postoperative medical, non-respiratory complications included the incidence of cardiac complications (new onset arrhythmia, myocardial infarction, cardiac failure), renal failure, sepsis, delirium, cardiac arrest, and severe neurologic gastrointestinal complications. Surgical complications included re-operation after the primary operation, postoperative empyema, chylothorax, surgical site infection, and postoperative hematothorax.
The primary postoperative admission unit (post anesthesia care unit (PACU), intensive care unit (ICU), high dependency unit (HDU)) was recorded.
The total postoperative length of hospital stay (LOS), days in HDU/ICU, and survival during the hospital stay were calculated. If a patient was discharged from the hospital, survival was assumed, unless reported otherwise. Readmission rates and mortality after primary discharge were beyond the scope of this study.
2.6. Statistics
For statistical analysis, IBM SPSS Statistics for Windows® (Version 23.0 Armonk, NY, USA: IBM Corp.) was used. Univariate analysis was performed by dividing the specific cohorts into two groups according to the dependent variable. Continuous variables were calculated using the Mann–Whitney U test and presented as mean ± standard deviations. Continuous and ordinal variables were dichotomized and transformed into categorical variables using a stepwise approach to determine cut-off values. Categorical variables were calculated with the X2-test. All tests were two-tailed, and a p-value of <0.05 was considered statistically significant. Only statistically significant parameters with a p < 0.005 in the univariate analysis were included in the multivariate stepwise logistic regression analysis to identify their independent statistical effects on the respective variable. Survival was computed using a Kaplan–Meier estimator, evaluating the differences using a log-rank test.
3. Results
The incidence of one or more PPCs after pneumonectomy in this group was 21% (32/152). A total of 19 patients exhibited one PPC, 7 patients had 2 PPCs, and 6 patients presented 3 or more PPCs. The specific PPCs are shown in Figure 2.
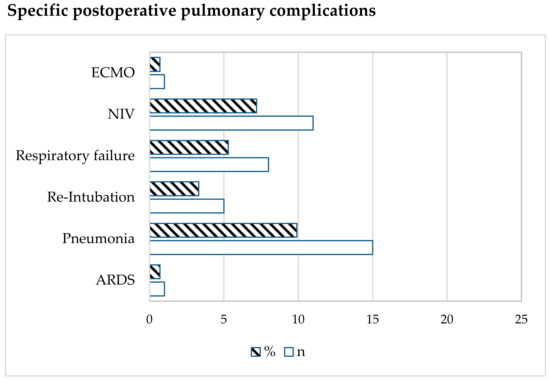
Figure 2.
Type of postoperative pulmonary complication. Data are expressed as number (n) or %. ECMO = extracorporeal membrane oxygenation; NIV = non-invasive ventilation; ARDS = Acute Respiratory Distress Syndrome.
Table 1 shows the results of the univariate analysis comparing the patient-specific and preoperative characteristics of patients undergoing pneumonectomy, with or without PPCs. The procedure-related risk factors (anesthesiologic and surgical) are presented in Table 2. The association between the incidence of PPCs and in-hospital mortality is illustrated in Figure 3. Compared to the mean mortality of 7% (11/152), the mortality in patients with PPCs was significantly increased and correlated with the number of PPCs (3%, 21%, 29%, and 33% for 0, 1, 2, and ≥3 PPCs). The total mortality in patients with any PPC was 25% (8/32), compared to that in patients without PPCs (p < 0.001).

Table 1.
Univariate analysis of patient-related and preoperative parameters leading to risk factors for PPCs in patients undergoing pneumonectomy. The data are presented as percentages and the number of patients (n) or mean ± standard deviation. PPC = postoperative pulmonary complication; BMI = body mass index; ASA PS = American Society of Anesthesiologists Physical Status. DLCO = diffusing capacity of the lungs for carbon monoxide; FEV1 = forced expiratory volume in 1 s; CRP = C-reactive protein; Hb = Hemoglobin.
Table 2.
Univariate analysis of anesthesiological and surgical characteristics leading to risk factors for PPCs in patients undergoing pneumonectomy. The data are presented as the percentage of all patients and number of patients (n) or mean ± standard deviation. PPC = postoperative pulmonary complication; TIVA = total intravenous anesthesia; OLV = one lung-ventilation; FiO2 = fraction of inspired oxygen; PEEP = positive endexpiratoy pressure, PRBC = packed red blood cells, FFP = fresh frozen plasma.
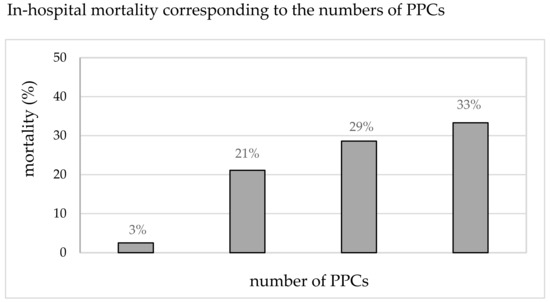
Figure 3.
In-hospital mortality (%) corresponding to the number of PPCs.
After the univariate analysis, preoperative factors, including a FEV1 < 50% (7/32 vs. 9/120, p < 0.001) or a recent (<4 weeks preoperatively) pulmonary infection with a FEV1 < 60% (3/32 vs. 4/120, p = 0.04), were significantly associated with the increased incidence of PPCs. Among the procedural factors, a longer incision to suture time (178 ± 68 vs. 221 ± 98 min, p < 0.006) was observed in patients with PPCs. Anesthesiological factors, such as a lower FiO2 during OLV (0.61 ± 0.11 vs. 0.69 ± 0.15, p = 0.015), a lower inspiratory pressure (20.4 ± 4.3 vs. 23.2 ± 3.9 mbar, p = 0.036), and a lower driving pressure during OLV (14.1 ± 4.2 vs. 17.1 ± 3.9 mbar, p = 0.03) were associated with a lower rate of PPCs.
Postoperative differences between patients with and without PPCs are shown in Table 3. Continued postoperative mechanical ventilation was more frequent (6/32 vs. 7/120, p = 0.03) and of longer duration (2.6 ± 8 vs. 140 ± 223 h, p < 0.001), as were ICU (1.94 ± 1.4 vs. 10.5 ± 12.5 days, p < 0.001), and hospital stays (10.8 + 5 vs. 21.4 + 19.8 days, p < 0.001) in patients with PPCs. Patients with PPCs had significantly more medical (15/32 vs. 14/120, p < 0.001) and surgical (13/32 vs. 15/120, p = 0.003) complications during the postoperative period.
Table 3.
Univariate comparison of postoperative parameters in patients with and without postoperative pulmonary complications undergoing pneumonectomy. The data are presented as percentage and the number of (n) or mean ± standard deviation. PPC = postoperative pulmonary complication; ICU = intensive care unit; HDU = high dependency unit; SAPS = simplified acute physiology score; FiO2 = fraction of inspired oxygen; PEEP = positive endexpiratory pressure.
The multivariate, stepwise logistic regression analysis demonstrated a preoperative FEV1 < 50% (OR 9.1, 95% CI 1.9–67), medical complications (OR 7.4, 95% CI 2.7–16.2), and an ICU stay of more than 2 days (OR 14, 95% 3.9–59) to be independent factors associated with the incidence of PPCs (Figure 4).
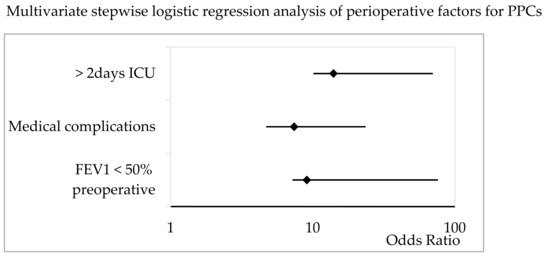
Figure 4.
Multivariate stepwise logistic regression analysis of patient-specific, procedural, and postoperative factors for PPCs in patients undergoing pneumonectomy. The Odds Ratio and 95% CI are shown. ICU = intensive care unit; FEV1 = forced expiratory volume in 1 s.
Table 4 presents the results from the univariate analysis of patient-related and preoperative risk factors for in-hospital mortality: a respiratory infection within 4 weeks before the operation (4/11 vs. 18/141, p = 0.04), a lower preoperative FEV1 (58 ± 25.4 vs. 73 ± 20% predicted, p = 0.037), and a FEV1 < 60%, combined with a previous pulmonary infection (4/11 vs. 4/141, p < 0.001). Furthermore, higher percentages of neoadjuvant radiation (4/11 vs. 6/141, p = 0.005) and chemotherapy (5/11 vs. 16/141, p = 0.02) were identified in non-survivors.
Table 4.
Univariate analysis of patient and preoperative characteristics leading to risk factors for in-hospital death in patients undergoing pneumonectomy. The data are presented as percentage and the number of patients (n) or mean ± standard deviation. MC = medical complication; BMI = body mass index; ASA PS = American Society of Anesthesiologists Physical Status; FEV1 = forced expiratory volume in 1 s (preoperative, % predicted); DLCO = diffusing capacity of the lungs for carbon monoxide (preoperative % predicted); CRP = C-reactive protein; Hb = Hemoglobin.
Table 5 presents the differences in anesthesiologic and surgical factors. An OLV duration > 180 min in both patients with a predicted DLCO < 60% (3/11 vs. 9/141, p = 0.04), and a predicted FEV1 < 60% (3/11 vs. 9/141, p = 0.04), an increased intraoperative crystalloid infusion (3537 ± 2925 vs. 2406 ± 1304 mL, p = 0.015), higher blood loss (2059 ± 2493 vs. 631 ± 545 mL, p < 0.001), and a higher transfusion rate were observed in non-survivors. The duration of surgery (221 ± 98 vs. 178 ± 68 min, p = 0.006), the duration of the presence of the chest tube (14.5 ± 12 vs. 2.2 ± 3.5 d, p < 0.001), and the frequency of re-operations (4/11 vs. 14/141, p = 0.027) varied significantly between non-survivors and survivors.
Table 5.
Univariate analysis of anesthesiologic and surgical data leading to risk factors for in-hospital mortality in patients undergoing pneumonectomy. The data are presented as percentage and the number of patients (n) or mean ± standard deviation. MC = medical complication; TIVA = total intravenous anesthesia; OLV = one lung-ventilation; FiO2 = fraction of inspired oxygen; PEEP = positive endexspiratory pressure, PRBC = packed red blood cells, FFP = fresh frozen plasma; BSI = bronchial stump insufficiency.
Postoperative differences are shown in Table 6. Additional data is provided in the Appendix A covering medical complications (Table A1, Table A2, Table A3, Table A4, Table A5 and Table A6). Non-survivors had longer ICU (16.8 ± 22 vs. 3.6 ± 6 days, p > 0.001) and hospital (21.4 ± 19.8 vs. 10.8 ± 5 days, p < 0.001) stays, as well as higher rates (4/11 vs. 9/141, p = 0.008) and longer durations of postoperative ventilation (302 ± 467 vs. 28 ± 105 h, p < 0.001). Non-survivors exhibited significantly more postoperative complications, including PPCs (8/11 vs. 24/141, p < 0.001), medical complications (6/11 vs. 23/141, p < 0.001), and surgical complications (6/11 vs. 25/141, p = 0.01). The multivariate, stepwise logistic regression analysis identified a preoperative FEV1 < 60% predicted in patients with a preoperative pulmonary infection (OR 21, 95% CI 4.2–103, p = 0.036), the incidence of PPCs (OR 13, 95% CI 3.2–52, p = 0.005), and continued mechanical ventilation postoperatively (OR 8.4, 95% CI 2–34, p < 0.001) as risk factors for in-hospital mortality (Figure 5).
Table 6.
Univariate analysis of patient and preoperative characteristics leading to risk factors for in-hospital death in patients undergoing pneumonectomy. The data are presented as percentage and the number of patients (n) or mean ± standard deviation. ICU = intensive care unit; HDU = high dependency unit; SAPS = simplified acute physiology score; PPC = postoperative pulmonary complications.
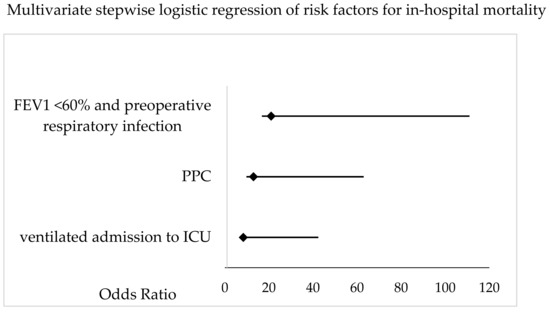
Figure 5.
Multivariate stepwise logistic regression analysis of patient-specific, procedural and postoperative factors for postoperative, in-hospital mortality in patients undergoing pneumonectomy. The Odds Ratio and 95% CI are shown. FEV1 = forced expiratory volume in 1 s; PPC = postoperative pulmonary complication; ICU = intensive care unit.
4. Discussion
The results of this retrospective study of 152 patients undergoing pneumonectomy presents the latest data from a multicenter database, the German Thoracic registry, with an observed 21% incidence of PPCs and an associated mean mortality of 25% in the PPC group (compared to 3% in the non-PPC group). In this cohort, in order to identify high-risk patients, our definition of PPC included severe respiratory complications, which might explain the varying incidence and effects reported from other studies [4,9,10,11]. The results of our study revealed the following factors to be independently associated with PPCs, according to the multivariate analysis: a predicted preoperative FEV1 < 50%, an ICU stay of more than 2 days, and the occurrence of severe medical complications during the stay.
The impact of impaired lung function, particularly in patients with chronic obstructive pulmonary disease (COPD), on lung resection surgery is well documented [12,13], although spirometric values do not necessarily correspond to the postoperative residual values. The general debate regarding the limits of functional operability is ongoing and fueled by the heralding of minimally invasive surgery [14], which is usually not the standard approach for pneumonectomy. We could identify an increased risk for PPCs and in-hospital mortality in marginal patients, as well as significant mortality differences for the mean FEV1 and DLCO values. On a purely mathematical basis, patients with a predicted preoperative FEV1 < 50% have a 44% chance of experiencing PPCs and of not being discharged alive. Despite the discussed limitations [15], spirometric parameters can predict postoperative complications after pneumonectomy, either by identifying marginal patients or in a multimodality setting [16,17], triggering intensified perioperative respiratory care for these patients.
The primary postoperative care in the ICU or HDU is influenced by the individual structure and capacity of each hospital [18]. Therefore, in a multicenter study, the location of postoperative care may vary. The prolonged need for ICU care in the PPC group itself does imply a higher (co)incidence of complications, but not a causal relationship [19]. The increased rate might be due to preoperative factors not completely available from our data but may also result from a complicative intraoperative course, resulting in an impaired recovery and increased susceptibility to further complications, which is confirmed by our, and other, data [20].
The link between PPCs and medical complications (see Appendix A) might also indicate an interrelationship, e.g., new onset atrial fibrillation inducing cardiac congestion can result in respiratory failure or could be induced by the septic sequelae of postoperative pneumonia. No further discrimination, either in a causal or timely respect, is possible from this registry data.
No independent anesthesiologic factors could be identified. After the univariate analysis, higher intraoperative FiO2, driving pressure, and average inspiratory pressure during OLV were observed in patients with PPCs. Whether more invasive ventilatory settings and higher intraoperative oxygen demand reflect the effects of preexisting structural lung disease [21], or whether it may contribute to ventilator-induced injury, remains unclear in our study and would require further investigation considering the complexity of ventilator-induced injury in thoracic surgery [22,23]. If invasive ventilation remains, despite trials of optimization, it could identify patients at risk and trigger necessary perioperative measures, such as admission to intensive care, or intensified chest and general physiotherapy.
No significant differences were found between the regional anesthetic techniques in terms of their use, specifically in regards to continuous epidural or paravertebral anesthesia. While older studies report a benefit of epidural anesthesia, more recent data report equivocal effects or even increased complications in patients undergoing epidural anesthesia (compared to paravertebral techniques) [24]. A total of 72% of all patients received continuous neuraxial anesthesia. Among them, 88% were classified as ASA 3 or higher (vs. 71% in the single shot group, p = 0.025), and the duration of surgery (194 ± 78 vs. 166 ± 75 min, p = 0.04) was significantly longer, both representing relevant risk factors [25,26]. Considering the widespread use of neuraxial techniques in general, and their even more frequent use in diseased patients, an undetected (selection) bias cannot be excluded. Neuraxial anesthesia remains a trusted technique to provide optimized analgesia and effective, adapted, and multimodal analgesic techniques represents a mainstay of patient-centered anesthesia care.
Pulmonary hyperperfusion and fluid overload have been shown to be causative of PPCs in thoracic surgery and pneumonectomy patients [22,27,28]. The concept of restrictive fluid management in lung resection surgery is well established, although the thresholds are not clear, and postresection lung injury is not limited to the intraoperative fluid volume alone [29,30,31,32,33,34,35].
Considering the moderate rather than restrictive intraoperative net fluid balance, e.g., calculated for a patient with 80 kg body weight (mean operative duration x mean net balance) as 1257 mL (without PPC) vs. 1178 mL (with PPC) in both groups, no significant difference was found in our study. Fluid management remains an important topic in thoracic surgery, and goal directed management could be beneficial in avoiding hypo- and hypervolemia.
Surgical factors could not be identified as independent risk factors for PPCs. Patients with PPCs experienced significantly longer surgeries and higher rates of extensive resection involving the chest wall, as well as higher rates of reoperation, according to the univariate analysis, which is consistent with the results in the existing literature [26,34]. The underlying diagnosis did not result in any differences, but the small group of patients (22/152) undergoing surgery for issues other than bronchial carcinoma might not allow for further differentiation.
The independent risk factors for in-hospital death were as follows: incidence of PPCs, continuation of mechanical ventilation during the postoperative period, and the combination of a preoperative pulmonary infection (<4 weeks before surgery) and a preoperative FEV1 below 60% (Figure 5). Preoperative risk factors described in other studies, such as higher BMI, age, and ASA-scores, did not vary between the groups. Non-survivors exhibited higher rates of impaired lung function and neoadjuvant therapy in our study [35,36]. Intraoperative differences in non-survivors included higher blood loss, more allogenic transfusions, and a longer duration of surgery as indicators of more complicated surgery (together with the increased rate of reoperation and need for postoperative chest drain). In our study of 152 patients, the statistics are certainly influenced by the sample size, and these items reached a degree of significance only in the univariate analysis. Nevertheless, recognizing the clinical impact of these factors mentioned, i.e., prehabilitation and optimization of marginal patients, the prevention of hemorrhage, and optimized management, could contribute to better outcomes. As mentioned previously, the overall in-hospital mortality of patients with PPCs was 25%, regardless of the number of PPCs (Figure 3), compared to an in-hospital mortality of 2.5% in patients without PPCs. The overall in-hospital mortality in our study was 7.2%, which is within the range reported in recent studies [37,38]. In our study, 73% of the non-survivors exhibited at least one PPC, and the mortality correlated to the count of PPCs. Varying definitions exist within the general literature, also including minor complications, such as radiographic atelectasis, and those not necessarily related to primary perioperative pulmonary injury, such as pulmonary aspiration. The clinically based definitions chosen in our study identified high-risk patients and provided a correlation between the count of PPCs and the deleterious effects on mortality.
In our study, only one of seven patients ventilated for more than 48 h presented with no PPC or medical complications, whereas the remaining 6 (86%) had at least one PPC and at least one medical complication. The survival rate of patients who were extubated in the operation theater was 94%, and more than 30% of patients ventilated after the operation died during the hospital stay, a rate approaching the risk reported for unplanned reintubation [20]. As described in previous reports, continued mechanical ventilation itself may be associated with an increased risk of medical and pulmonary complications, which has been noted in other studies, although the rationale to continue postoperative ventilation is often based on several existing factors, including hypothermia, cardiorespiratory instability, or inadequate analgesia, but not all of these can be modified [33,34]. Determining the exact causal relationship between factors leading to and resulting from prolonged mechanical ventilation remains difficult, and our retrospective analysis can offer only statistic associations. Therefore, it would be reasonable to recognize the mechanisms and minimize the preceding sequelae, if modifiable, and to minimize the period of mechanical ventilation as much as possible rather than to avoid postoperative ventilation at any cost. In any case, prolonged postoperative ventilation identifies patients at risk, as described above.
Performing thoracic surgery, and especially pneumonectomy, in marginal patients with a recent pulmonary infection is a high-risk proposition [39]. Preoperative infectious processes, such as poststenotic pneumonia or necrotizing tumors, may further influence the postoperative course, but these are not completely modifiable. The inflammatory component, as shown by increased levels of C-reactive protein, suggest a role for an optimal perioperative conditioning of the patients, including intensified physiotherapy, pharmacological therapy, pulmonary hygiene, adequate antimicrobial therapy, and optimized intra- and postoperative management.
5. Limitations
The retrospective nature of our study might limit the conclusions drawn from our work. Only incomplete datasets were available for preoperative factors such as comorbidities and tumor staging, which were therefore excluded from the analysis, and preoperative risk factors, such as the Charlson Comorbidity Index, are not available. The multicenter nature of this study, with four different participating centers, might imply some bias due to variable perioperative management, although this might reflect only small differences in management in our daily clinical practice. The possible (clinical) correlation between the risk factors identified from our data might cast doubts in regards to the true “independence” of the factors, suggesting a more hierarchical significance. The relatively small number of patients in our cohort might influence the statistical effects of our results, and fewer identified modifiable risk factors might reduce the conclusions drawn from our study. However, considering the decreasing number of pneumonectomies performed due to the high morbidity and mortality, our study represents the most recent data obtained from a reasonably large cohort within a short period of time [2,10,38].
6. Conclusions
Despite the limitations mentioned above, our study allows us to draw important conclusions based on the many findings derived from pre-, intra- and postoperative parameters. The role of PPCs in this recent cohort of pneumonectomy patients becomes clear, considering the high morbidity and mortality of patients with PPCs compared with unaffected patients, implying a high medical and socioeconomic burden. The identification of the independent risk factors revealed a role of impaired pulmonary function parameters, the association between prolonged ICU stays, and the occurrence of medical complications. In-hospital mortality was increased in patients with a combination of a preoperative predicted FEV1 <60% and a recent pulmonary infection, postoperative ventilation, and PPCs. Additional factors reported from our data could further indicate an elevated perioperative risk, and the recognition of these factors during the preoperative selection, intraoperative management, and postoperative care should influence the perioperative risk stratification and management.
Considering the retrospective nature of our study, further investigations could shed light on the hypotheses raised in our study.
Supplementary Materials
The following supporting information can be downloaded at: https://www.mdpi.com/article/10.3390/jcm13010035/s1, Table S1: Strobe Document.
Author Contributions
Conceptualization, A.S. and T.L.; methodology, A.S.; software, A.S.; validation, T.L., W.B., N.F. and I.M.; formal analysis, A.S.; investigation, N.F.; data curation, A.S.; writing—original draft preparation, A.S. and T.L.; writing—review and editing, T.L.; visualization, A.S.; supervision, T.L.; project administration, T.L. All authors have read and agreed to the published version of the manuscript.
Funding
This research received no external funding. We acknowledge the support from the Open Access Publication Fund of the University of Freiburg.
Institutional Review Board Statement
This study was conducted in accordance with the Declaration of Helsinki and approved by the Ethical Committee of the University Witten/Herdecke (Approval No.: 64/2014).
Informed Consent Statement
Patient consent was waived due to the retrospective pseudonymized data.
Data Availability Statement
Data are contained within the article.
Conflicts of Interest
The authors declare no conflict of interest.
Appendix A
Table A1.
Univariate analysis of patient characteristics leading to risk factors for medical complications in patients undergoing pneumonectomy. The data are presented as the percentage of all patients and number (n) or mean ± standard deviation. MC = medical complication; BMI = body mass index; ASA PS = American Society of Anesthesiologists Physical Status.
| No MC 80% (n = 123) | MC 20% (n = 29) | p-Value | |
|---|---|---|---|
| Patient characteristics | |||
| Age (years) | 62.1 ± 10 | 63.8 ± 10 | 0.37 |
| Male | 75% (92) | 69% (20) | 0.56 |
| Female | 25% (31) | 31% (9) | 0.64 |
| BMI | 27 ± 4 | 28.4 ± 5.2 | 0.12 |
| BMI > 30 | 16% (20) | 34% (10) | 0.037 |
| ASA PS ≥ 3 | 81% (105) | 76% (22) | 0.26 |
| Active smoking | 52% (64) | 17% (5) | 0.77 |
| Cessated smoking | 46% (57) | 17% (5) | 0.09 |
| Never smoked | 11% (14) | 14% (4) | 0.31 |
| Respiratory infection < 4 weeks | 15% (18) | 14% (4) | 0.04 |
Table A2.
Univariate analysis of preoperative parameters leading to risk factors for medical complications in patients undergoing pneumonectomy. The data are presented as the percentage of all patients and number (n) or mean ± standard deviation. MC = medical complication; FEV1 = forced expiratory volume in 1 s (preoperative (%) predicted); DLCO = diffusing capacity of the lungs for carbon monoxide (preoperative (%) predicted); CRP = C-reactive protein; Hb = Hemoglobin.
| No MC 80% (n = 123) | MC 20% (n = 29) | p-Value | |
|---|---|---|---|
| Preoperative characteristics | |||
| FEV1 (% predicted) | 73.5 ± 20 | 62.4 ±18.6 | 0.037 |
| FEV1 < 50% predicted | 10% (12) | 21% (6) | 0.09 |
| DLCO (% predicted) | 74 ± 22.4 | 63.2 ± 20.7 | 0.04 |
| DLCO < 50% predicted | 11% (13) | 24% (7) | 0.04 |
| PaO2 (mmHg) preoperative | 73 ± 8.6 | 70 ± 9.4 | 0.12 |
| PaCO2 (mmHg) preoperative | 37 ± 3.2 | 37 ± 5.7 | 0.41 |
| CRP (mg/dL) | 58.3 ± 69 | 74.7 ± 106 | 0.4 |
| Hemoglobin (g/dL) | 12.4 ± 1.9 | 12.3 ± 2.1 | 0.81 |
| Hb < 10 g/dL | 11% (13) | 17% (5) | 0.34 |
| Leucocytes (104/dL) | 10.4 ± 4.4 | 10 ± 3.3 | 0.62 |
| Previous lung surgery | 6% (7) | 14% (4) | 0.21 |
| Previous radiation | 5% (6) | 14% (4) | 0.09 |
| Preoperative chemotherapy | 13% (16) | 17% (5) | 0.53 |
| No preoperative therapy | 44% (54) | 34% (10) | 0.29 |
Table A3.
Univariate analysis of anesthesiologic data leading to risk factors for medical complications in patients undergoing pneumonectomy. The data are presented as percentage and the number of patients (n) or mean ± standard deviation. MC = medical complication; TIVA = total intravenous anesthesia; OLV = one lung-ventilation; FiO2 = fraction of inspired oxygen; PEEP = positive endexpiratoy pressure, PRBC = packed red blood cells, FFP = fresh frozen plasma.
| No MC 80% (n = 123) | MC 20% (n = 29) | p-Value | |
|---|---|---|---|
| Anesthesiological characteristics | |||
| Volatile Anesthetics | 38% (47) | 34% (10) | 0.45 |
| TIVA | 84% (103) | 90% (26) | 0.57 |
| Epidural catheter | 69% (85) | 76% (22) | 0.65 |
| Paravertebral catheter | 3% (4) | 3% (1) | 1 |
| Continuous neuraxial anesthetic technique | 72% (88) | 76% (22) | 0.8 |
| Paravertebral single shot anesthesia | 7% (9) | 3% (1) | 0.68 |
| CPAP non-ventilated lung | 5% (6) | 0 | 0.34 |
| Intraoperative ventilatory settings during OLV | |||
| Mean inspiratory pressure (mbar) | 20.9 ± 4.2 | 21 ± 5.1 | 0.9 |
| PEEP (mbar) | 6 ± 1.6 | 5.8 ± 1.6 | 0.8 |
| Driving pressure (mbar) | 14.5 ± 4.1 | 15 ± 5.2 | 0.76 |
| Mean intraoperative FiO2 | 0.63 ± 0.11 | 0.65 ± 0.18 | 0.56 |
| Lowest intraoperative FiO2 | 0.55 ± 0.12 | 0.57 ± 0.16 | 0.8 |
| Recruitment maneuvres performed | 28% (34) | 24% (7) | 0.63 |
| Intraoperative fluid management | |||
| Crystalloid infusion (mL) | 2409 ± 1292 | 2822 ± 2147 | 0.52 |
| Crystalloid (mL/kg/h) | 12.4 ± 9.7 | 10.5 ± 6.1 | 0.5 |
| Colloid infusion (mL) | 220 ± 386 | 339 ± 829 | 0.61 |
| Urine output (mL) | 364 ± 433 | 420 ± 312 | 0.12 |
| Urine volume (mL/kg/h) | 1.3 ± 1.9 | 1.6 ± 1.5 | 0.09 |
| Blood loss (mL) | 663 ± 657 | 1087 ± 1636 | 0.38 |
| Blood loss > 1000 mL | 15% (19) | 28% (8) | 0.19 |
| Blood loss > 2000 mL | 2% (3) | 14% (4) | 0.032 |
| PRBC (mL) | 84 ± 261 | 414 ± 1320 | 0.017 |
| FFP (mL) | 37 ± 275 | 137 ± 387.5 | 0.16 |
| Platelet concentrate (mL) | 0 | 20 ± 32 | 0.03 |
Table A4.
Univariate analysis of surgical characteristics leading to risk factors for medical complications in patients undergoing pneumonectomy. The data are presented as percentage and the number of patients (n) or mean ± standard deviation. MC = medical complication.
Table A4.
Univariate analysis of surgical characteristics leading to risk factors for medical complications in patients undergoing pneumonectomy. The data are presented as percentage and the number of patients (n) or mean ± standard deviation. MC = medical complication.
| No MC 80% (n = 123) | MC 20% (n = 29) | p-Value | |
|---|---|---|---|
| Surgical characteristics | |||
| Emergency procedure | 7% (9) | 7% (2) | 1 |
| Operative duration (min) | 179 ± 68 | 216 ± 109 | 0.14 |
| Operative duration > 180 min | 46% (57) | 48% (14) | 1 |
| Operative duration > 300 min | 57% (8) | 21% (6) | 0.03 |
| Blood loss (mL) | 663 ± 657 | 1087 ± 1636 | 0.36 |
| Extended surgery | |||
| None | 35% (43) | 52% (15) | 0.14 |
| + Angioplasty | 7% (8) | 3% (1) | 1 |
| + Pericardial resection | 58% (71) | 45% (13) | 0.22 |
| + Chest wall resection | 6% (7) | 17% (5) | 0.006 |
| + Diaphragmatic resection | 3% (4) | 17% (5) | 0.013 |
| Re-Operation | 9% (11) | 24% (7) | 0.048 |
| Postoperative Drainage (d) | 1.9 ± 1.9 | 5.7 ± 9.4 | <0.001 |
| Postoperative transfusion | 5% (6) | 10% (3) | 0.37 |
Table A5.
Univariate analysis of postoperative characteristics leading to risk factors for medical complications in patients undergoing pneumonectomy. The data are presented as percentage and the number of patients (n) or mean ± standard deviation. MC = medical complications; ICU = intensive care unit; HDU = high dependency unit; SAPS = simplified acute physiology score; FiO2 = fraction of inspired oxygen; PEEP = positive endexpiratory pressure; PPC = postoperative pulmonary complications.
| No MC 90% (n = 123) | MC 20% (n = 29) | p-Value | |
|---|---|---|---|
| postoperative characteristics | |||
| Primary ICU admission | 40% (49) | 55% (16) | 0.15 |
| ICU stay (d) | 2.1 ± 1.6 | 12.3 ± 15 | <0.001 |
| SAPS on admission | 12.7 ± 4.5 (8) | 33.2 ± 7.1 (5) | 0.32 |
| >2 d ICU | 52% (12) | 38% (11) | 0.002 |
| >5 d ICU | 2% (3) | 21% (6) | 0.005 |
| Primary HDU admission | 57% (70) | 45% (13) | 0.3 |
| Postoperative hospital stay (d) | 11.8 ± 9.7 | 19.8 ± 13.5 | <0.001 |
| Ventilated admission to ICU | 5% (6) | 24% (7) | 0.003 |
| Ventilatory parameters in mechanically ventilated patients | |||
| Hours ventilated | 2.6 ± 8.1 | 194 ± 309 | 0.02 |
| Ventilated > 48 h | 1% (1) | 21% (6) | <0.001 |
| FiO2 | 0.41 ± 0.09 | 0.56 ± 0.21 | 0.22 |
| PEEP (mbar) | 6.5 ± 1.3 | 7 ± 1.4 | 0.87 |
| Average inspiratory pressure (mbar) | 18 ± 5.3 | 25.6 ± 2.5 | 0.08 |
| Respiratory rate (per min) | 14.6 ± 2.3 | 18.7 ± 4.4 | 0.21 |
| PaCO2 (mmHg) | 44.8 ± 6 | 44.7 ± 6.5 | 0.97 |
| PaO2 (mmHg) | 157 ± 96 | 139 ± 67 | 0.96 |
| Postoperative complications | |||
| PPC | 14% (17) | 52% (15) | 0.001 |
| Deceased | 4% (5) | 21% (6) | 0.007 |
| Number PPC | 0.2 ± 0.45 | 1.1 ± 1.27 | <0.001 |
| Surgical complications | 20% (25) | 21% (6) | 1 |
Table A6.
Results from the multivariate analysis identifying risk factors for medical complications in patients undergoing pneumonectomy. The Odds Ratio (OR) and the 95% confidence interval (CI) are shown. ICU = Intensive care unit; PPC = postoperative pulmonary complication.
Table A6.
Results from the multivariate analysis identifying risk factors for medical complications in patients undergoing pneumonectomy. The Odds Ratio (OR) and the 95% confidence interval (CI) are shown. ICU = Intensive care unit; PPC = postoperative pulmonary complication.
| Risk Factors for Medical Complications | |||
|---|---|---|---|
| p-Value | OR | 95% CI | |
| admitted to the ICU ventilated | 0.028 | 4.4 | 1.2–17 |
| PPC | <0.001 | 5.5 | 2.1–14.7 |
References
- Kesler, K.A. Can we make pneumonectomy great again? J. Thorac. Cardiovasc. Surg. 2018, 156, 1704–1705. [Google Scholar] [CrossRef] [PubMed]
- Perentes, J.Y.; Zellweger, M.; Gonzalez, M. Is pneumonectomy still necessary? J. Thorac. Dis. 2018, 10, 6414. [Google Scholar] [CrossRef] [PubMed]
- Goldsmith, I.; Chesterfield-Thomas, G.; Toghill, H. Pre-treatment optimization with pulmonary rehabilitation in lung cancer: Making the inoperable patients operable. EClinicalMedicine 2021, 31, 100663. [Google Scholar] [CrossRef] [PubMed]
- Minervini, F.; Kocher, G.J.; Bertoglio, P.; Kestenholz, P.B.; Gálvez Muñoz, C.; Patrini, D.; Ceulemans, L.J.; Begum, H.; Lutz, J.; Shojai, M.; et al. Pneumonectomy for lung cancer in the elderly: Lessons learned from a multicenter study. J. Thorac. Dis. 2021, 13, 5835–5842. [Google Scholar] [CrossRef] [PubMed]
- Pricopi, C.; Mordant, P.; Rivera, C.; Arame, A.; Foucault, C.; Dujon, A.; Barthes, F.L.P.; Riquet, M. Postoperative morbidity and mortality after pneumonectomy: A 30-year experience of 2064 consecutive patients. Interact. Cardiovasc. Thorac. Surg. 2015, 20, 316–321. [Google Scholar] [CrossRef] [PubMed]
- Vandenbroucke, J.P.; von Elm, E.; Altman, D.G.; Gøtzsche, P.C.; Mulrow, C.D.; Pocock, S.J.; Poole, C.; Schlesselman, J.J.; Egger, M. Strengthening the Reporting of Observational Studies in Epidemiology (STROBE): Explanation and elaboration. Int. J. Surg. 2014, 12, 1500–1524. [Google Scholar] [CrossRef] [PubMed]
- ARDS Definition Task Force; Ranieri, V.M.; Rubenfeld, G.D.; Thompson, B.T.; Ferguson, N.D.; Caldwell, E.; Fan, E.; Camporota, L.; Slutsky, A.S. Acute respiratory distress syndrome: The Berlin Definition. JAMA 2012, 307, 2526–2533. [Google Scholar]
- Jammer, I.; Wickboldt, N.; Sander, M.; Smith, A.; Schultz, M.J.; Pelosi, P.; Leva, P.; Rhodes, A.; Hoeft, A.; Walder, B. Standards for definitions and use of outcome measures for clinical effectiveness research in perioperative medicine: European Perioperative Clinical Outcome (EPCO) definitions: A statement from the ESA-ESICM joint taskforce on perioperative outcome measures. Eur. J. Anaesthesiol. 2015, 32, 88–105. [Google Scholar]
- Yun, J.; Choi, Y.S.; Hong, T.H.; Kim, M.S.; Shin, S.; Cho, J.H.; Kim, H.K.; Kim, J.; Zo, J.I.; Shim, Y.M. Nononcologic Mortality after Pneumonectomy Compared to Lobectomy. Semin. Thorac. Cardiovasc. Surg. 2022, 34, 1122–1131. [Google Scholar] [CrossRef]
- Matsuo, T.; Imai, K.; Takashima, S.; Kurihara, N.; Kuriyama, S.; Iwai, H.; Tozawa, K.; Saito, H.; Nomura, K.; Minamiya, Y. Outcomes and pulmonary function after sleeve lobectomy compared with pneumonectomy in patients with non-small cell lung cancer. Thorac. Cancer 2023, 14, 827–833. [Google Scholar] [CrossRef]
- Algar, F.J.; Alvarez, A.; Salvatierra, A.; Baamonde, C.; Aranda, J.L.; López-Pujol, F.J. Predicting pulmonary complications after pneumonectomy for lung cancer. Eur. J. Cardiothorac. Surg. 2003, 23, 201–208. [Google Scholar] [CrossRef] [PubMed]
- Zhang, R.; Lee, S.M.; Wigfield, C.; Vigneswaran, W.T.; Ferguson, M.K. Lung Function Predicts Pulmonary Complications Regardless of the Surgical Approach. Ann. Thorac. Surg. 2015, 99, 1761–1767. [Google Scholar] [CrossRef] [PubMed]
- Kachare, S.; Dexter, E.U.; Nwogu, C.; Demmy, T.L.; Yendamuri, S. Perioperative outcomes of thoracoscopic anatomic resections in patients with limited pulmonary reserve. J. Thorac. Cardiovasc. Surg. 2011, 141, 459–462. [Google Scholar] [CrossRef] [PubMed]
- Falcoz, P.E.; Olland, A.; Charloux, A. Does functional evaluation before lung cancer surgery need reappraisal? Eur. J. Cardiothorac. Surg. 2021, 60, 3–6. [Google Scholar] [CrossRef] [PubMed]
- Fan, Z.; Zhao, S.; Wang, L.; Li, F.; Wang, J.; Gu, C. Comparison between functional lung volume measurement and segment counting for predicting postoperative pulmonary function after pulmonary resection in lung cancer patients. BMC Pulm. Med. 2023, 23, 6. [Google Scholar] [CrossRef]
- Wang, C.; Wang, S.; Li, Z.; He, W. A Multiple-Center Nomogram to Predict Pneumonectomy Complication Risk for Non-Small Cell Lung Cancer Patients. Ann. Surg. Oncol. 2022, 29, 561–569. [Google Scholar] [CrossRef]
- Boujibar, F.; Gillibert, A.; Gravier, F.E.; Gillot, T.; Bonnevie, T.; Cuvelier, A.; Baste, J.-M. Performance at stair-climbing test is associated with postoperative complications after lung resection: A systematic review and meta-analysis. Thorax 2020, 75, 791–797. [Google Scholar] [CrossRef]
- Pinheiro, L.; Santoro, I.L.; Faresin, S.M. Who Needs to Be Allocated in ICU after Thoracic Surgery? An Observational Study. Can. Respir. J. 2016, 2016, 3981506. [Google Scholar] [CrossRef]
- Brunelli, A.; Ferguson, M.K.; Rocco, G.; Pieretti, P.; Vigneswaran, W.T.; Morgan-Hughes, N.J.; Zanello, M.; Salati, M. A Scoring System Predicting the Risk for Intensive Care Unit Admission for Complications After Major Lung Resection: A Multicenter Analysis. Ann. Thorac. Surg. 2008, 86, 213–218. [Google Scholar] [CrossRef]
- Kim, S.H.; Na, S.; Park, S.Y.; Lee, J.; Kang, Y.S.; Jung, H.-H.; Kim, J. Perioperative Factors for Predicting the Need for Postoperative Intensive Care after Major Lung Resection. J. Clin. Med. 2019, 8, 744. [Google Scholar] [CrossRef]
- Licker, M.; Spiliopoulos, A.; Frey, J.G.; Robert, J.; Höhn, L.; de Perrot, M.; Tschopp, J.-M. Risk factors for early mortality and major complications following pneumonectomy for non-small cell carcinoma of the lung. Chest 2002, 121, 1890–1897. [Google Scholar] [CrossRef] [PubMed]
- Gama de Abreu, M.; Sessler, D.I. Mechanical Power: Correlate or Cause of Ventilator-induced Lung Injury? Anesthesiology 2022, 137, 6–8. [Google Scholar] [CrossRef] [PubMed]
- Young, C.C.; Harris, E.M.; Vacchiano, C.; Bodnar, S.; Bukowy, B.; Elliott, R.R.D.; Migliarese, J.; Ragains, C.; Trethewey, B.; Woodward, A.; et al. Lung-protective ventilation for the surgical patient: International expert panel-based consensus recommendations. Br. J. Anaesth. 2019, 123, 898–913. [Google Scholar] [CrossRef] [PubMed]
- Powell, E.S.; Cook, D.; Pearce, A.C.; Davies, P.; Bowler, G.M.R.; Naidu, B.; Gao, F. A prospective, multicentre, observational cohort study of analgesia and outcome after pneumonectomy. Br. J. Anaesth. 2011, 106, 364–370. [Google Scholar] [CrossRef] [PubMed]
- Powell, E.S.; Pearce, A.C.; Cook, D.; Davies, P.; Bishay, E.; Bowler, G.M.; Gao, F. UK pneumonectomy outcome study (UKPOS): A prospective observational study of pneumonectomy outcome. J. Cardiothorac. Surg. 2009, 4, 41. [Google Scholar] [CrossRef] [PubMed]
- Blanc, K.; Zaimi, R.; Dechartres, A.; Lefebvre, A.; Janet-Vendroux, A.; Hamelin-Canny, E.; Roche, N.; Alifano, M.; Rabbat, A. Early acute respiratory distress syndrome after pneumonectomy: Presentation, management, and short- and long-term outcomes. J. Thorac. Cardiovasc. Surg. 2018, 156, 1706–1714.e5. [Google Scholar] [CrossRef]
- Fernández-Pérez, E.R.; Keegan, M.T.; Brown, D.R.; Hubmayr, R.D.; Gajic, O. Intraoperative tidal volume as a risk factor for respiratory failure after pneumonectomy. Anesthesiology 2006, 105, 14–18. [Google Scholar] [CrossRef]
- Evans, R.G.; Naidu, B. Does a conservative fluid management strategy in the perioperative management of lung resection patients reduce the risk of acute lung injury? Interact. Cardiovasc. Thorac. Surg. 2012, 15, 498–504. [Google Scholar] [CrossRef]
- Jeon, K.; Yoon, J.W.; Suh, G.Y.; Kim, J.; Kim, K.; Yang, M.; Kim, H.; Kwon, O.J.; Shims, Y.M. Risk Factors for Post-pneumonectomy Acute Lung Injury/Acute Respiratory Distress Syndrome in Primary Lung Cancer Patients. Anaesth. Intensive Care 2009, 37, 14–19. [Google Scholar] [CrossRef]
- Licker, M.; de Perrot, M.; Spiliopoulos, A.; Robert, J.; Diaper, J.; Chevalley, C.; Tschopp, J.-M. Risk Factors for Acute Lung Injury After Thoracic Surgery for Lung Cancer. Anesth. Analg. 2003, 97, 1558. [Google Scholar] [CrossRef]
- Arslantas, M.K.; Kara, H.V.; Tuncer, B.B.; Yildizeli, B.; Yuksel, M.; Bostanci, K.; Bekiroglu, N.; Kararmaz, A.; Cinel, I.; Batirel, H.F. Effect of the amount of intraoperative fluid administration on postoperative pulmonary complications following anatomic lung resections. J. Thorac. Cardiovasc. Surg. 2015, 149, 314–321.e1. [Google Scholar] [CrossRef] [PubMed]
- Batirel, H.F. Fluid administration during lung resection: What is the optimum? J. Thorac. Dis. 2019, 11, 1746–1748. [Google Scholar] [CrossRef] [PubMed]
- Sato, Y. How should we decide the optimum intraoperative fluid and colloid usage in pulmonary resection? J. Thorac. Dis. 2019, 11, E204–E205. [Google Scholar] [CrossRef] [PubMed]
- Marret, E.; Miled, F.; Bazelly, B.; El Metaoua, S.; de Montblanc, J.; Quesnel, C.; Fulgencio, J.-P.; Bonnet, F. Risk and protective factors for major complications after pneumonectomy for lung cancer. Interact. Cardiovasc. Thorac. Surg. 2010, 10, 936–939. [Google Scholar] [CrossRef] [PubMed]
- Blank, R.S.; Hucklenbruch, C.; Gurka, K.K.; Scalzo, D.C.; Wang, X.Q.; Jones, D.R.; Tanner, S.R.; Jaeger, J.M. Intraoperative factors and the risk of respiratory complications after pneumonectomy. Ann. Thorac. Surg. 2011, 92, 1188–1194. [Google Scholar] [CrossRef] [PubMed]
- Thomas, P.A.; Berbis, J.; Baste, J.M.; Le Pimpec-Barthes, F.; Tronc, F.; Falcoz, P.E.; Dahan, M.; Loundou, A. Pneumonectomy for lung cancer: Contemporary national early morbidity and mortality outcomes. J. Thorac. Cardiovasc. Surg. 2015, 149, 73–83. [Google Scholar] [CrossRef] [PubMed]
- Boffa, D.; Fernandez, F.G.; Kim, S.; Kosinski, A.; Onaitis, M.W.; Cowper, P.; Jacobs, J.P.; Wright, C.D.; Putnam, J.B.; Furnary, A.P. Surgically Managed Clinical Stage IIIA–Clinical N2 Lung Cancer in The Society of Thoracic Surgeons Database. Ann. Thorac. Surg. 2017, 104, 395–403. [Google Scholar] [CrossRef]
- Chataigner, O.; Fadel, E.; Yildizeli, B.; Achir, A.; Mussot, S.; Fabre, D.; Mercier, O.; Dartevelle, P.G. Factors affecting early and long-term outcomes after completion pneumonectomy. Eur. J. Cardiothorac. Surg. 2008, 33, 837–843. [Google Scholar] [CrossRef]
- Luo, D.; Cheng, K.; Yuan, M.; Xu, C.; He, T.; Jia, R.; Dai, S.; Liu, C. Previous pulmonary infection impacts thoracoscopic procedure outcomes in patients with congenital lung malformations: A retrospective cohort study. Respir. Res. 2023, 24, 115. [Google Scholar] [CrossRef]
Disclaimer/Publisher’s Note: The statements, opinions and data contained in all publications are solely those of the individual author(s) and contributor(s) and not of MDPI and/or the editor(s). MDPI and/or the editor(s) disclaim responsibility for any injury to people or property resulting from any ideas, methods, instructions or products referred to in the content. |
© 2023 by the authors. Licensee MDPI, Basel, Switzerland. This article is an open access article distributed under the terms and conditions of the Creative Commons Attribution (CC BY) license (https://creativecommons.org/licenses/by/4.0/).