


Tumor Immune Microenvironment Heterogeneity at the Invasion Front and Tumor Center in Oral Squamous Cell Carcinoma as a Perspective of Managing This Cancer Entity
 ,
,  ,
,  and
and
Abstract
1. Introduction
2. Materials and Methods
2.1. Patients and Tissue Samples
2.2. Histopathological Analysis
2.3. Statistical Analysis
3. Results
4. Discussion
5. Conclusions
Supplementary Materials
Author Contributions
Funding
Institutional Review Board Statement
Informed Consent Statement
Data Availability Statement
Conflicts of Interest
Abbreviations
References
- Chamoli, A.; Gosavi, A.S.; Shirwadkar, U.P.; Wangdale, K.V.; Behera, S.K.; Kurrey, N.K.; Kalia, K.; Mandoli, A. Overview of Oral Cavity Squamous Cell Carcinoma: Risk Factors, Mechanisms, and Diagnostics. Oral Oncol. 2021, 121, 105451. [Google Scholar] [CrossRef] [PubMed]
- Sung, H.; Ferlay, J.; Siegel, R.L.; Laversanne, M.; Soerjomataram, I.; Jemal, A.; Bray, F. Global Cancer Statistics 2020: GLOBOCAN Estimates of Incidence and Mortality Worldwide for 36 Cancers in 185 Countries. CA Cancer J. Clin. 2021, 71, 209–249. [Google Scholar] [CrossRef] [PubMed]
- Chi, A.C.; Day, T.A.; Neville, B.W. Oral Cavity and Oropharyngeal Squamous Cell Carcinoma--an Update. CA Cancer J. Clin. 2015, 65, 401–421. [Google Scholar] [CrossRef] [PubMed]
- Amit, M.; Yen, T.-C.; Liao, C.-T.; Chaturvedi, P.; Agarwal, J.P.; Kowalski, L.P.; Ebrahimi, A.; Clark, J.R.; Kreppel, M.; Zöller, J.; et al. Improvement in Survival of Patients with Oral Cavity Squamous Cell Carcinoma: An International Collaborative Study. Cancer 2013, 119, 4242–4248. [Google Scholar] [CrossRef] [PubMed]
- Cancer of the Oral Cavity and Pharynx—Cancer Stat Facts. Available online: https://seer.cancer.gov/statfacts/html/oralcav.html (accessed on 20 November 2022).
- Bauml, J.M.; Aggarwal, C.; Cohen, R.B. Immunotherapy for Head and Neck Cancer: Where Are We Now and Where Are We Going? Ann. Transl. Med. 2019, 7, S75. [Google Scholar] [CrossRef]
- Chew, V.; Toh, H.C.; Abastado, J.-P. Immune Microenvironment in Tumor Progression: Characteristics and Challenges for Therapy. J. Oncol. 2012, 2012, 608406. [Google Scholar] [CrossRef]
- Kalogirou, E.M.; Tosios, K.I.; Christopoulos, P.F. The Role of Macrophages in Oral Squamous Cell Carcinoma. Front. Oncol. 2021, 11, 611115. [Google Scholar] [CrossRef]
- Murray, P.J.; Allen, J.E.; Biswas, S.K.; Fisher, E.A.; Gilroy, D.W.; Goerdt, S.; Gordon, S.; Hamilton, J.A.; Ivashkiv, L.B.; Lawrence, T.; et al. Macrophage Activation and Polarization: Nomenclature and Experimental Guidelines. Immunity 2014, 41, 14–20. [Google Scholar] [CrossRef]
- Shigeoka, M.; Koma, Y.-I.; Nishio, M.; Akashi, M.; Yokozaki, H. Alteration of Macrophage Infiltrating Compartment: A Novel View on Oral Carcinogenesis. Pathobiology 2021, 88, 327–337. [Google Scholar] [CrossRef]
- Corliss, B.A.; Azimi, M.S.; Munson, J.M.; Peirce, S.M.; Murfee, W.L. Macrophages: An Inflammatory Link Between Angiogenesis and Lymphangiogenesis. Microcirculation 2016, 23, 95–121. [Google Scholar] [CrossRef]
- Nguyen, N.; Bellile, E.; Thomas, D.; McHugh, J.; Rozek, L.; Virani, S.; Peterson, L.; Carey, T.E.; Walline, H.; Moyer, J.; et al. Tumor Infiltrating Lymphocytes and Survival in Patients with Head and Neck Squamous Cell Carcinoma. Head Neck 2016, 38, 1074–1084. [Google Scholar] [CrossRef] [PubMed]
- Zhou, C.; Wu, Y.; Jiang, L.; Li, Z.; Diao, P.; Wang, D.; Zhang, W.; Liu, L.; Wang, Y.; Jiang, H.; et al. Density and Location of CD3+ and CD8+ Tumor-Infiltrating Lymphocytes Correlate with Prognosis of Oral Squamous Cell Carcinoma. J. Oral Pathol. Med. 2018, 47, 359–367. [Google Scholar] [CrossRef] [PubMed]
- Li, F.; Li, C.; Cai, X.; Xie, Z.; Zhou, L.; Cheng, B.; Zhong, R.; Xiong, S.; Li, J.; Chen, Z.; et al. The Association between CD8+ Tumor-Infiltrating Lymphocytes and the Clinical Outcome of Cancer Immunotherapy: A Systematic Review and Meta-Analysis. EClinicalMedicine 2021, 41, 101134. [Google Scholar] [CrossRef] [PubMed]
- Baghban, R.; Roshangar, L.; Jahanban-Esfahlan, R.; Seidi, K.; Ebrahimi-Kalan, A.; Jaymand, M.; Kolahian, S.; Javaheri, T.; Zare, P. Tumor Microenvironment Complexity and Therapeutic Implications at a Glance. Cell Commun. Signal. 2020, 18, 59. [Google Scholar] [CrossRef]
- Sobin, L.H.; Gospodarowicz, M.K.; Wittekind, C. TNM Classification of Malignant Tumours; John Wiley & Sons: Hoboken, NJ, USA, 2011; ISBN 9781444358964. [Google Scholar]
- Väyrynen, J.P.; Haruki, K.; Väyrynen, S.A.; Lau, M.C.; Dias Costa, A.; Borowsky, J.; Zhao, M.; Ugai, T.; Kishikawa, J.; Akimoto, N.; et al. Prognostic Significance of Myeloid Immune Cells and Their Spatial Distribution in the Colorectal Cancer Microenvironment. J. Immunother. Cancer 2021, 9, e002297. [Google Scholar] [CrossRef]
- Huang, Y.-K.; Wang, M.; Sun, Y.; Di Costanzo, N.; Mitchell, C.; Achuthan, A.; Hamilton, J.A.; Busuttil, R.A.; Boussioutas, A. Macrophage Spatial Heterogeneity in Gastric Cancer Defined by Multiplex Immunohistochemistry. Nat. Commun. 2019, 10, 3928. [Google Scholar] [CrossRef]
- Almangush, A.; Leivo, I.; Mäkitie, A.A. Overall Assessment of Tumor-Infiltrating Lymphocytes in Head and Neck Squamous Cell Carcinoma: Time to Take Notice. Acta Otolaryngol. 2020, 140, 246–248. [Google Scholar] [CrossRef]
- Biswas, S.K.; Mantovani, A. Macrophage Plasticity and Interaction with Lymphocyte Subsets: Cancer as a Paradigm. Nat. Immunol. 2010, 11, 889–896. [Google Scholar] [CrossRef]
- Paijens, S.T.; Vledder, A.; de Bruyn, M.; Nijman, H.W. Tumor-Infiltrating Lymphocytes in the Immunotherapy Era. Cell. Mol. Immunol. 2021, 18, 842–859. [Google Scholar] [CrossRef]
- Hendry, S.; Salgado, R.; Gevaert, T.; Russell, P.A.; John, T.; Thapa, B.; Christie, M.; van de Vijver, K.; Estrada, M.V.; Gonzalez-Ericsson, P.I.; et al. Assessing Tumor-Infiltrating Lymphocytes in Solid Tumors: A Practical Review for Pathologists and Proposal for a Standardized Method from the International Immuno-Oncology Biomarkers Working Group: Part 2: TILs in Melanoma, Gastrointestinal Tract Carcinomas, Non-Small Cell Lung Carcinoma and Mesothelioma, Endometrial and Ovarian Carcinomas, Squamous Cell Carcinoma of the Head and Neck, Genitourinary Carcinomas, and Primary Brain Tumors. Adv. Anat. Pathol. 2017, 24, 311–335. [Google Scholar]
- Chatzopoulos, K.; Kotoula, V.; Manoussou, K.; Markou, K.; Vlachtsis, K.; Angouridakis, N.; Nikolaou, A.; Vassilakopoulou, M.; Psyrri, A.; Fountzilas, G. Tumor Infiltrating Lymphocytes and CD8+ T Cell Subsets as Prognostic Markers in Patients with Surgically Treated Laryngeal Squamous Cell Carcinoma. Head Neck Pathol. 2020, 14, 689–700. [Google Scholar] [CrossRef]
- Prasetyo, A.; Budiman, J.; Sadhana, U. The Relationship between Tumor-Infiltrating Lymphocytes (TILs) and Nasopharyngeal Carcinoma (NPC): A Systematic Review. Iran J. Otorhinolaryngol. 2021, 33, 191–200. [Google Scholar]
- De Meulenaere, A.; Vermassen, T.; Aspeslagh, S.; Vandecasteele, K.; Rottey, S.; Ferdinande, L. TILs in Head and Neck Cancer: Ready for Clinical Implementation and Why (Not)? Head Neck Pathol. 2017, 11, 354–363. [Google Scholar] [CrossRef]
- Watanabe, Y.; Katou, F.; Ohtani, H.; Nakayama, T.; Yoshie, O.; Hashimoto, K. Tumor-Infiltrating Lymphocytes, Particularly the Balance between CD8(+) T Cells and CCR4(+) Regulatory T Cells, Affect the Survival of Patients with Oral Squamous Cell Carcinoma. Oral Surg. Oral Med. Oral Pathol. Oral Radiol. Endod. 2010, 109, 744–752. [Google Scholar] [CrossRef]
- Anitei, M.-G.; Zeitoun, G.; Mlecnik, B.; Marliot, F.; Haicheur, N.; Todosi, A.-M.; Kirilovsky, A.; Lagorce, C.; Bindea, G.; Ferariu, D.; et al. Prognostic and Predictive Values of the Immunoscore in Patients with Rectal Cancer. Clin. Cancer Res. 2014, 20, 1891–1899. [Google Scholar] [CrossRef] [PubMed]
- Rhee, I. Diverse Macrophages Polarization in Tumor Microenvironment. Arch. Pharm. Res. 2016, 39, 1588–1596. [Google Scholar] [CrossRef] [PubMed]
- Hori, Y.; Kubota, A.; Yokose, T.; Furukawa, M.; Matsushita, T.; Katsumata, N.; Oridate, N. Prognostic Role of Tumor-Infiltrating Lymphocytes and Tumor Budding in Early Oral Tongue Carcinoma. Laryngoscope 2021, 131, 2512–2518. [Google Scholar] [CrossRef] [PubMed]
- Spenlé, C.; Loustau, T.; Murdamoothoo, D.; Erne, W.; Beghelli-de la Forest Divonne, S.; Veber, R.; Petti, L.; Bourdely, P.; Mörgelin, M.; Brauchle, E.-M.; et al. Tenascin-C Orchestrates an Immune-Suppressive Tumor Microenvironment in Oral Squamous Cell Carcinoma. Cancer Immunol. Res. 2020, 8, 1122–1138. [Google Scholar] [CrossRef]
- Zheng, X.; Weigert, A.; Reu, S.; Guenther, S.; Mansouri, S.; Bassaly, B.; Gattenlöhner, S.; Grimminger, F.; Pullamsetti, S.; Seeger, W.; et al. Spatial Density and Distribution of Tumor-Associated Macrophages Predict Survival in Non-Small Cell Lung Carcinoma. Cancer Res. 2020, 80, 4414–4425. [Google Scholar] [CrossRef]
- Troiano, G.; Caponio, V.C.A.; Adipietro, I.; Tepedino, M.; Santoro, R.; Laino, L.; Lo Russo, L.; Cirillo, N.; Lo Muzio, L. Prognostic Significance of CD68+ and CD163+ Tumor Associated Macrophages in Head and Neck Squamous Cell Carcinoma: A Systematic Review and Meta-Analysis. Oral Oncol. 2019, 93, 66–75. [Google Scholar] [CrossRef]
- Wolf, G.T.; Chepeha, D.B.; Bellile, E.; Nguyen, A.; Thomas, D.; McHugh, J. University of Michigan Head and Neck SPORE Program Tumor Infiltrating Lymphocytes (TIL) and Prognosis in Oral Cavity Squamous Carcinoma: A Preliminary Study. Oral Oncol. 2015, 51, 90–95. [Google Scholar] [CrossRef]
- Hadler-Olsen, E.; Wirsing, A.M. Tissue-Infiltrating Immune Cells as Prognostic Markers in Oral Squamous Cell Carcinoma: A Systematic Review and Meta-Analysis. Br. J. Cancer 2019, 120, 714–727. [Google Scholar] [CrossRef]
- Fridman, W.H.; Pagès, F.; Sautès-Fridman, C.; Galon, J. The Immune Contexture in Human Tumours: Impact on Clinical Outcome. Nat. Rev. Cancer 2012, 12, 298–306. [Google Scholar] [CrossRef]
- Brochhausen, M.; Whorton, J.M.; Zayas, C.E.; Kimbrell, M.P.; Bost, S.J.; Singh, N.; Brochhausen, C.; Sexton, K.W.; Blobel, B. Assessing the Need for Semantic Data Integration for Surgical Biobanks-A Knowledge Representation Perspective. J. Pers. Med. 2022, 12, 757. [Google Scholar] [CrossRef]
- Merlano, M.C.; Denaro, N.; Galizia, D.; Ruatta, F.; Occelli, M.; Minei, S.; Abbona, A.; Paccagnella, M.; Ghidini, M.; Garrone, O. How Chemotherapy Affects the Tumor Immune Microenvironment: A Narrative Review. Biomedicines 2022, 10, 1822. [Google Scholar] [CrossRef]
- Herter, J.M.; Kiljan, M.; Kunze, S.; Reinscheid, M.; Ibruli, O.; Cai, J.; Niu, L.; Heßelmann, I.; Trommer, M.; Herter-Sprie, G.S.; et al. Influence of Chemoradiation on the Immune Microenvironment of Cervical Cancer Patients. Strahlenther. Onkol. 2022. [Google Scholar] [CrossRef] [PubMed]
- Gartrell, R.D.; Enzler, T.; Kim, P.S.; Fullerton, B.T.; Fazlollahi, L.; Chen, A.X.; Minns, H.E.; Perni, S.; Weisberg, S.P.; Rizk, E.M.; et al. Neoadjuvant Chemoradiation Alters the Immune Microenvironment in Pancreatic Ductal Adenocarcinoma. Oncoimmunology 2022, 11, 2066767. [Google Scholar] [CrossRef]
- Watermann, C.; Pasternack, H.; Idel, C.; Ribbat-Idel, J.; Brägelmann, J.; Kuppler, P.; Offermann, A.; Jonigk, D.; Kühnel, M.P.; Schröck, A.; et al. Recurrent HNSCC Harbor an Immunosuppressive Tumor Immune Microenvironment Suggesting Successful Tumor Immune Evasion. Clin. Cancer Res. 2021, 27, 632–644. [Google Scholar] [CrossRef]
- Burtness, B.; Harrington, K.J.; Greil, R.; Soulières, D.; Tahara, M.; de Castro, G., Jr.; Psyrri, A.; Basté, N.; Neupane, P.; Bratland, Å.; et al. Pembrolizumab Alone or with Chemotherapy versus Cetuximab with Chemotherapy for Recurrent or Metastatic Squamous Cell Carcinoma of the Head and Neck (KEYNOTE-048): A Randomised, Open-Label, Phase 3 Study. Lancet 2019, 394, 1915–1928. [Google Scholar] [CrossRef] [PubMed]
- Ferris, R.L.; Blumenschein, G., Jr.; Fayette, J.; Guigay, J.; Colevas, A.D.; Licitra, L.; Harrington, K.; Kasper, S.; Vokes, E.E.; Even, C.; et al. Nivolumab for Recurrent Squamous-Cell Carcinoma of the Head and Neck. N. Engl. J. Med. 2016, 375, 1856–1867. [Google Scholar] [CrossRef]
- Cohen, E.E.W.; Bell, R.B.; Bifulco, C.B.; Burtness, B.; Gillison, M.L.; Harrington, K.J.; Le, Q.-T.; Lee, N.Y.; Leidner, R.; Lewis, R.L.; et al. The Society for Immunotherapy of Cancer Consensus Statement on Immunotherapy for the Treatment of Squamous Cell Carcinoma of the Head and Neck (HNSCC). J. Immunother. Cancer 2019, 7, 184. [Google Scholar] [CrossRef] [PubMed]
- Tormoen, G.W.; Crittenden, M.R.; Gough, M.J. Role of the Immunosuppressive Microenvironment in Immunotherapy. Adv. Radiat. Oncol. 2018, 3, 520–526. [Google Scholar] [CrossRef] [PubMed]
- Blatt, S.; Krüger, M.; Rump, C.; Zimmer, S.; Sagheb, K.; Künzel, J. Differences in PD-L1 Expression between Oral and Oropharyngeal Squamous Cell Carcinoma. PLoS ONE 2022, 17, e0269136. [Google Scholar] [CrossRef] [PubMed]
- Hirshoren, N.; Al-Kharouf, I.; Weinberger, J.M.; Eliashar, R.; Popovtzer, A.; Knaanie, A.; Fellig, Y.; Neuman, T.; Meir, K.; Maly, A.; et al. Spatial Intratumoral Heterogeneity Expression of PD-L1 Antigen in Head and Neck Squamous Cell Carcinoma. Oncology 2021, 99, 464–470. [Google Scholar] [CrossRef] [PubMed]


| Total | ||
|---|---|---|
| Variables/Categories | n | (%) |
| Number of patients | 55 | (100.0%) |
| Age | ||
| ≥70 | 20 | (36.4%) |
| <70 | 35 | (63.6%) |
| Gender | ||
| male | 39 | (70.9%) |
| female | 16 | (29.1%) |
| Tumor spread (T-classification, UICC 7th edition) | ||
| T1 | 20 | (36.4%) |
| T2 | 15 | (27.3%) |
| T3 | 7 | (12.7%) |
| T4 | 13 | (23.6%) |
| Nodal metastasis | ||
| no | 30 | (54.5%) |
| yes | 25 | (45.5%) |
| Metastasis | ||
| unknown | 8 | (14.5%) |
| no spread | 40 | (72.7%) |
| any spread | 7 | (12.7%) |
| Tumor grade | ||
| 1 | 2 | (3.6%) |
| 2 | 44 | (80.0%) |
| 3 | 9 | (16.4%) |
| Stage | ||
| I | 15 | (27.3%) |
| II | 6 | (10.9%) |
| III | 11 | (20.0%) |
| IV | 23 | (41.8%) |
| Min | Max | Mean | SD | |
|---|---|---|---|---|
| CD4+ lymphocytes tumor center | 2.2 | 33.4 | 12.04 | 7.68 |
| CD4+ lymphocytes invasion front | 4.0 | 100.2 | 40.79 | 18.74 |
| CD8+ lymphocytes tumor center | 0.1 | 45.1 | 11,72 | 10.79 |
| CD8+ lymphocytes invasion front | 1.4 | 106.8 | 47.93 | 23.62 |
| CD68+ macrophages tumor center | 0.6 | 46.1 | 14.01 | 10.20 |
| CD68+ macrophages invasion front | 13.5 | 75.2 | 44.85 | 15.76 |
| CD163+ M2-macrophages tumor center | 0 | 23.8 | 7.65 | 6.72 |
| CD163+ M2-macrophages invasion front | 0 | 55.7 | 30.07 | 13.69 |
| M1-macrophages tumor center | 0 | 28.6 | 6.35 | 7.14 |
| M1-macrophages invasion front | 0.1 | 52.4 | 14.77 | 11.00 |
| t-Test | Correlation | |||
|---|---|---|---|---|
| n | p-Value | Rho | p-Value | |
| CD4+ lymphocytes tumor center and CD4+ lymphocytes invasion front | 55 | <0.001 | 0.384 | 0.004 |
| CD8+ lymphocytes tumor center and CD8+ lymphocytes invasion front | 55 | <0.001 | 0.659 | <0.001 |
| CD68+ macrophages tumor center and CD68+ macrophages invasion front | 55 | <0.001 | 0.502 | <0.001 |
| CD163+ M2-macrophages tumor center and CD163+ M2-macrophages invasion front | 55 | <0.001 | 0.583 | <0.001 |
| M1-macrophages tumor center and M1-macrophages invasion front | 55 | <0.001 | −0.066 | 0.633 |
| Variables/Levels | OS | |||
|---|---|---|---|---|
| n | HR | (95% CI) | p-Value | |
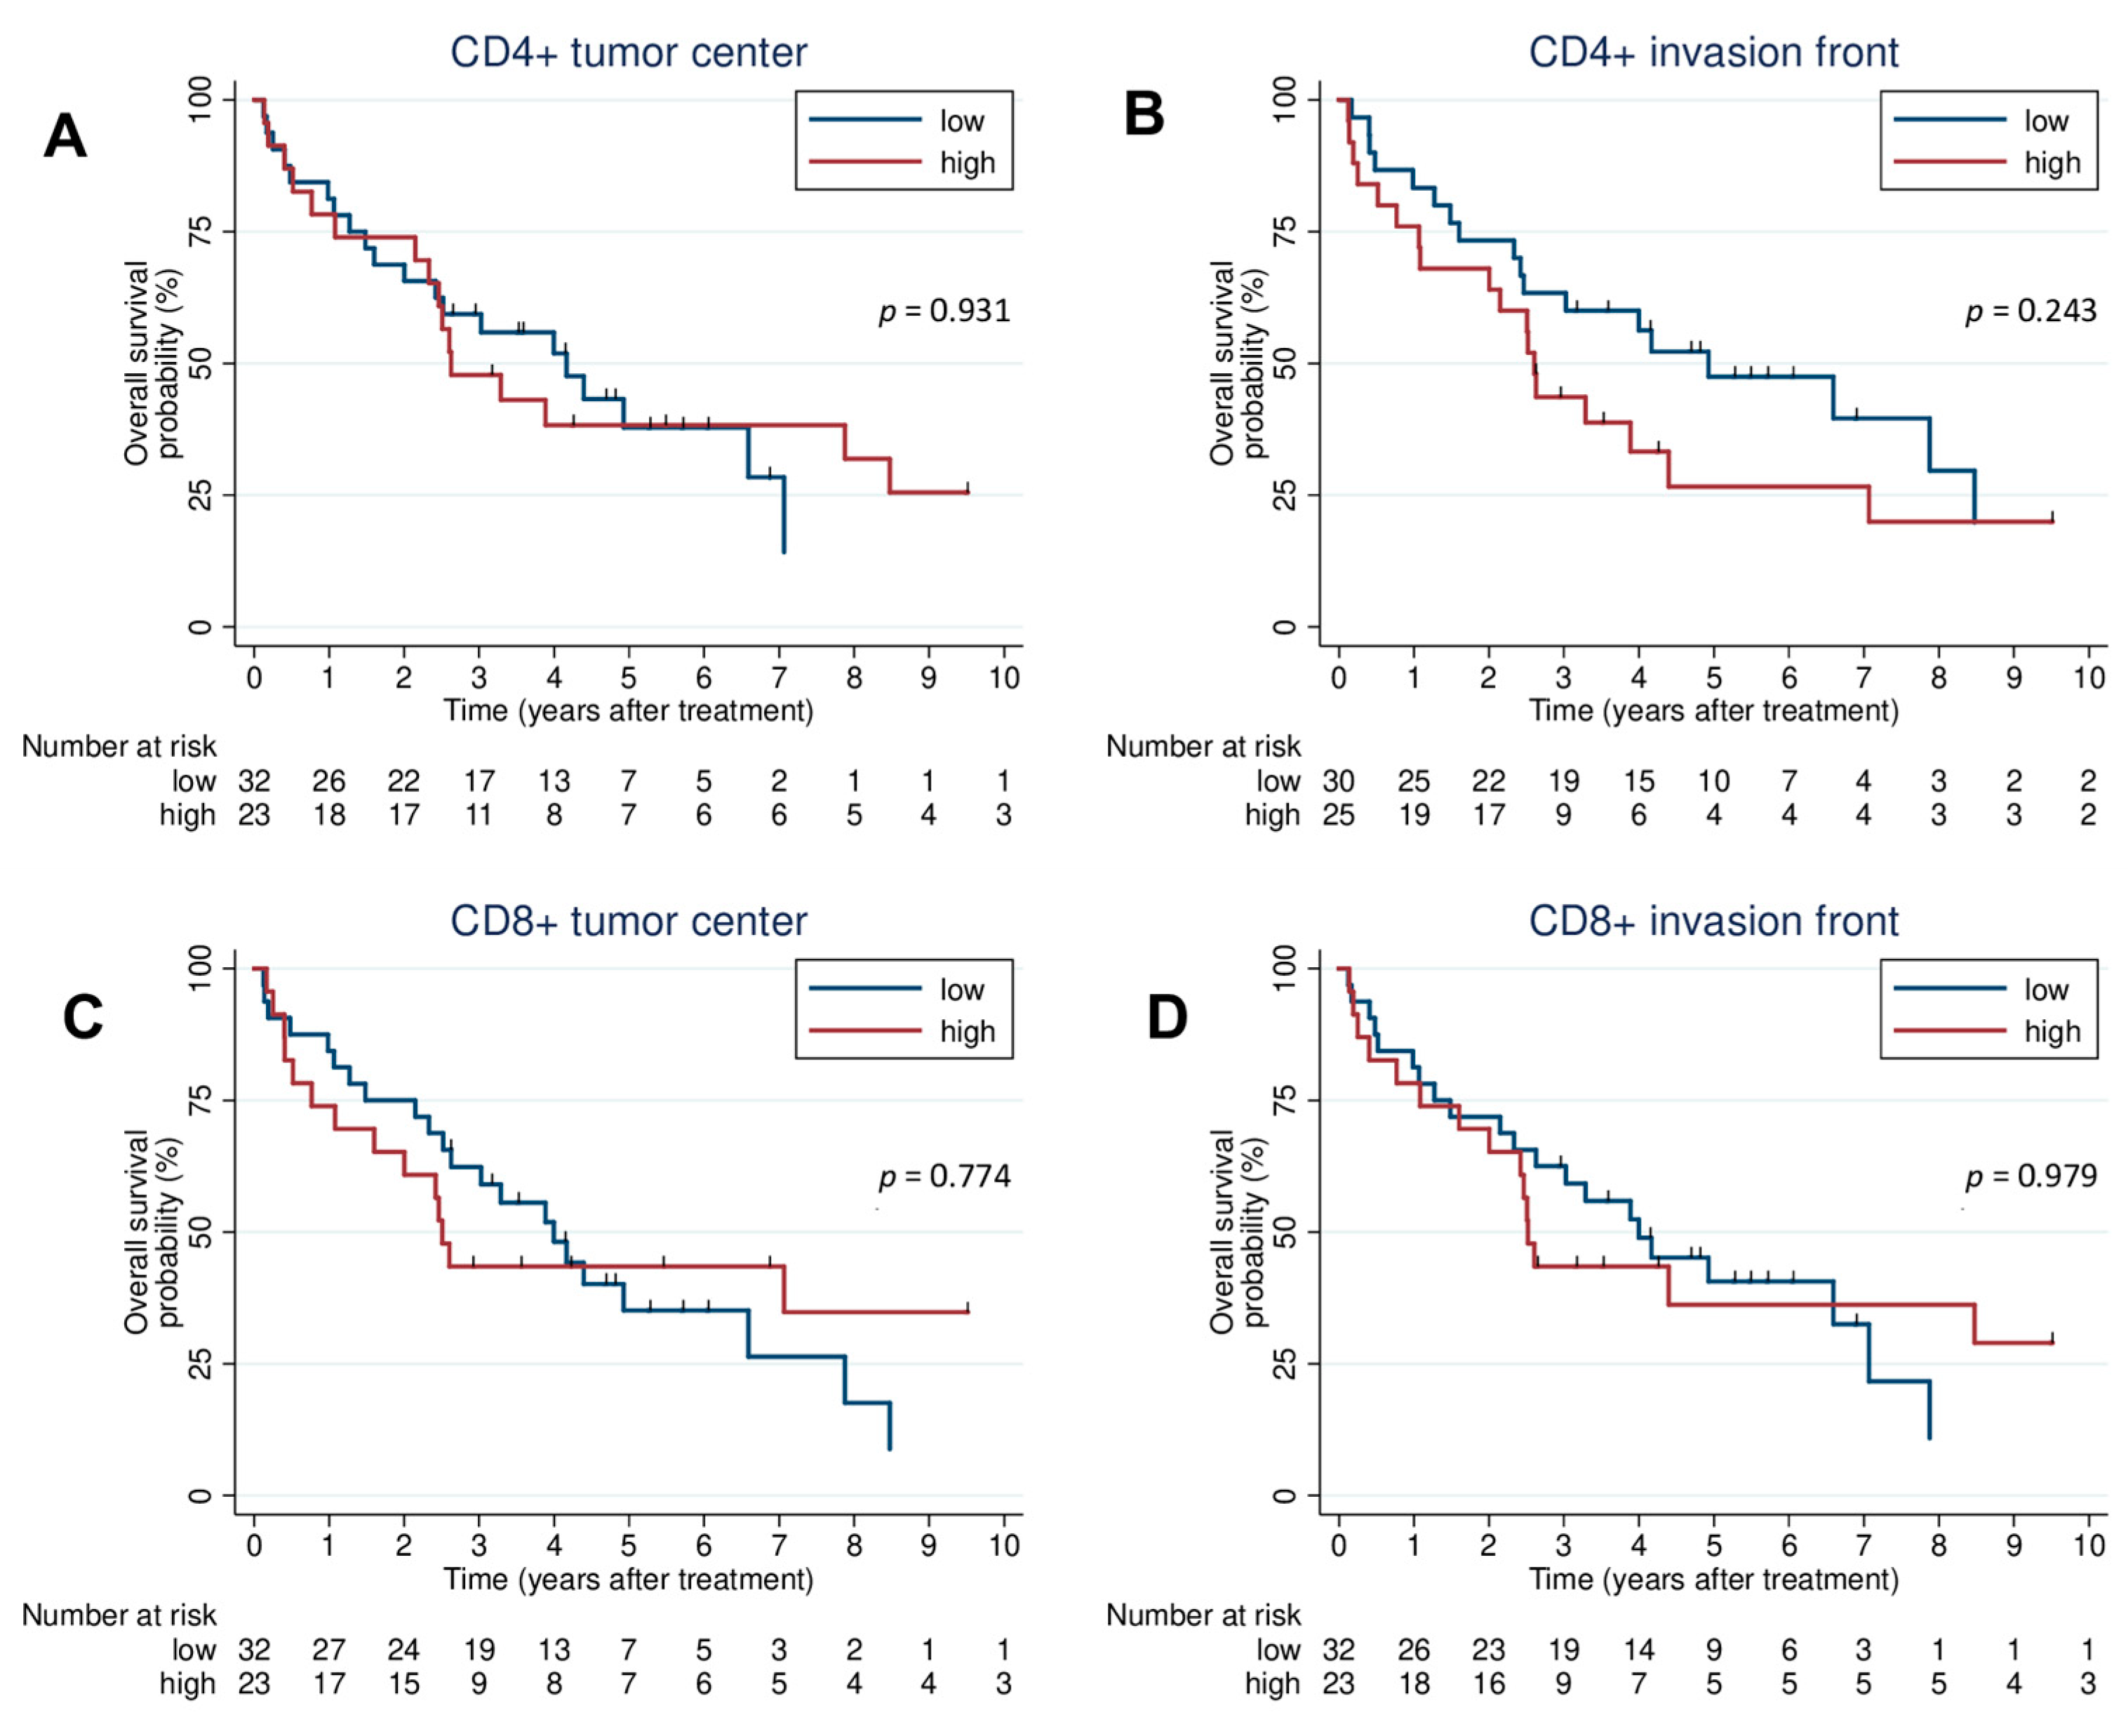
| CD4+ tumor center | 55 | |||
| high vs. low (ref) | 0.97 | (0.49–1.91) | 0.931 | |
| CD4+ invasion front | 55 | |||
| high vs. low (ref) | 1.48 | (0.77–2.86) | 0.242 | |
| CD8+ tumor center | 55 | |||
| high vs. low (ref) | 0.91 | (0.46–1.79) | 0.774 | |
| CD8+ invasion front | 55 | |||
| high vs. low (ref) | 1.01 | (0.51–1.99) | 0.979 | |
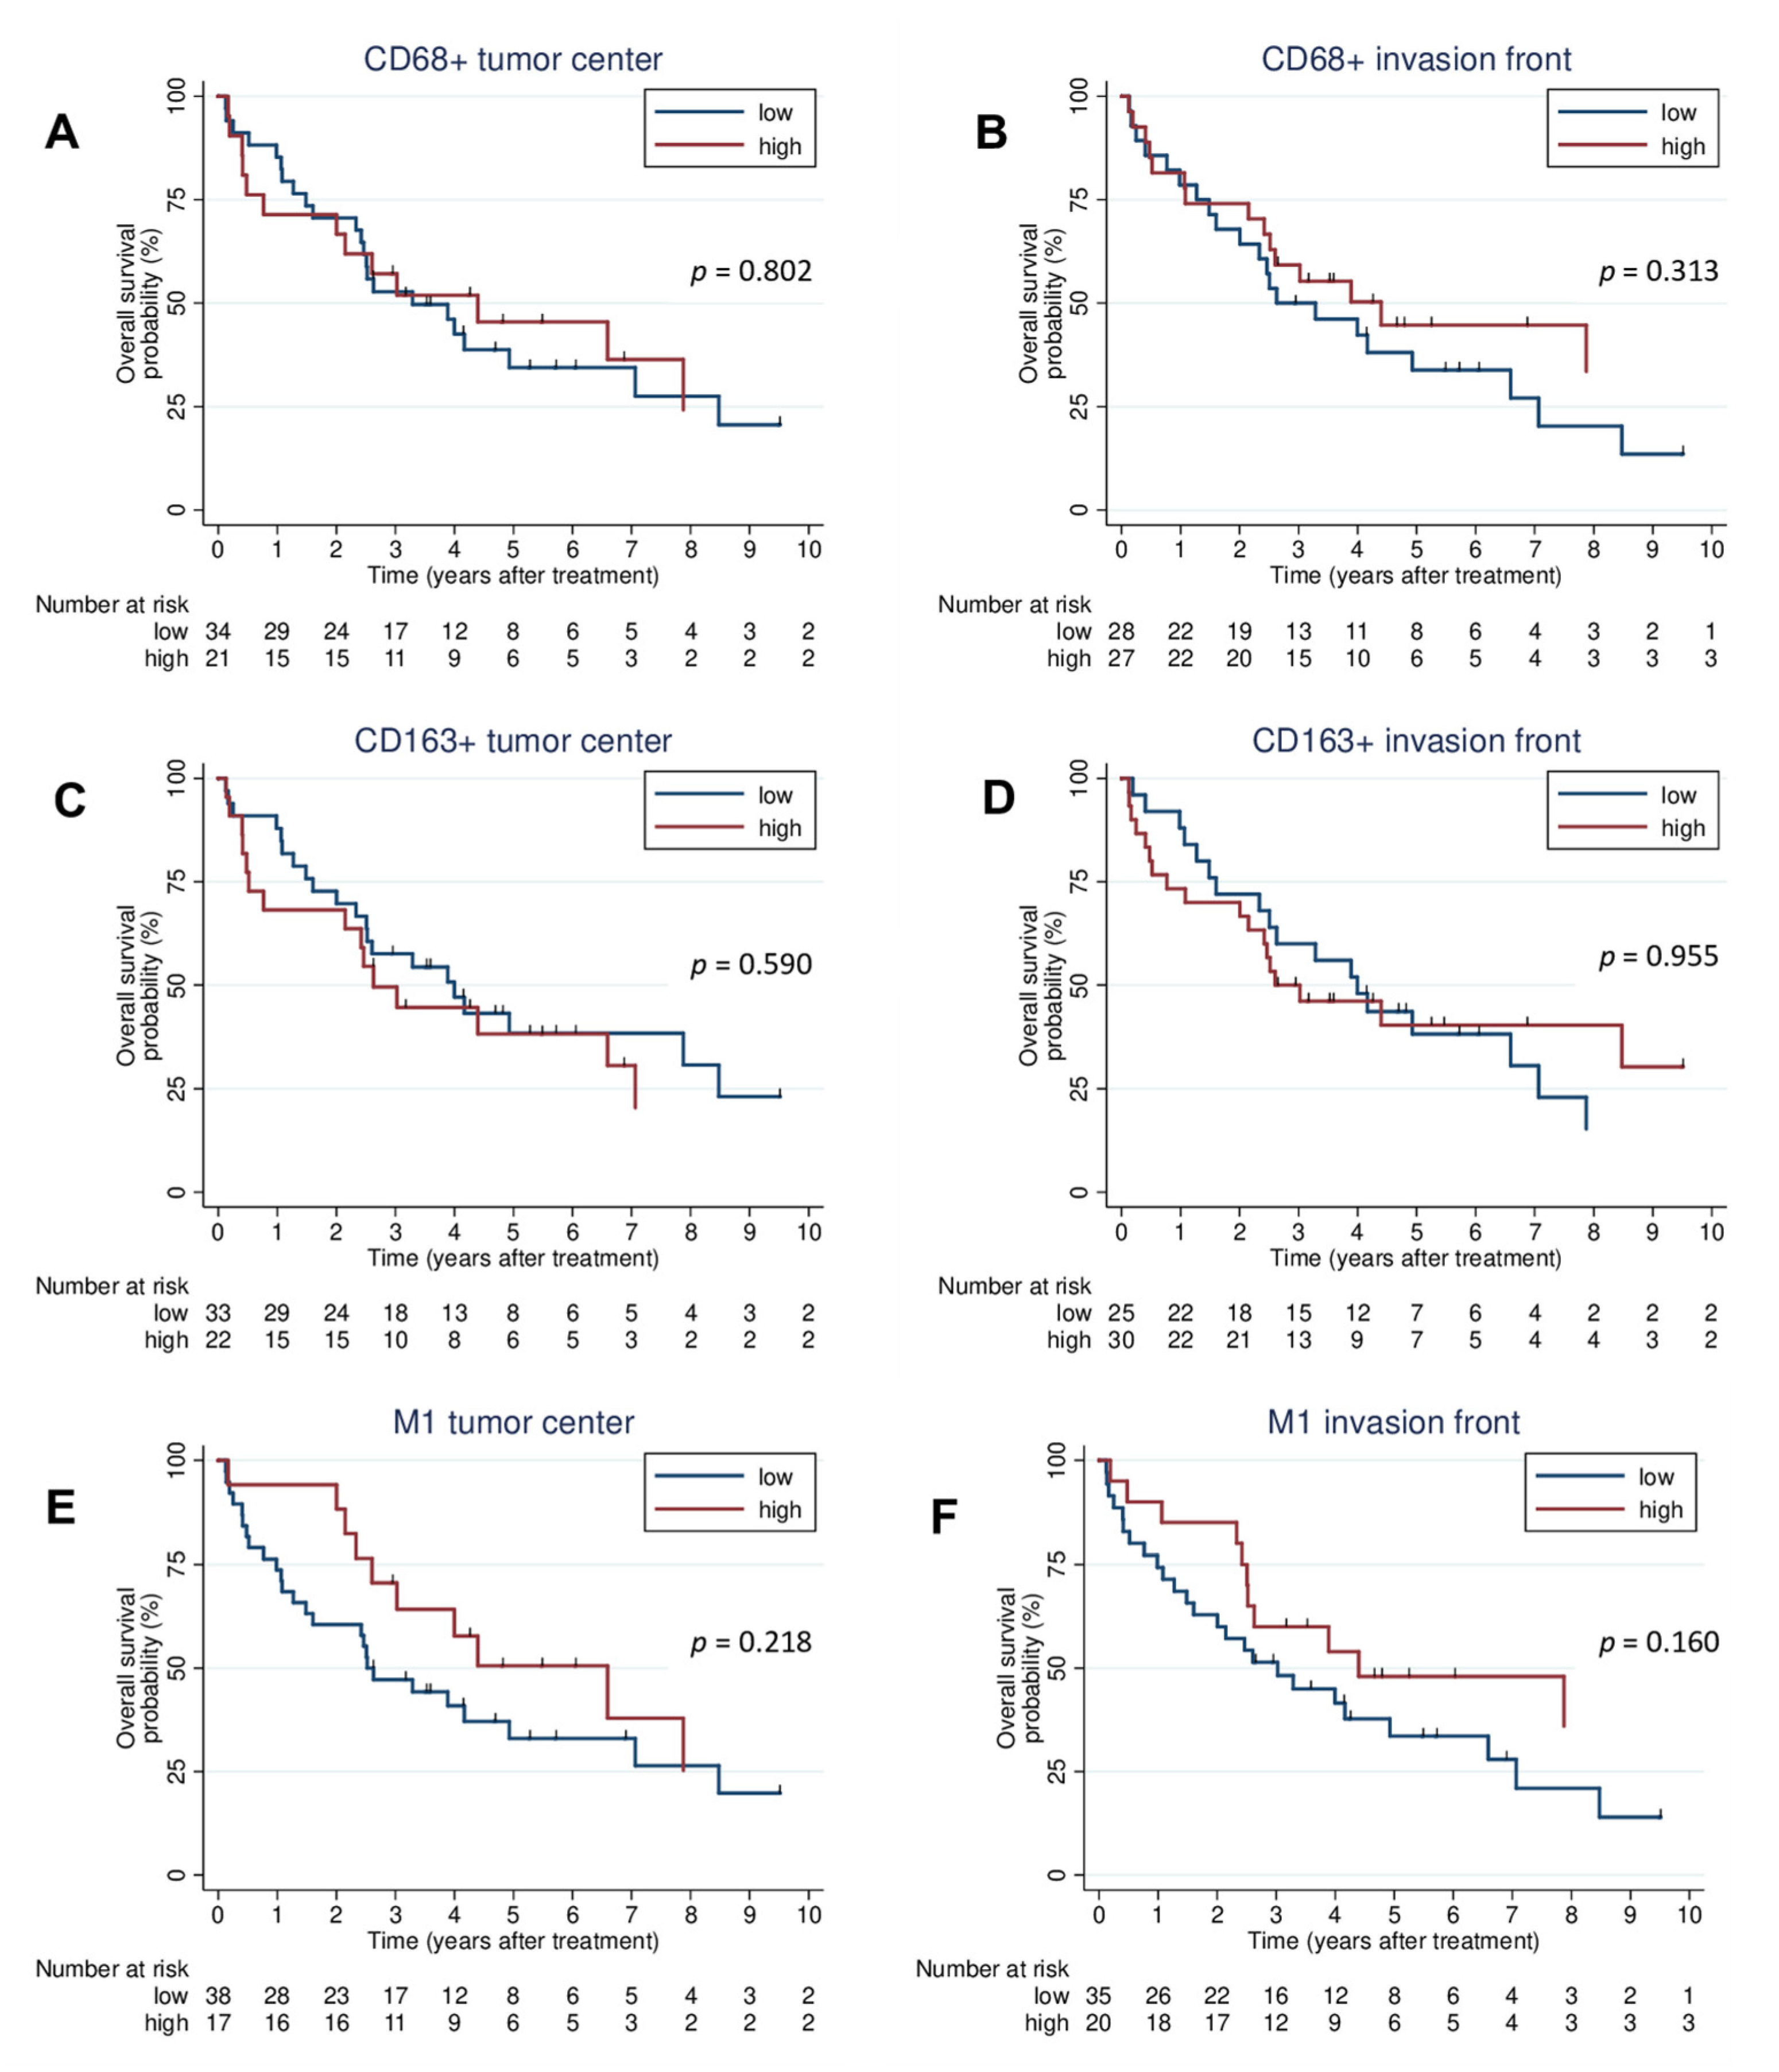
| CD68+ tumor center | 55 | |||
| high vs. low (ref) | 0.92 | (0.46–1.81) | 0.803 | |
| CD68+ invasion front | 55 | |||
| high vs. low (ref) | 0.71 | (0.37–1.38) | 0.317 | |
| CD163+ tumor center | 55 | |||
| high vs. low (ref) | 1.20 | (0.62–2.34) | 0.588 | |
| CD163+ invasion front | 55 | |||
| high vs. low (ref) | 0.98 | (0.51–1.89) | 0.955 | |
| M1 tumor center | 55 | |||
| high vs. low (ref) | 0.64 | (0.31–1.33) | 0.231 | |
| M1 invasion front | 55 | |||
| high vs. low (ref) | 0.60 | (0.29–1.22) | 0.160 | |
Disclaimer/Publisher’s Note: The statements, opinions and data contained in all publications are solely those of the individual author(s) and contributor(s) and not of MDPI and/or the editor(s). MDPI and/or the editor(s) disclaim responsibility for any injury to people or property resulting from any ideas, methods, instructions or products referred to in the content. |
© 2023 by the authors. Licensee MDPI, Basel, Switzerland. This article is an open access article distributed under the terms and conditions of the Creative Commons Attribution (CC BY) license (https://creativecommons.org/licenses/by/4.0/).
Share and Cite
Mamilos, A.; Lein, A.; Winter, L.; Ettl, T.; Künzel, J.; Reichert, T.E.; Spanier, G.; Brochhausen, C. Tumor Immune Microenvironment Heterogeneity at the Invasion Front and Tumor Center in Oral Squamous Cell Carcinoma as a Perspective of Managing This Cancer Entity. J. Clin. Med. 2023, 12, 1704. https://doi.org/10.3390/jcm12041704
Mamilos A, Lein A, Winter L, Ettl T, Künzel J, Reichert TE, Spanier G, Brochhausen C. Tumor Immune Microenvironment Heterogeneity at the Invasion Front and Tumor Center in Oral Squamous Cell Carcinoma as a Perspective of Managing This Cancer Entity. Journal of Clinical Medicine. 2023; 12(4):1704. https://doi.org/10.3390/jcm12041704
Chicago/Turabian StyleMamilos, Andreas, Alexander Lein, Lina Winter, Tobias Ettl, Julian Künzel, Torsten E. Reichert, Gerrit Spanier, and Christoph Brochhausen. 2023. "Tumor Immune Microenvironment Heterogeneity at the Invasion Front and Tumor Center in Oral Squamous Cell Carcinoma as a Perspective of Managing This Cancer Entity" Journal of Clinical Medicine 12, no. 4: 1704. https://doi.org/10.3390/jcm12041704
APA StyleMamilos, A., Lein, A., Winter, L., Ettl, T., Künzel, J., Reichert, T. E., Spanier, G., & Brochhausen, C. (2023). Tumor Immune Microenvironment Heterogeneity at the Invasion Front and Tumor Center in Oral Squamous Cell Carcinoma as a Perspective of Managing This Cancer Entity. Journal of Clinical Medicine, 12(4), 1704. https://doi.org/10.3390/jcm12041704