
Peripheral Refraction and Visual Function of Novel Perifocal Ophthalmic Lens for the Control of Myopia Progression

 ,
,  ,
,  ,
,  and
and 
Abstract
:1. Introduction
2. Materials and Methods
2.1. Study Design
2.2. Eligibility Criteria
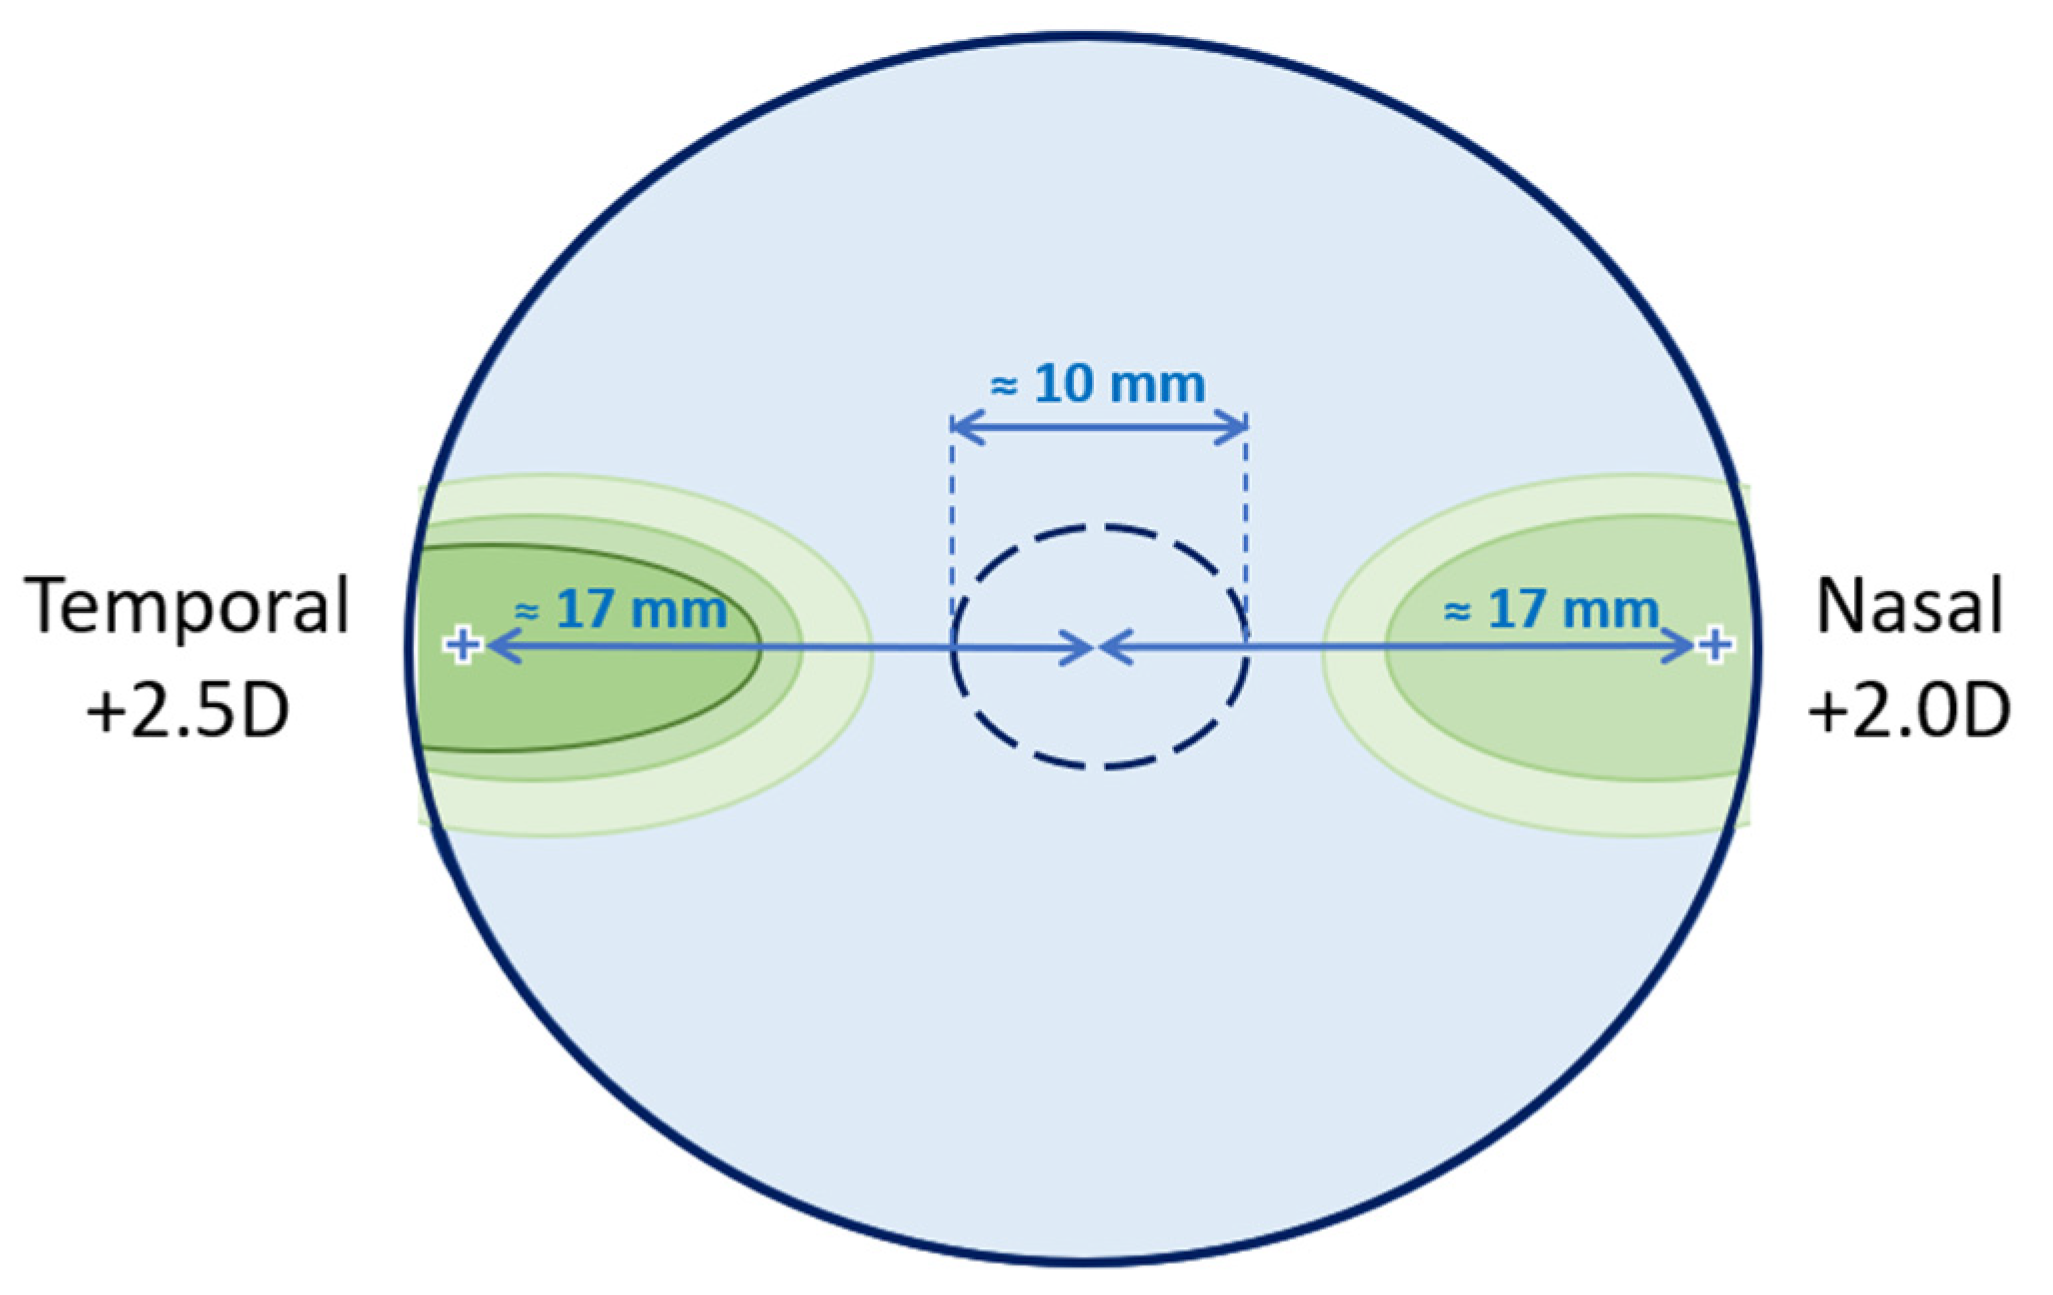
2.3. Perifocal Lens
2.4. Clinical Assessments
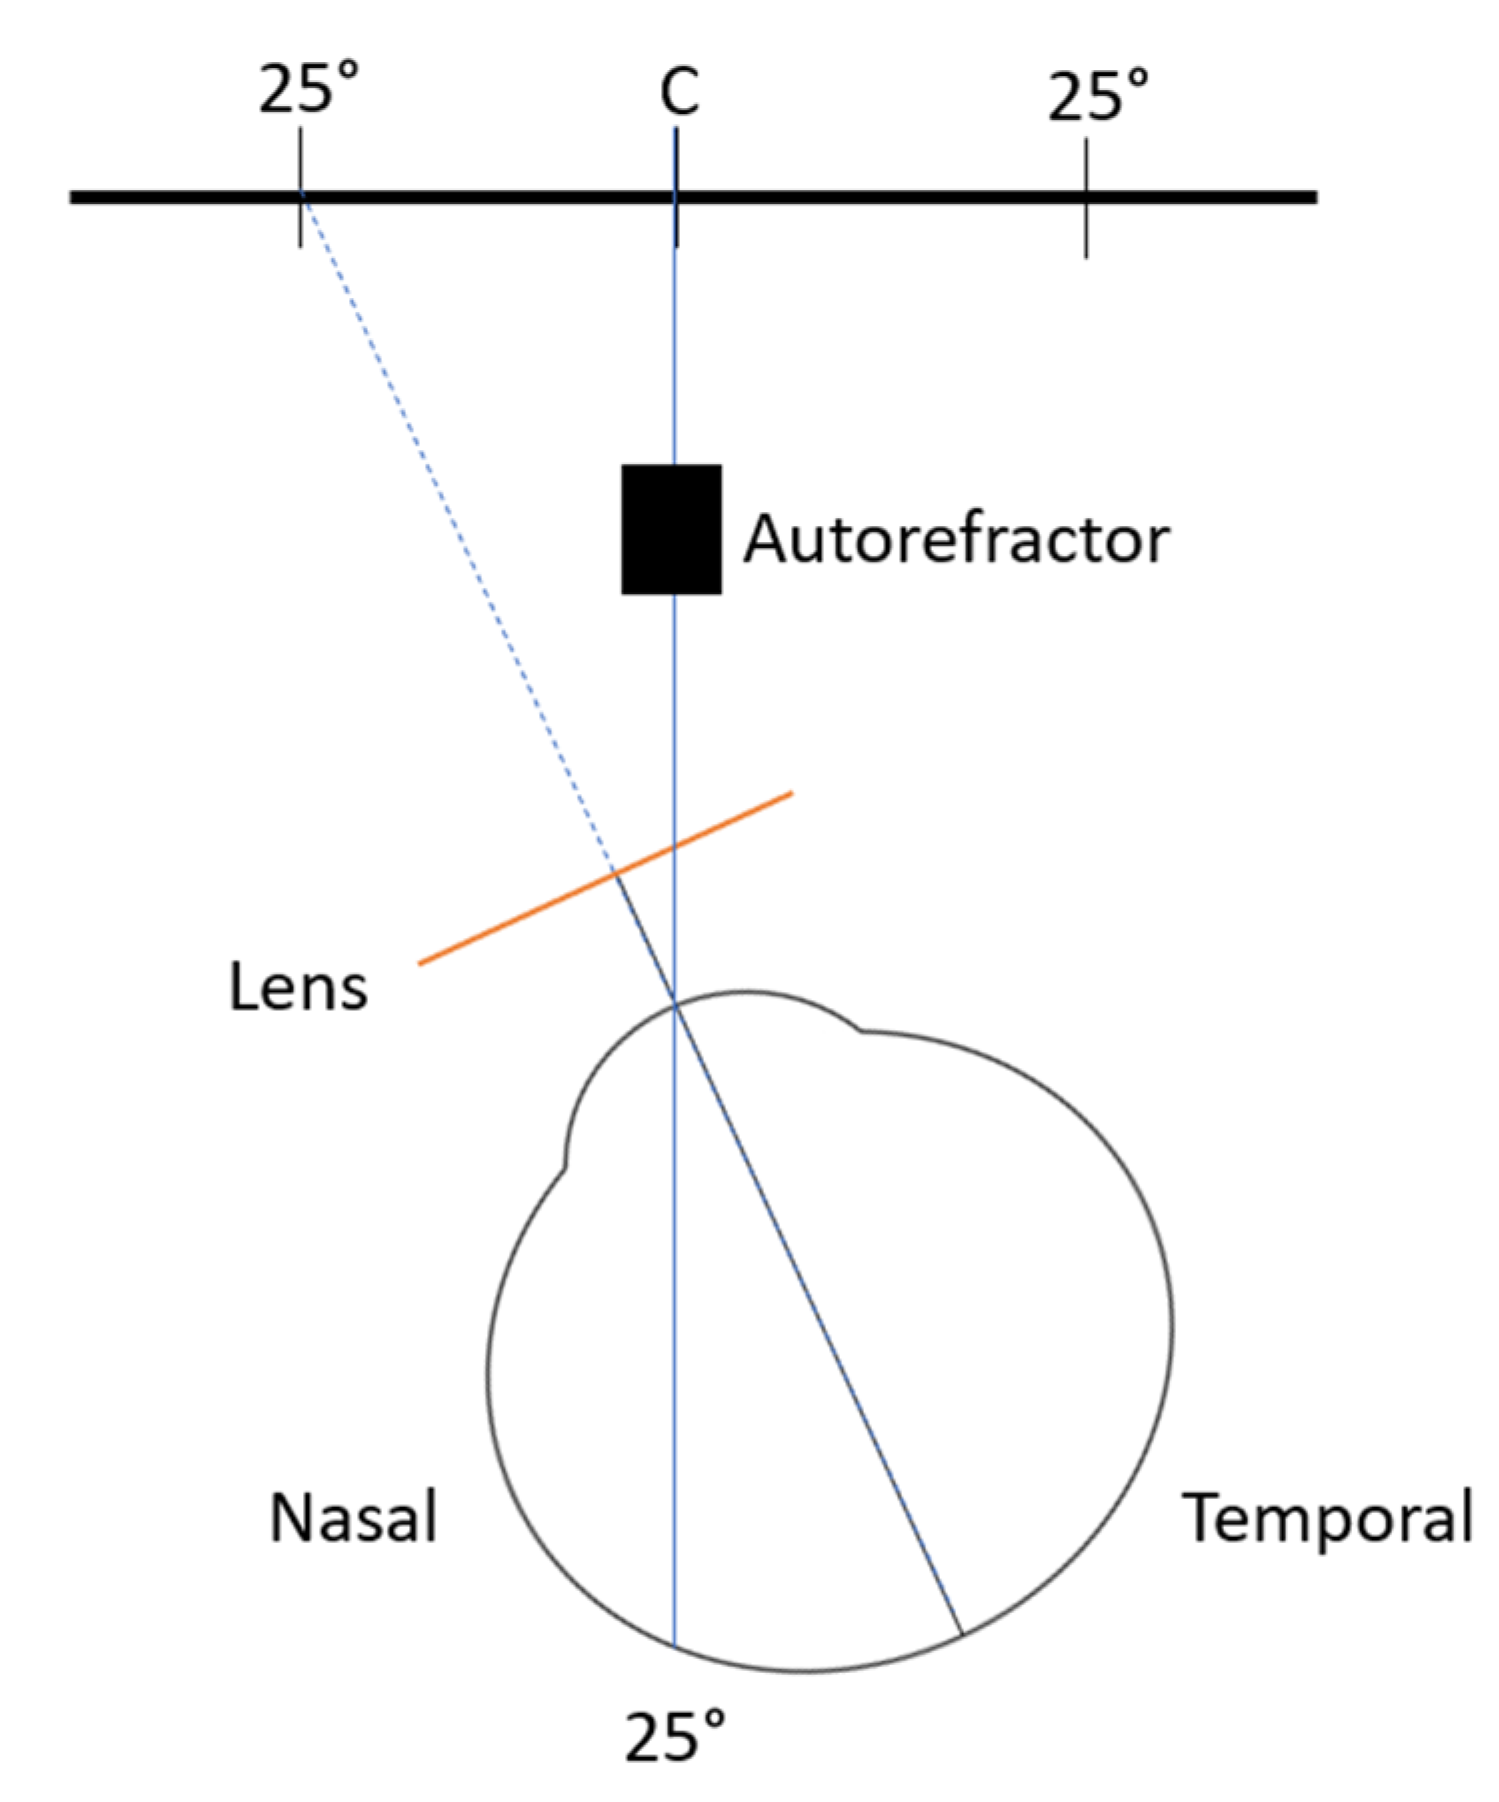
2.5. Peripheral Refraction
2.6. Contrast Sensitivity
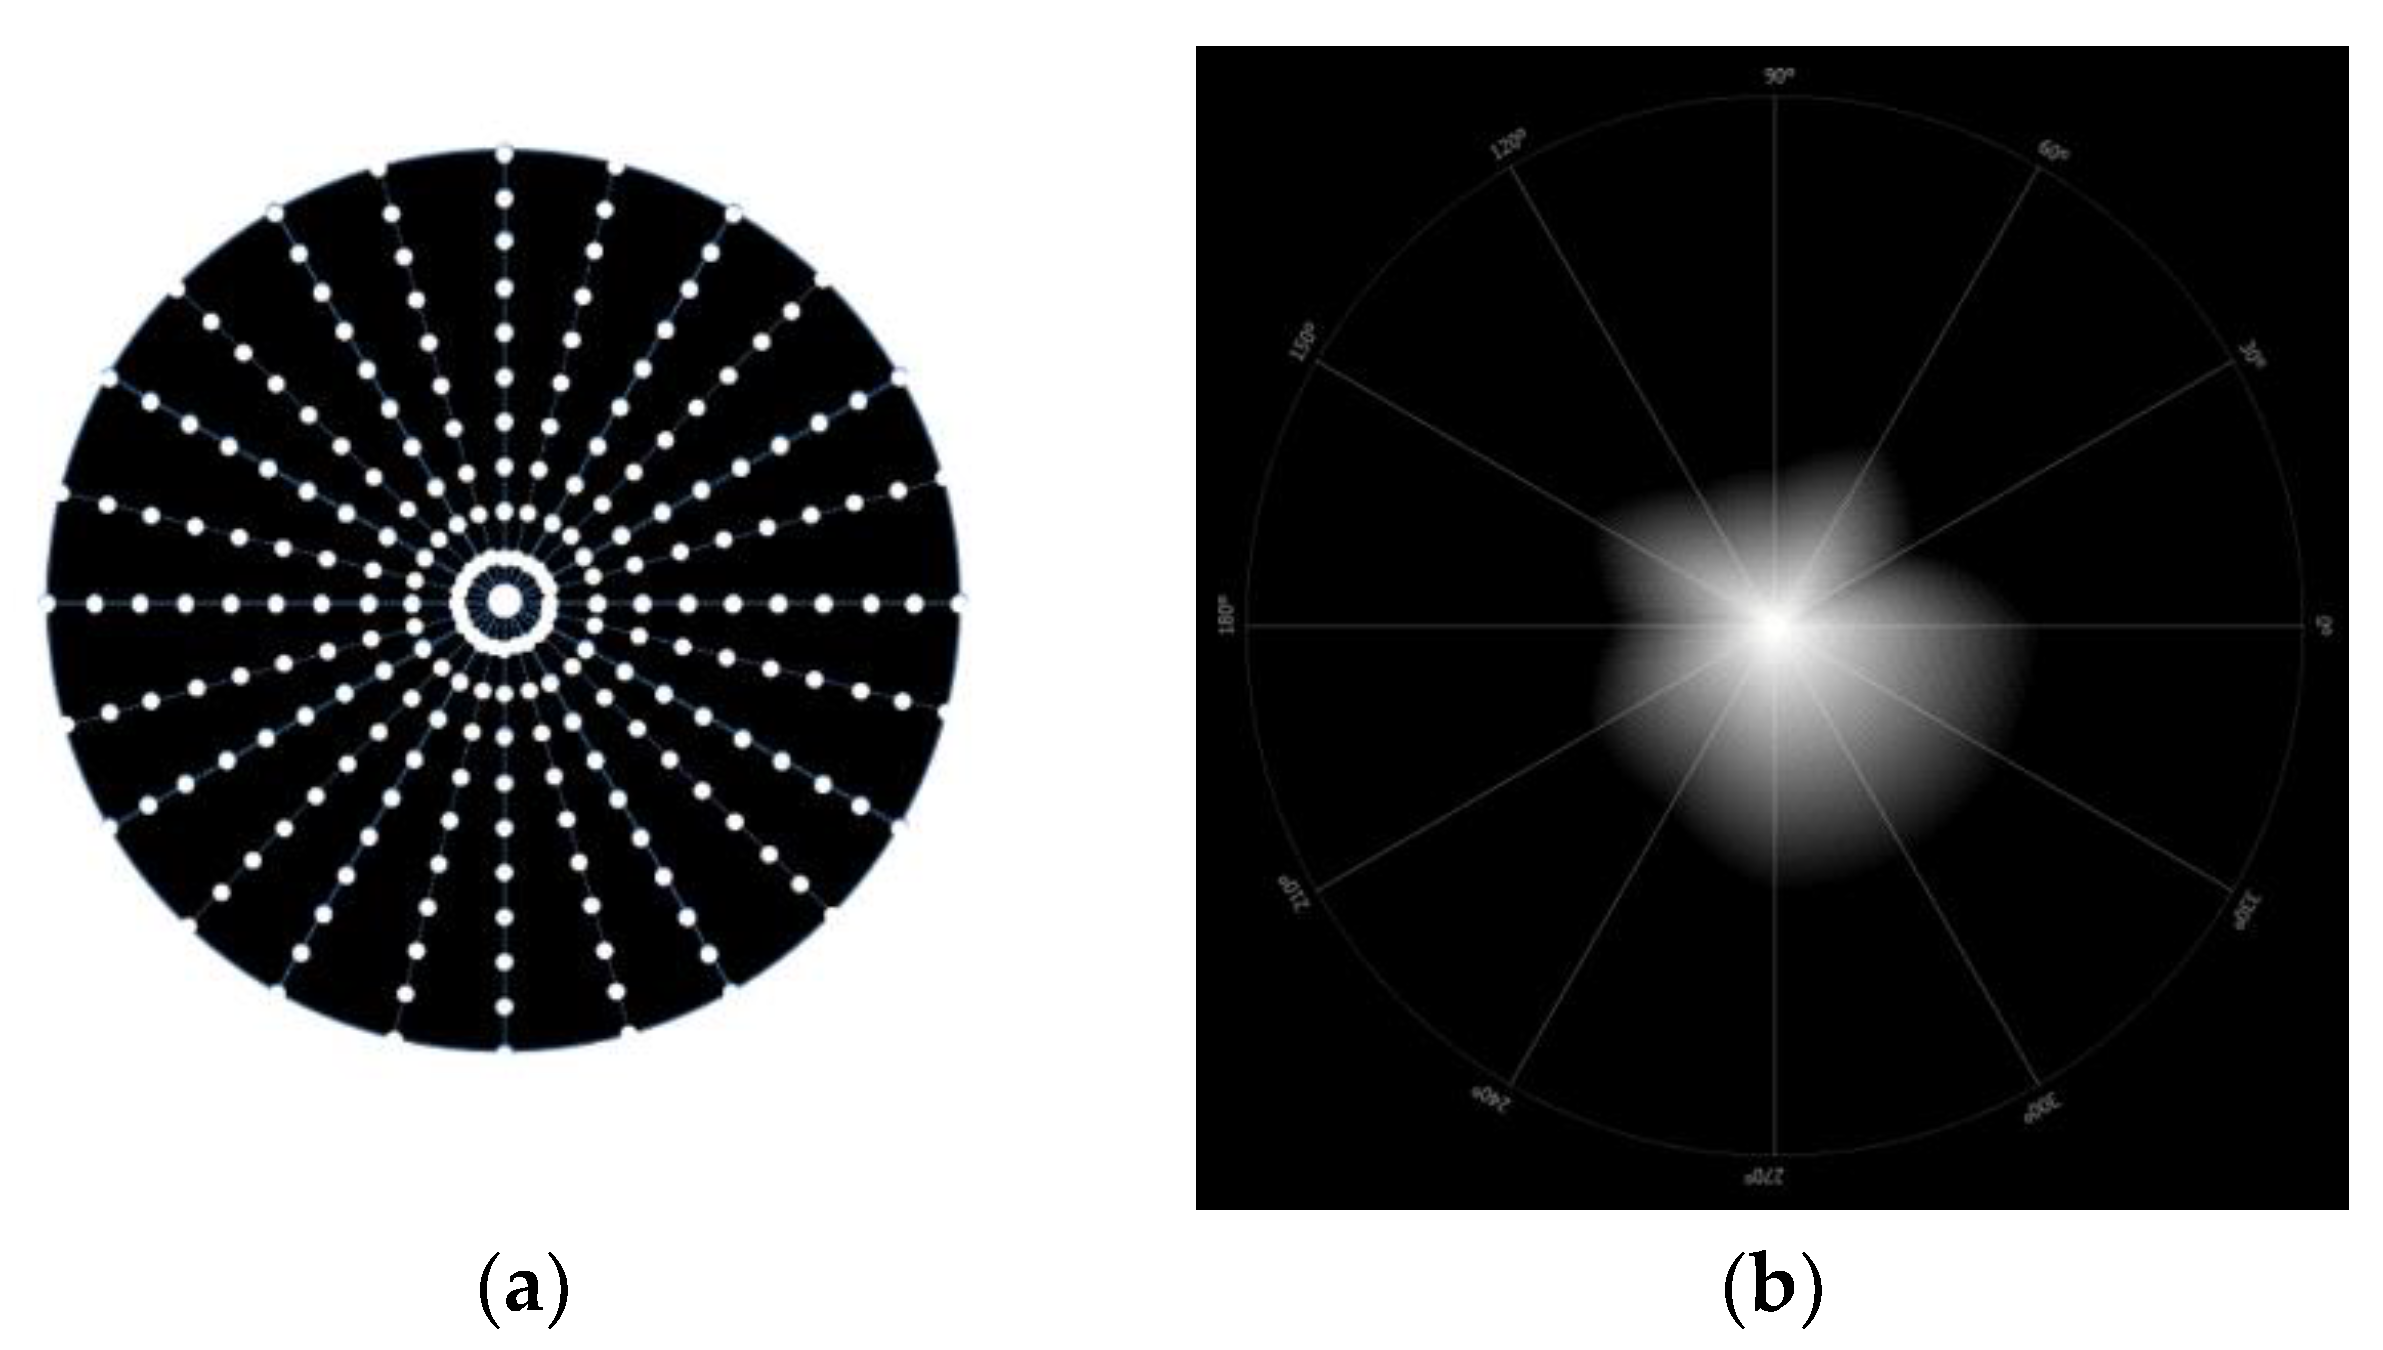
2.7. Light Disturbance
2.8. Statistical Analysis
3. Results
3.1. Sample Characterization
3.2. Peripheral Refraction
3.3. Contrast Sensitivity
3.4. Light Disturbance
4. Discussion
4.1. Peripheral Refraction
4.2. Contrast Sensitivity
4.3. Light Disturbance
5. Conclusions
Author Contributions
Funding
Institutional Review Board Statement
Informed Consent Statement
Data Availability Statement
Acknowledgments
Conflicts of Interest
References
- Holden, B.A.; Fricke, T.R.; Wilson, D.A.; Jong, M.; Naidoo, K.S.; Sankaridurg, P.; Wong, T.Y.; Naduvilath, T.J.; Resnikoff, S. Global Prevalence of Myopia and High Myopia and Temporal Trends from 2000 through 2050. Ophthalmology 2016, 123, 1036–1042. [Google Scholar] [CrossRef] [PubMed]
- Ha, A.; Kim, C.Y.; Shim, S.R.; Chang, I.B.; Kim, Y.K. Degree of Myopia and Glaucoma Risk: A Dose-Response Meta-Analysis. Am. J. Ophthalmol. 2022, 236, 107–119. [Google Scholar] [CrossRef] [PubMed]
- Younan, C.; Mitchell, P.; Cumming, R.G.; Rochtchina, E.; Wang, J.J. Myopia and Incident Cataract and Cataract Surgery: The Blue Mountains Eye Study. Investig. Opthalmol. Vis. Sci. 2002, 43, 3625–3632. [Google Scholar]
- Pan, C.W.; Cheng, C.Y.; Saw, S.M.; Wang, J.J.; Wong, T.Y. Myopia and Age-Related Cataract: A Systematic Review and Meta-Analysis. Am. J. Ophthalmol. 2013, 156, 1021–1033.e1. [Google Scholar] [CrossRef] [PubMed]
- Lakawicz, J.M.; Bottega, W.J.; Fine, H.F.; Prenner, J.L. On the Mechanics of Myopia and Its Influence on Retinal Detachment. Biomech. Model. Mechanobiol. 2020, 19, 603–620. [Google Scholar] [CrossRef]
- Hashimoto, S.; Yasuda, M.; Fujiwara, K.; Ueda, E.; Hata, J.; Hirakawa, Y.; Ninomiya, T.; Sonoda, K. hei Association between Axial Length and Myopic Maculopathy: The Hisayama Study. Ophthalmol. Retina 2019, 3, 867–873. [Google Scholar] [CrossRef]
- Haarman, A.E.G.; Enthoven, C.A.; Willem, J.; Tideman, L.; Tedja, M.S.; Verhoeven, V.J.M.; Klaver, C.C.W. The Complications of Myopia: A Review and Meta-Analysis. Invest. Ophthalmol. Vis. Sci. 2020, 61, 49. [Google Scholar] [CrossRef]
- Holden, B.A.; Jong, M.; Davis, S.; Wilson, D.; Fricke, T.; Resnikoff, S. Nearly 1 Billion Myopes at Risk of Myopia-Related Sight-Threatening Conditions by 2050—Time to Act Now. Clin. Exp. Optom. 2015, 98, 491–493. [Google Scholar] [CrossRef]
- Lam, C.S.Y.; Tang, W.C.; Tse, D.Y.Y.; Lee, R.P.K.; Chun, R.K.M.; Hasegawa, K.; Qi, H.; Hatanaka, T.; To, C.H. Defocus Incorporated Multiple Segments (DIMS) Spectacle Lenses Slow Myopia Progression: A 2-Year Randomised Clinical Trial. Br. J. Ophthalmol. 2020, 104, 363–368. [Google Scholar] [CrossRef]
- Kaymak, H.; Neller, K.; Schütz, S.; Graff, B.; Sickenberger, W.; Langenbucher, A.; Seitz, B.; Schwahn, H. Vision Tests on Spectacle Lenses and Contact Lenses for Optical Myopia Correction: A Pilot Study. BMJ Open Ophthalmol. 2022, 7, e000971. [Google Scholar] [CrossRef]
- Bao, J.; Huang, Y.; Li, X.; Yang, A.; Zhou, F.; Wu, J.; Wang, C.; Li, Y.; Lim, E.W.; Spiegel, D.P.; et al. Spectacle Lenses With Aspherical Lenslets for Myopia Control vs Single-Vision Spectacle Lenses: A Randomized Clinical Trial. JAMA Ophthalmol. 2022, 140, 472–478. [Google Scholar] [CrossRef]
- Li, X.; Ding, C.; Li, Y.; Lim, E.W.; Gao, Y.; Fermigier, B.; Yang, A.; Chen, H.; Bao, J. Influence of Lenslet Configuration on Short-Term Visual Performance in Myopia Control Spectacle Lenses. Front. Neurosci. 2021, 15, 667329. [Google Scholar] [CrossRef]
- Tarutta, E.P.; Proskurina, O.V.; Tarasova, N.A.; Milash, S.V.; Markosyan, G.A. Long-Term Results of Perifocal Defocus Spectacle Lens Correction in Children with Progressive Myopia. Vestn. Oftalmol. 2019, 135, 46–53. [Google Scholar] [CrossRef]
- Faria-Ribeiro, M.; Queirós, A.; Lopes-Ferreira, D.; Jorge, J.; Manuel González-Méijome, J. Peripheral Refraction and Retinal Contour in Stable and Progressive Myopia. Optom. Vis. Sci. 2013, 90, 9–15. [Google Scholar] [CrossRef]
- Lopes-Ferreira, D.P.; Neves, H.I.F.; Faria-Ribeiro, M.; Queirós, A.; Fernandes, P.R.B.; González-Méijome, J.M. Peripheral Refraction with Eye and Head Rotation with Contact Lenses. Cont. Lens. Anterior. Eye 2015, 38, 104–109. [Google Scholar] [CrossRef]
- Queirós, A.; Amorim-de-Sousa, A.; Lopes-Ferreira, D.; Villa-Collar, C.; Gutiérrez, Á.R.; González-Méijome, J.M. Relative Peripheral Refraction across 4 Meridians after Orthokeratology and LASIK Surgery. Eye Vis. 2018, 5, 12. [Google Scholar] [CrossRef]
- Thibos, L.N.; Wheeler, W.; Horner, D. Power Vectors: An Application of Fourier Analysis to the Description and Statistical Analysis of Refractive Error. Optom. Vis. Sci. 1997, 74, 367–375. [Google Scholar] [CrossRef]
- Linhares, J.M.M.; Neves, H.; Lopes-Ferreira, D.; Faria-Ribeiro, M.; Peixoto-De-Matos, S.C.; Gonzalez-Meijome, J.M. Radiometric Characterization of a Novel LED Array System for Visual Assessment. J. Mod. Opt. 2013, 60, 1136–1144. [Google Scholar] [CrossRef]
- Ferreira, H.; Rute, N.; Laura, M.-D.-A.; Ana, R.-D.-V.; Da-Silva, C.; Queirós, A.; González-Méijome, J.M. Validation of a Method to Measure Light Distortion Surrounding a Source of Glare. J. Biomed. Opt. 2015, 20, 75002. [Google Scholar] [CrossRef]
- Borjesön, C.; Papadogiannis, P.; Christaras, D.; Lundström, L. Peripheral Image Quality in Three Types of Myopia Control Spectacles. In Proceedings of the International Myopia Conference, Rotterdam, The Netherlands, 4–7 September 2022. [Google Scholar]
- Zhang, H.Y.; Lam, C.S.Y.; Tang, W.C.; Leung, M.; To, C.H. Defocus Incorporated Multiple Segments Spectacle Lenses Changed the Relative Peripheral Refraction: A 2-Year Randomized Clinical Trial. Investig. Ophthalmol. Vis. Sci. 2020, 61, 53. [Google Scholar] [CrossRef]
- Berntsen, D.A.; Barr, C.D.; Mutti, D.O.; Zadnik, K. Peripheral Defocus and Myopia Progression in Myopic Children Randomly Assigned to Wear Single Vision and Progressive Addition Lenses. Invest. Ophthalmol. Vis. Sci. 2013, 54, 5761–5770. [Google Scholar] [CrossRef] [PubMed]
- Walline, J.J.; Walker, M.K.; Mutti, D.O.; Jones-Jordan, L.A.; Sinnott, L.T.; Giannoni, A.G.; Bickle, K.M.; Schulle, K.L.; Nixon, A.; Pierce, G.E.; et al. Effect of High Add Power, Medium Add Power, or Single-Vision Contact Lenses on Myopia Progression in Children: The BLINK Randomized Clinical Trial. JAMA 2020, 324, 571–580. [Google Scholar] [CrossRef]
- Gao, Y.; Lim, E.W.; Yang, A.; Drobe, B.; Bullimore, M.A. The Impact of Spectacle Lenses for Myopia Control on Visual Functions. Ophthalmic Physiol. Opt. 2021, 41, 1320–1331. [Google Scholar] [CrossRef] [PubMed]
- García-Marqués, J.V.; Macedo-De-Araújo, R.J.; Cerviño, A.; García-Lázaro, S.; McAlinden, C.; González-Méijome, J.M. Comparison of Short-Term Light Disturbance, Optical and Visual Performance Outcomes between a Myopia Control Contact Lens and a Single-Vision Contact Lens. Ophthalmic Physiol. Opt. 2020, 40, 718–727. [Google Scholar] [CrossRef] [PubMed]
- Ruiz-Pomeda, A.; Fernandes, P.; Amorim-de-Sousa, A.; González-Méijome, J.M.; Prieto-Garrido, F.L.; Pérez-Sánchez, B.; Villa-Collar, C. Light Disturbance Analysis in the Controlled Randomized Clinical Trial MiSight® Assessment Study Spain (MASS). Cont. Lens. Anterior Eye 2019, 42, 200–205. [Google Scholar] [CrossRef]


| RE | LE | Binocular | |
|---|---|---|---|
| M (D) | −2.80 ± 1.75 | −2.81 ± 1.82 | |
| J0 (D) | −0.03 ± 0.33 | 0.04 ± 0.33 | |
| J45 (D) | 0.01 ± 0.17 | 0.05 ± 0.20 | |
| BCVA (LogMar) | −0.03 ± 0.06 | −0.03 ± 0.08 | −0.12 ± 0.06 |
| AL (mm) | 24.61 ± 0.78 | 24.62 ± 0.89 |
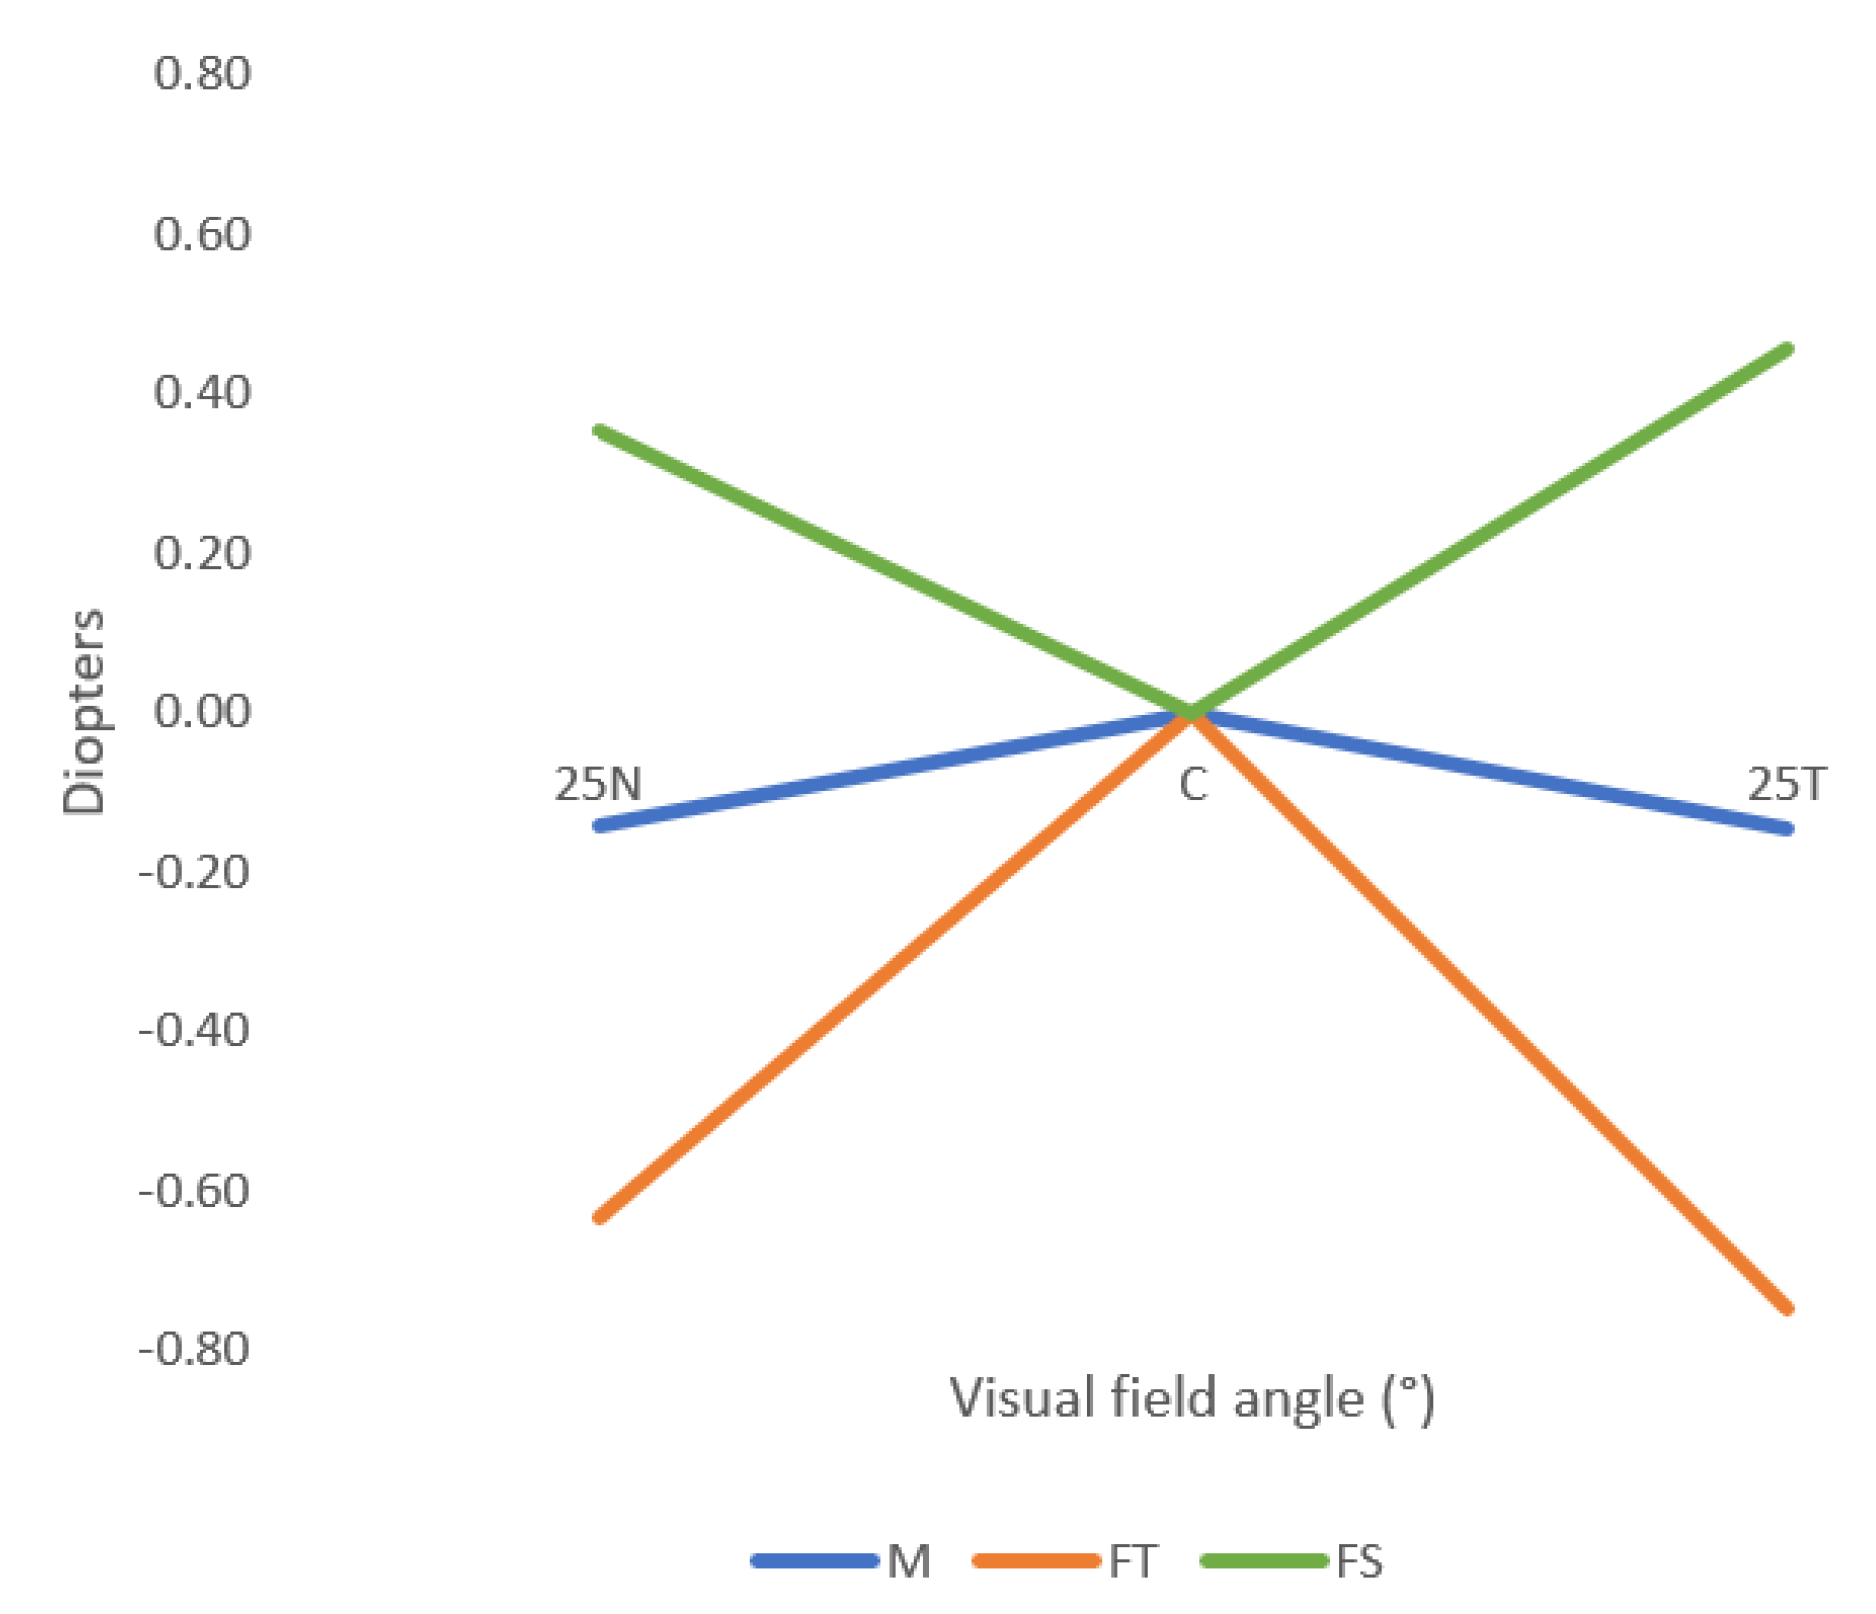
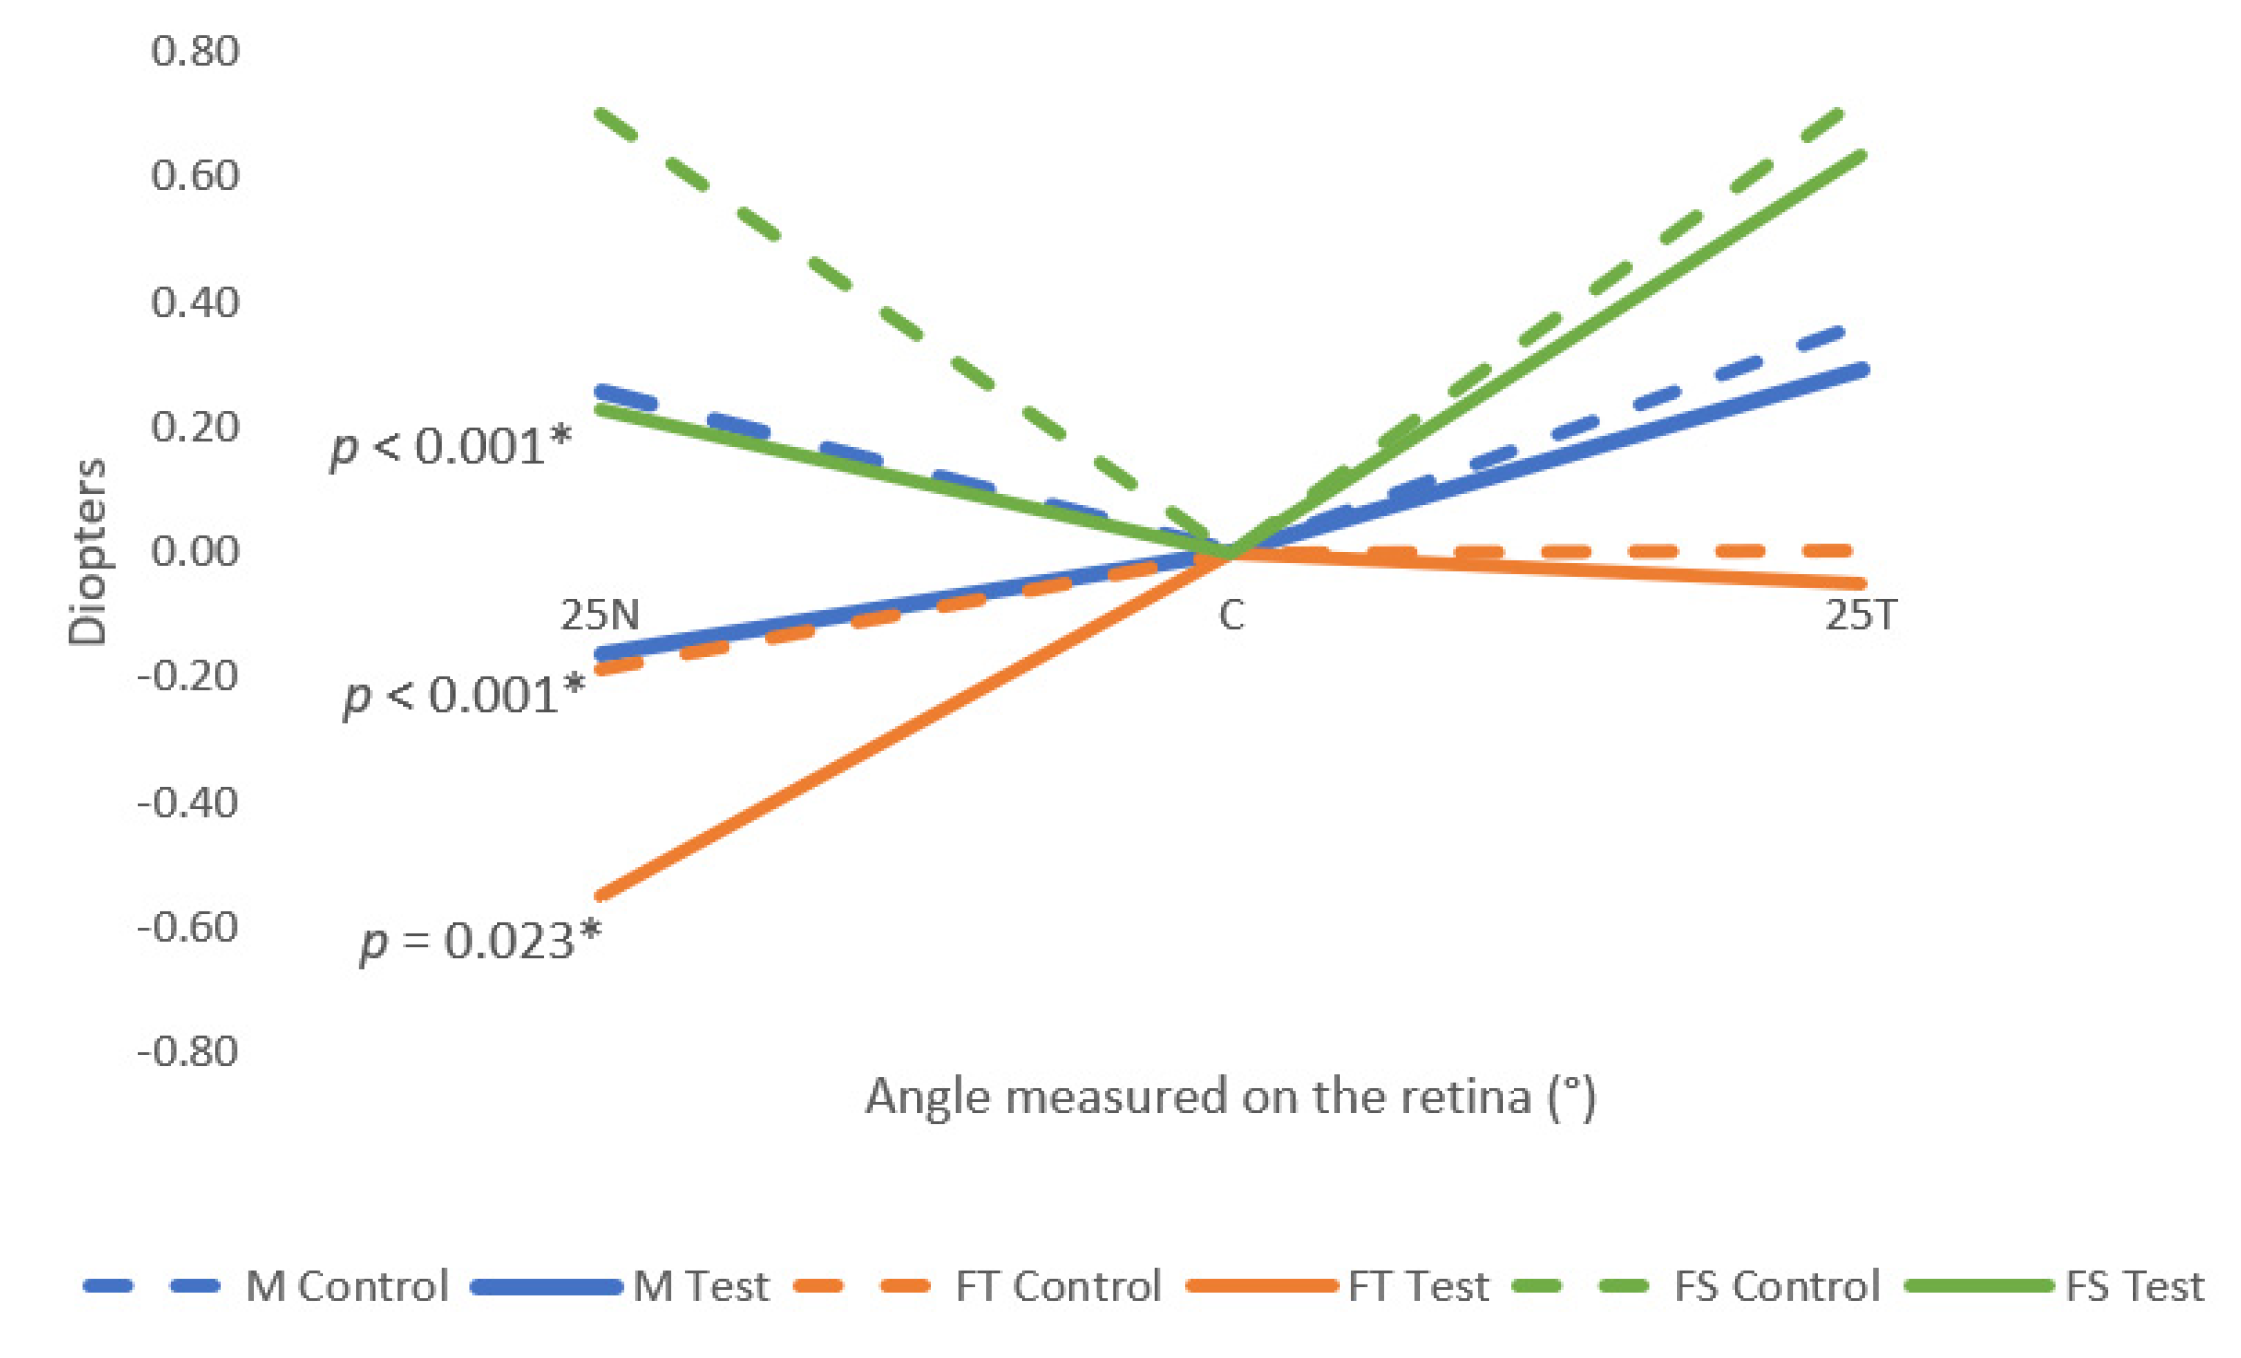
| M | FT | FS | ||||||||||
|---|---|---|---|---|---|---|---|---|---|---|---|---|
| Naked Eye | Control | Test | p-Value | Naked Eye | Control | Test | p-Value | Naked Eye | Control | Test | p-Value | |
| 25N | −0.14 ± 0.98 | 0.26 ± 0.97 | −0.16 ± 1.01 | <0.001 * | −0.63 ± 1.23 | −0.19 ± 1.11 | −0.55 ± 1.19 | 0.023 * | 0.35 ± 0.85 | 0.70 ± 0.92 | 0.23 ± 0.94 | <0.001 * |
| C | 0.00 ± 0.00 | 0.00 ± 0.00 | 0.00 ± 0.00 | 1.000 + | 0.00 ± 0.00 | 0.00 ± 0.00 | 0.00 ± 0.00 | 1.000 + | 0.00 ± 0.00 | 0.00 ± 0.00 | 0.00 ± 0.00 | 1.000 + |
| 25T | −0.15 ± 0.78 | 0.37 ± 0.87 | 0.29 ± 0.83 | 0.366 * | −0.75 ± 0.94 | 0.00 ± 0.96 | −0.05 ± 0.93 | 0.660 * | 0.46 ± 0.74 | 0.73 ± 0.83 | 0.63 ± 0.81 | 0.361 * |
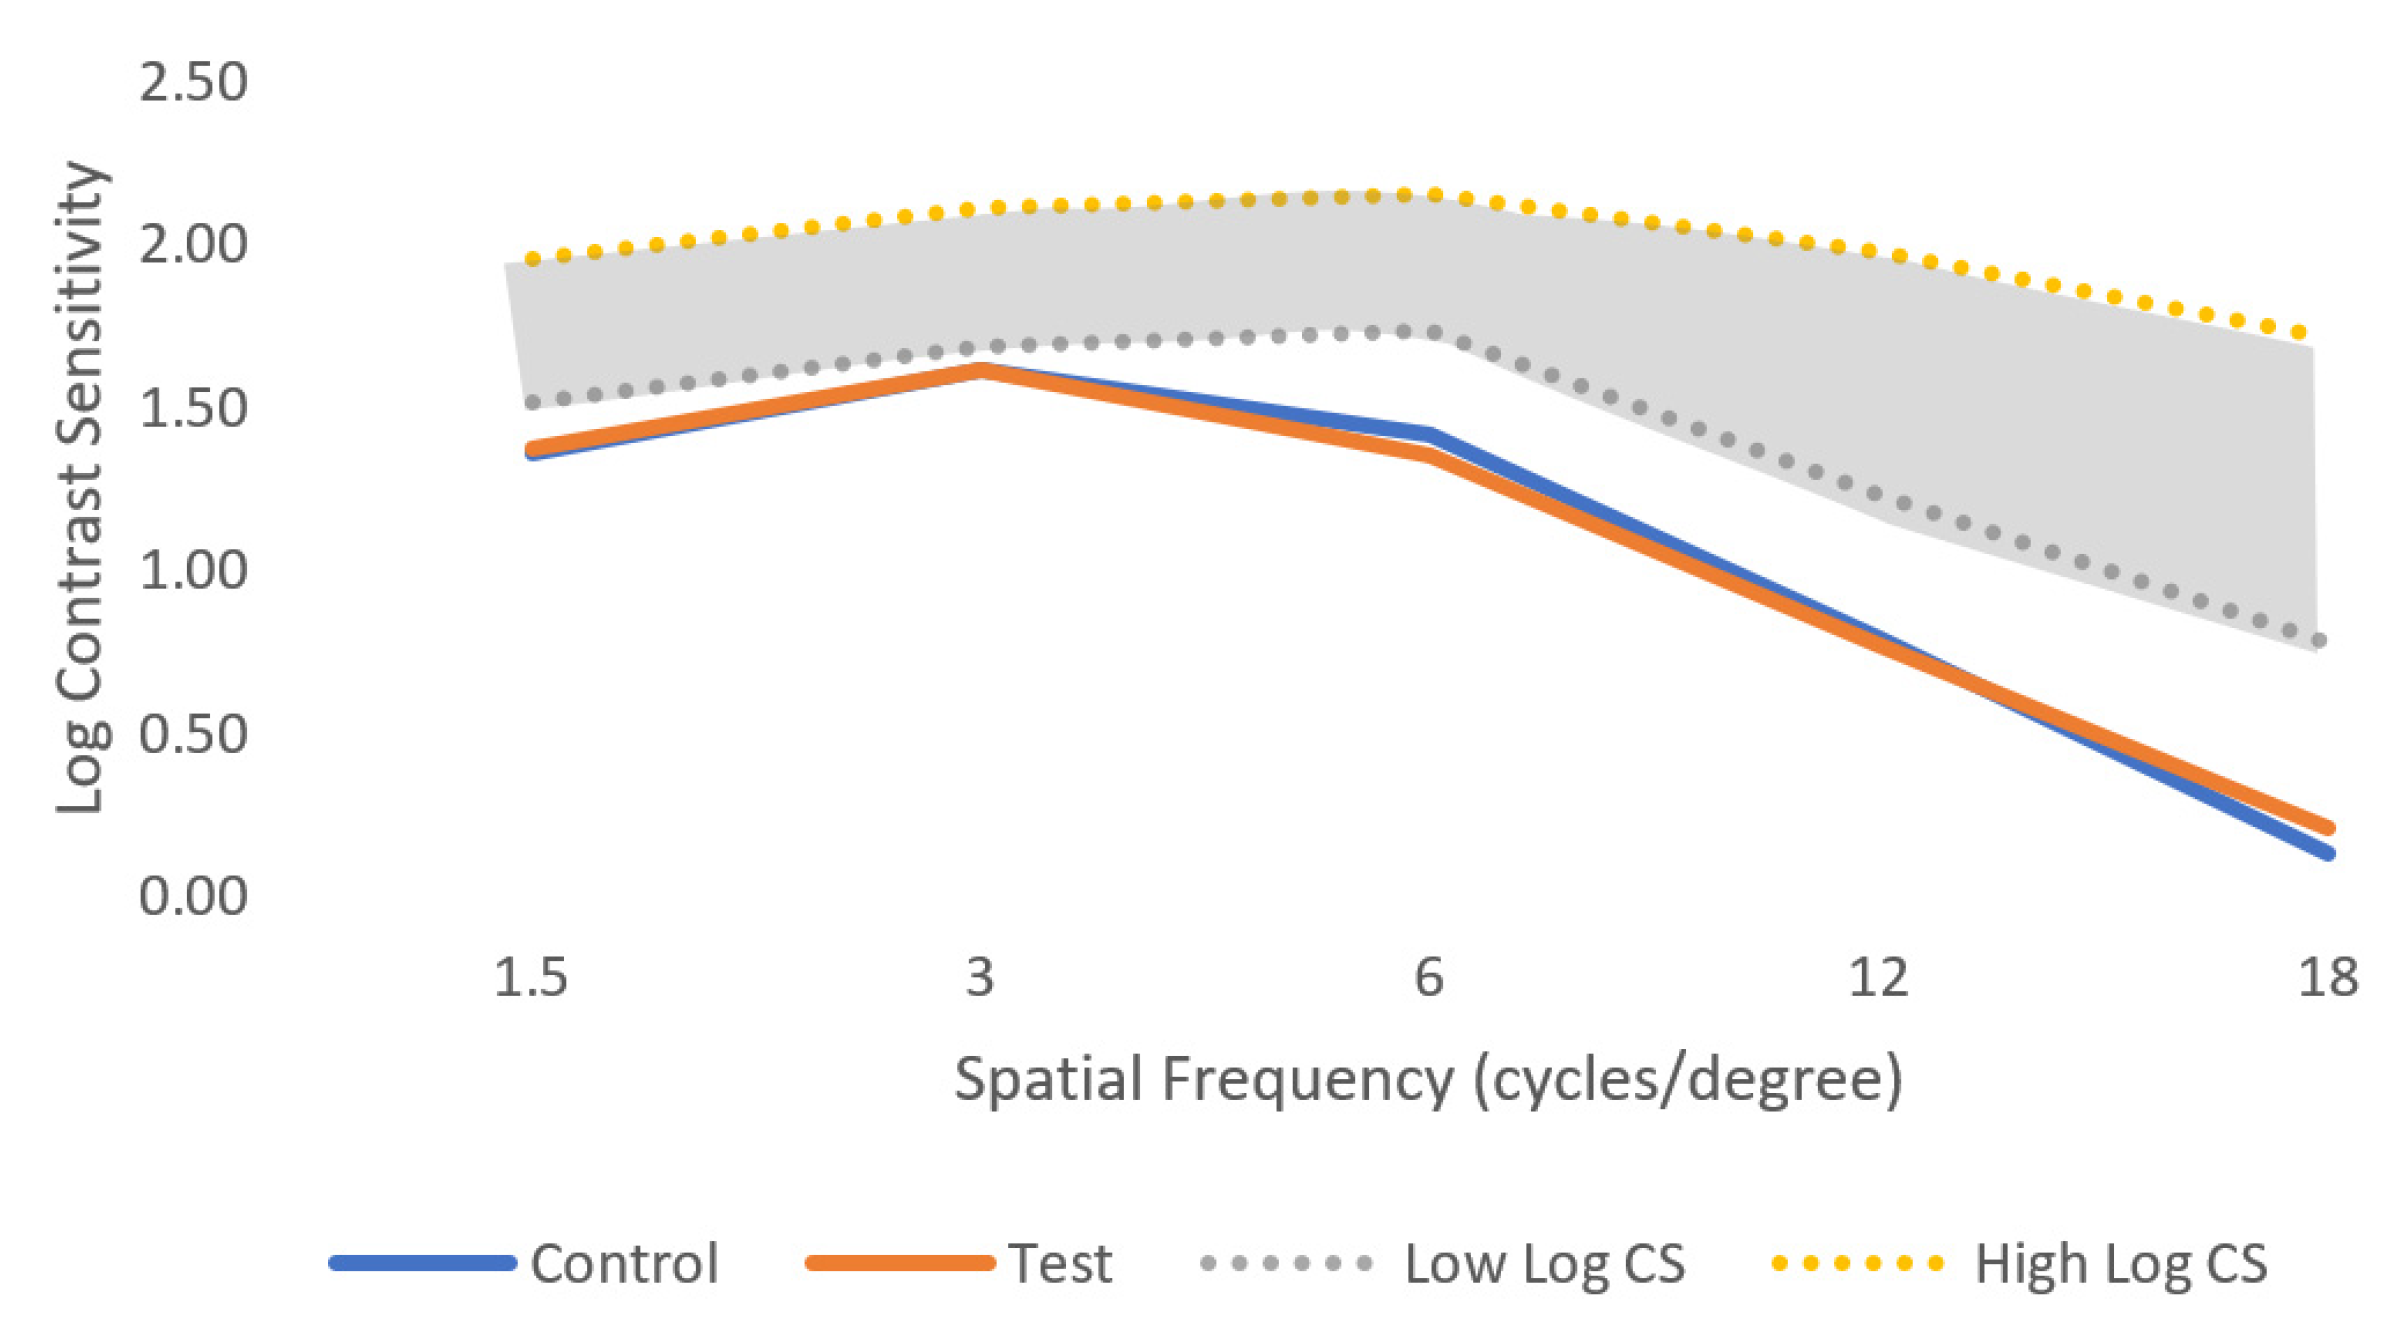
| Spatial Frequency (cpd) | Control | Test | p-Value |
|---|---|---|---|
| 1.5 | 1.36 ± 0.36 | 1.38 ± 0.38 | 0.194 |
| 3 | 1.61 ± 0.42 | 1.62 ± 0.43 | 0.322 |
| 6 | 1.42 ± 0.40 | 1.35 ± 0.39 | 0.192 |
| 12 | 0.79 ± 0.44 | 0.77 ± 0.52 | 0.844 |
| 18 | 0.13 ± 0.26 | 0.21 ± 0.31 | 0.257 |
| LDA Parameters | Control | Test | p-Value |
|---|---|---|---|
| LDI (%) | 11.60 ± 6.42 | 10.88 ± 6.10 | 0.477 + |
| BFCRad (mm) | 26.85 ± 7.37 | 26.04 ± 7.02 | 0.423 * |
| BFCIrreg (mm) | 0.53 ± 0.48 | 0.69 ± 0.57 | 0.246 + |
| BFCIrregSD (mm) | 4.00 ± 1.01 | 4.07 ± 1.69 | 0.868 + |
Disclaimer/Publisher’s Note: The statements, opinions and data contained in all publications are solely those of the individual author(s) and contributor(s) and not of MDPI and/or the editor(s). MDPI and/or the editor(s) disclaim responsibility for any injury to people or property resulting from any ideas, methods, instructions or products referred to in the content. |
© 2023 by the authors. Licensee MDPI, Basel, Switzerland. This article is an open access article distributed under the terms and conditions of the Creative Commons Attribution (CC BY) license (https://creativecommons.org/licenses/by/4.0/).
Share and Cite
Silva-Leite, S.; Amorim-de-Sousa, A.; Queirós, A.; González-Méijome, J.M.; Fernandes, P. Peripheral Refraction and Visual Function of Novel Perifocal Ophthalmic Lens for the Control of Myopia Progression. J. Clin. Med. 2023, 12, 1435. https://doi.org/10.3390/jcm12041435
Silva-Leite S, Amorim-de-Sousa A, Queirós A, González-Méijome JM, Fernandes P. Peripheral Refraction and Visual Function of Novel Perifocal Ophthalmic Lens for the Control of Myopia Progression. Journal of Clinical Medicine. 2023; 12(4):1435. https://doi.org/10.3390/jcm12041435
Chicago/Turabian StyleSilva-Leite, Sara, Ana Amorim-de-Sousa, António Queirós, José Manuel González-Méijome, and Paulo Fernandes. 2023. "Peripheral Refraction and Visual Function of Novel Perifocal Ophthalmic Lens for the Control of Myopia Progression" Journal of Clinical Medicine 12, no. 4: 1435. https://doi.org/10.3390/jcm12041435
APA StyleSilva-Leite, S., Amorim-de-Sousa, A., Queirós, A., González-Méijome, J. M., & Fernandes, P. (2023). Peripheral Refraction and Visual Function of Novel Perifocal Ophthalmic Lens for the Control of Myopia Progression. Journal of Clinical Medicine, 12(4), 1435. https://doi.org/10.3390/jcm12041435