
Could the Combination of eGFR and mGPS Facilitate the Differential Diagnosis of Age-Related Renal Decline from Diseases? A Large Study on the Population of Western Sicily
 , , ,
, , , 
Abstract
:1. Introduction
2. Methods
2.1. Study Design, Sources, and Population
2.2. Detection of Circulating Biomarkers
2.3. Statistical Analysis
3. Results
3.1. Baseline Characteristics
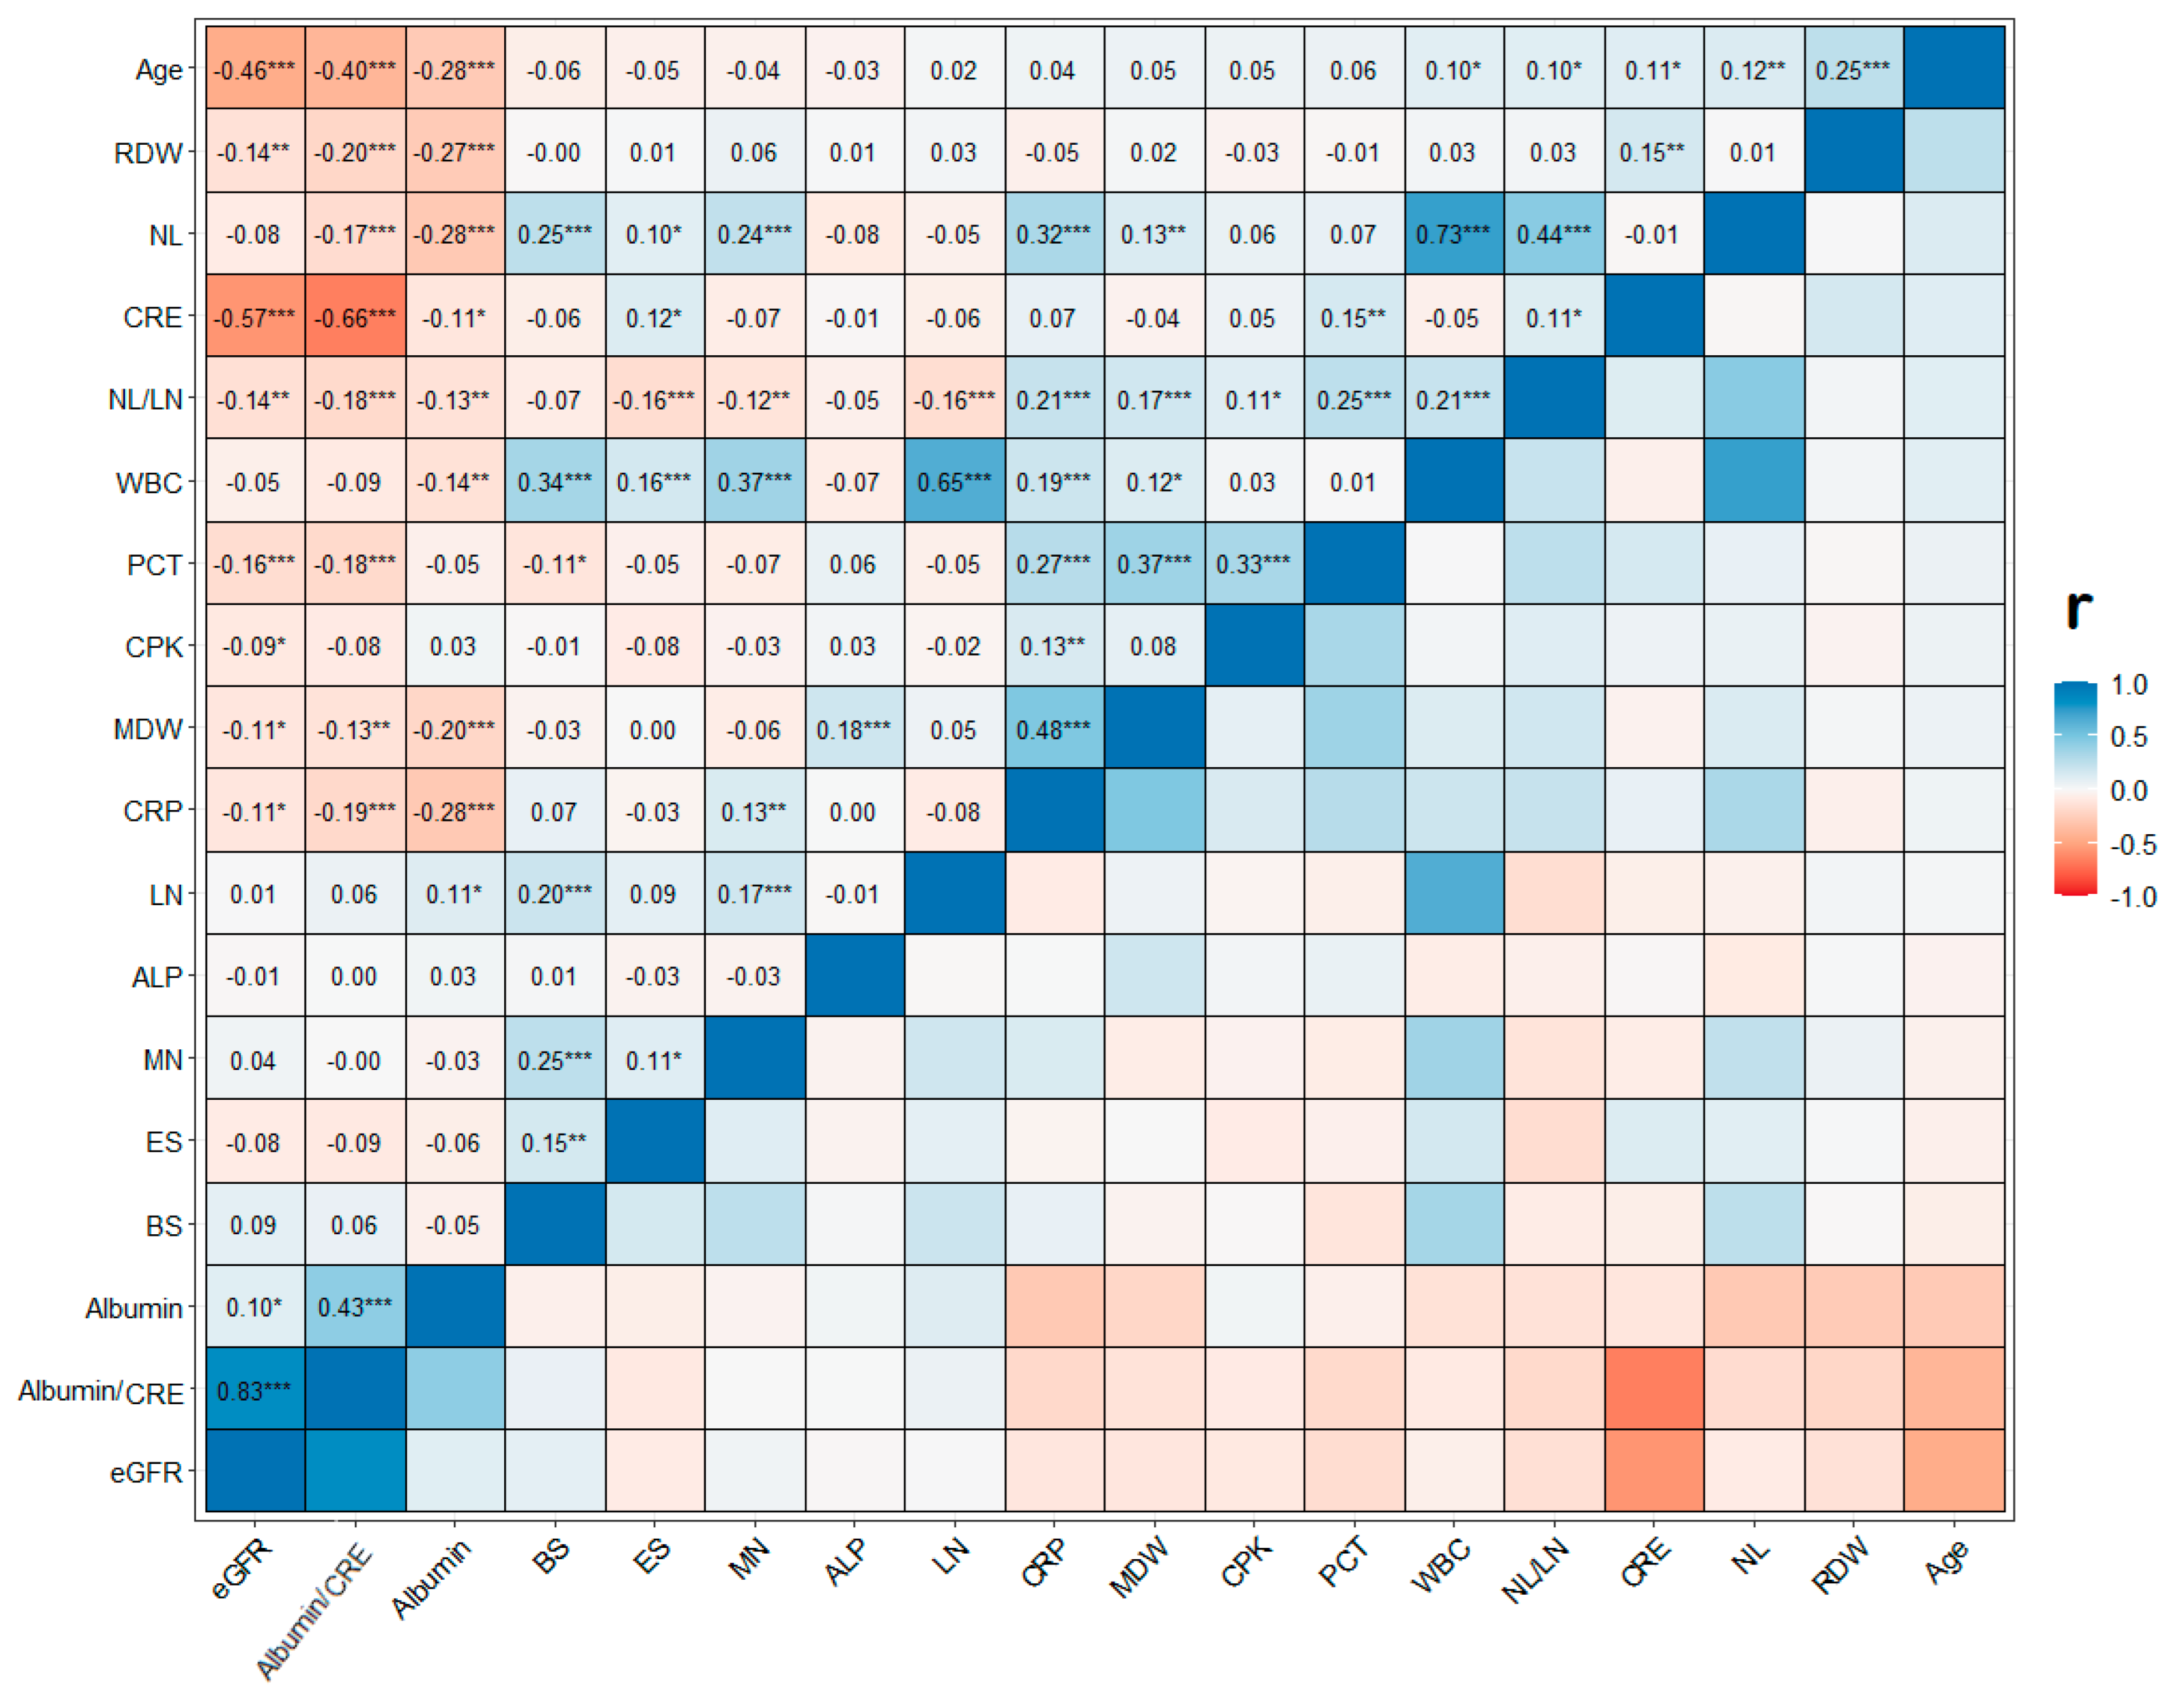
3.2. Association of eGFR with the Inflammatory and Damage Circulating Biomarkers
3.3. eGFR-Based CKD Risk Definition
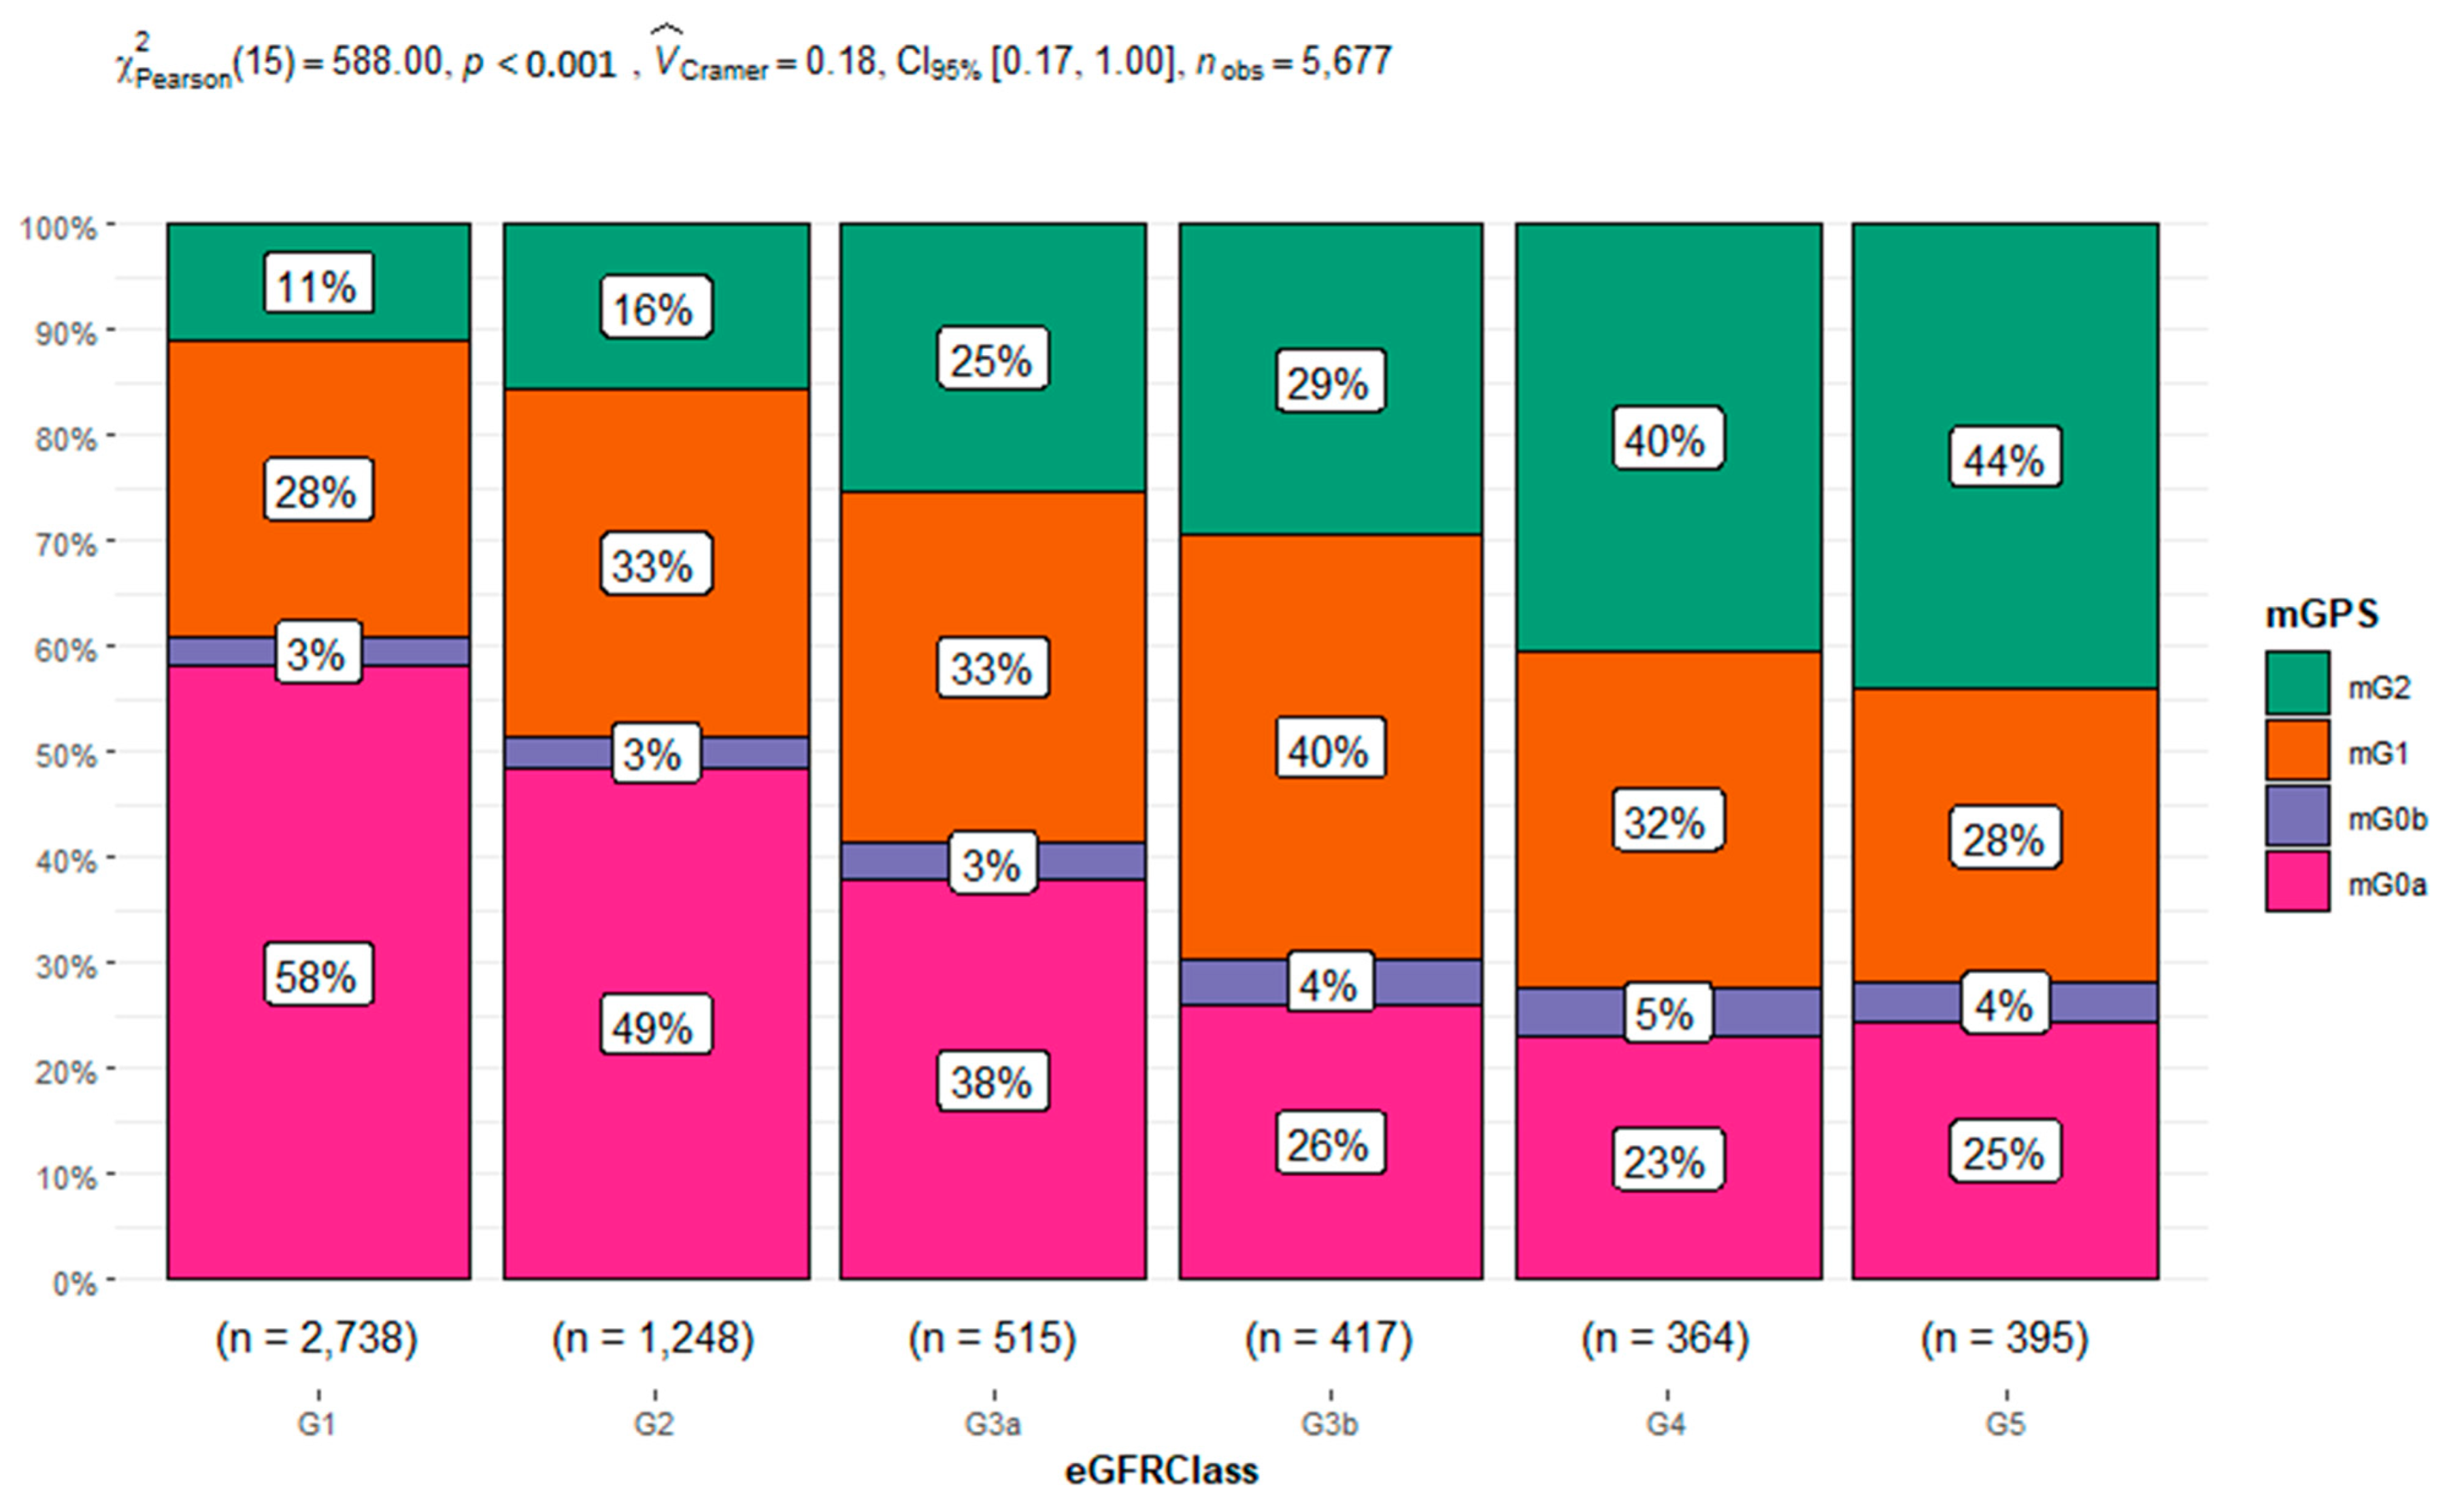
3.4. mGPS Categories and Risk for CKD in Different Age Classes
4. Discussion
5. Strengths and Limitations
6. Conclusions
Supplementary Materials
Author Contributions
Funding
Institutional Review Board Statement
Informed Consent Statement
Data Availability Statement
Conflicts of Interest
References
- van der Burgh, A.C.; Rizopoulos, D.; Ikram, M.A.; Hoorn, E.J.; Chaker, L. Determinants of the Evolution of Kidney Function with Age. Kidney Int. Rep. 2021, 6, 3054–3063. [Google Scholar] [CrossRef] [PubMed]
- Dybiec, J.; Szlagor, M.; Młynarska, E.; Rysz, J.; Franczyk, B. Structural and Functional Changes in Aging Kidneys. Int. J. Mol. Sci. 2022, 23, 15435. [Google Scholar] [CrossRef]
- Balistreri, C.R. Anti-Inflamm-Ageing and/or Anti-Age-Related Disease Emerging Treatments: A Historical Alchemy or Revolutionary Effective Procedures? Mediat. Inflamm. 2018, 2018, 3705389. [Google Scholar] [CrossRef] [PubMed]
- Levey, A.S.; Coresh, J.; Tighiouart, H.; Greene, T.; Inker, L.A. Measured and estimated glomerular filtration rate: Current status and future directions. Nat. Rev. Nephrol. 2020, 16, 51–64. [Google Scholar] [CrossRef] [PubMed]
- Inker, L.A.; Collier, W.; Greene, T.; Miao, S.; Chaudhari, J.; Appel, G.B.; Badve, S.V.; Caravaca-Fontán, F.; Del Vecchio, L.; Floege, J.; et al. A meta-analysis of GFR slope as a surrogate endpoint for kidney failure. Nat Med. 2023, 29, 1867–1876. [Google Scholar] [CrossRef] [PubMed]
- Inker, L.A.; Eneanya, N.D.; Coresh, J.; Tighiouart, H.; Wang, D.; Sang, Y.; Crews, D.C.; Doria, A.; Estrella, M.M.; Froissart, M.; et al. New Creatinine- and Cystatin C-Based Equations to Estimate GFR without Race. N. Engl. J. Med. 2021, 385, 1737–1749. [Google Scholar] [CrossRef] [PubMed]
- Levey, A.S.; Grams, M.E.; Inker, L.A. Use of eGFR in Older Adults with Kidney Disease. Reply. N. Engl. J. Med. 2022, 387, 575. [Google Scholar] [CrossRef]
- Carnevale, V.; Tinti, M.G. Use of eGFR in Older Adults with Kidney Disease. N. Engl. J. Med. 2022, 387, 574–575. [Google Scholar] [CrossRef]
- Toyama, T.; Kitagawa, K.; Oshima, M.; Kitajima, S.; Hara, A.; Iwata, Y.; Sakai, N.; Shimizu, M.; Hashiba, A.; Furuichi, K.; et al. Age differences in the relationships between risk factors and loss of kidney function: A general population cohort study. BMC Nephrol. 2020, 21, 477. [Google Scholar] [CrossRef]
- Minutolo, R.; Gabbai, F.B.; Chiodini, P.; Provenzano, M.; Borrelli, S.; Garofalo, C.; Bellizzi, V.; Russo, D.; Conte, G.; De Nicola, L.; et al. Sex Differences in the Progression of CKD Among Older Patients: Pooled Analysis of 4 Cohort Studies. Am. J. Kidney Dis. 2020, 75, 30–38. [Google Scholar] [CrossRef]
- Ravani, P.; Quinn, R.; Fiocco, M.; Liu, P.; Al-Wahsh, H.; Lam, N.; Hemmelgarn, B.R.; Manns, B.J.; James, M.T.; Joanette, Y.; et al. Association of Age With Risk of Kidney Failure in Adults With Stage IV Chronic Kidney Disease in Canada. JAMA Netw. Open 2020, 3, e2017150. [Google Scholar] [CrossRef] [PubMed]
- Liu, P.; Quinn, R.R.; Lam, N.N.; Elliott, M.J.; Xu, Y.; James, M.T.; Manns, B.; Ravani, P. Accounting for Age in the Definition of Chronic Kidney Disease. JAMA Intern. Med. 2021, 181, 1359–1366. [Google Scholar] [CrossRef] [PubMed]
- Noronha, I.L.; Santa-Catharina, G.P.; Andrade, L.; Coelho, V.A.; Jacob-Filho, W.; Elias, R.M. Glomerular filtration in the aging population. Front. Med. 2022, 9, 769329. [Google Scholar] [CrossRef] [PubMed]
- Jaques, D.A.; Vollenweider, P.; Bochud, M.; Ponte, B. Aging and hypertension in kidney function decline: A 10 year population-based study. Front. Cardiovasc. Med. 2022, 9, 1035313. [Google Scholar] [CrossRef]
- Singh-Manoux, A.; Oumarou-Ibrahim, A.; Machado-Fragua, M.D.; Dumurgier, J.; Brunner, E.J.; Kivimaki, M.; Fayosse, A.; Sabia, S. Association between kidney function and incidence of dementia: 10-year follow-up of the Whitehall II cohort study. Age Ageing 2022, 51, afab259. [Google Scholar] [CrossRef]
- Baylis, C. Sexual dimorphism in the aging kidney: Differences in the nitric oxide system. Nat. Rev. Nephrol. 2009, 5, 384–396. [Google Scholar] [CrossRef] [PubMed]
- Delanaye, P.; Jager, K.J.; Bökenkamp, A.; Christensson, A.; Dubourg, L.; Eriksen, B.O.; Gaillard, F.; Gambaro, G.; van der Giet, M.; Glassock, R.J.; et al. CKD: A call for an age-adapted definition. J. Am. Soc. Nephrol. 2019, 30, 1785–1805. [Google Scholar] [CrossRef]
- Zahorec, R. Neutrophil-to-lymphocyte ratio, past, present and future perspectives. Bratisl Lek Listy 2021, 122, 474–488. [Google Scholar] [CrossRef]
- Stefan, G.; Stancu, S.; Zugravu, A.; Capusa, C. Inflammation-based modified Glasgow prognostic score and renal outcome in chronic kidney disease patients: Is there a relationship? Intern. Med. J. 2022, 52, 968–974. [Google Scholar] [CrossRef]
- Wu, T.H.; Tsai, Y.T.; Chen, K.Y.; Yap, W.K.; Luan, C.W. Utility of High-Sensitivity Modified Glasgow Prognostic Score in Cancer Prognosis: A Systemic Review and Meta-Analysis. Int. J. Mol. Sci. 2023, 24, 1318. [Google Scholar] [CrossRef]
- Campisi, J.; Kapahi, P.; Lithgow, G.J.; Melov, S.; Newman, J.C.; Verdin, E. From discoveries in ageing research to therapeutics for healthy ageing. Nature 2019, 571, 183–192. [Google Scholar] [CrossRef]
- Yoshitomi, R.; Nakayama, M.; Sakoh, T.; Fukui, A.; Katafuchi, E.; Seki, M.; Tsuda, S.; Nakano, T.; Tsuruya, K.; Kitazono, T. High neutrophil/lymphocyte ratio is associated with poor renal outcomes in Japanese patients with chronic kidney disease. Ren. Fail. 2019, 41, 238–243. [Google Scholar] [CrossRef] [PubMed]
- Mureșan, A.V.; Russu, E.; Arbănași, E.M.; Kaller, R.; Hosu, I.; Arbănași, E.M.; Voidăzan, S.T. The Predictive Value of NLR, MLR, and PLR in the Outcome of End-Stage Kidney Disease Patients. Biomedicines 2022, 10, 1272. [Google Scholar] [CrossRef] [PubMed]
- Bowe, B.; Xie, Y.; Li, T.; Mokdad, A.H.; Xian, H.; Yan, Y.; Maddukuri, G.; Al-Aly, Z. Changes in the US Burden of Chronic Kidney Disease From 2002 to 2016: An Analysis of the Global Burden of Disease Study. JAMA Netw. Open 2018, 1, e184412. [Google Scholar] [CrossRef] [PubMed]
- Ke, C.; Liang, J.; Liu, M.; Liu, S.; Wang, C. Burden of chronic kidney disease and its risk-attributable burden in 137 low-and middle-income countries, 1990-2019: Results from the global burden of disease study 2019. BMC Nephrol. 2022, 23, 17. [Google Scholar] [CrossRef]
- Conte, C.; Antonelli, G.; Melica, M.E.; Tarocchi, M.; Romagnani, P.; Peired, A.J. Role of Sex Hormones in Prevalent Kidney Diseases. Int. J. Mol. Sci. 2023, 24, 8244. [Google Scholar] [CrossRef]
- Thurlow, J.S.; Joshi, M.; Yan, G.; Norris, K.C.; Agodoa, L.Y.; Yuan, C.M.; Nee, R. Global Epidemiology of End-Stage Kidney Disease and Disparities in Kidney Replacement Therapy. Am. J. Nephrol. 2021, 52, 98–107. [Google Scholar] [CrossRef]
- Yoo, J.H.; Kim, G.; Park, S.W.; Choi, M.S.; Ahn, J.; Jin, S.M.; Hur, K.Y.; Lee, M.K.; Kang, M.; Kim, J.H. Effects of low skeletal muscle mass and sarcopenic obesity on albuminuria: A 7-year longitudinal study. Sci. Rep. 2020, 10, 5774. [Google Scholar] [CrossRef]
- Balistreri, C.R. Promising Strategies for Preserving Adult Endothelium Health and Reversing Its Dysfunction: From Liquid Biopsy to New Omics Technologies and Noninvasive Circulating Biomarkers. Int. J. Mol. Sci. 2022, 23, 7548. [Google Scholar] [CrossRef]
- Trachtman, H. Age-Dependent Definition of CKD. J. Am. Soc. Nephrol. 2020, 31, 447. [Google Scholar] [CrossRef]
- Mihai, S.; Codrici, E.; Popescu, I.D.; Enciu, A.M.; Albulescu, L.; Necula, L.G.; Mambet, C.; Anton, G.; Tanase, C. Inflammation-Related Mechanisms in Chronic Kidney Disease Prediction, Progression, and Outcome. J. Immunol. Res. 2018, 2018, 2180373. [Google Scholar] [CrossRef] [PubMed]
- Ix, J.H.; Shlipak, M.G. The Promise of Tubule Biomarkers in Kidney Disease: A Review. Am. J. Kidney Dis. 2021, 78, 719–727. [Google Scholar] [CrossRef] [PubMed]
- Available online: https://www.beckmancoulter.com/it/products/hematology/dxh-900 (accessed on 25 November 2023).
- Available online: https://fardavar.com/ (accessed on 25 November 2023).
- Available online: https://www.biomerieux-nordic.com/product/vidasr-3 (accessed on 25 November 2023).
- Available online: https://diagnostics.roche.com/ (accessed on 25 November 2023).
- Fan, H.; Shao, Z.Y.; Xiao, Y.Y.; Xie, Z.H.; Chen, W.; Xie, H.; Qin, G.Y.; Zhao, N.Q. Comparison of the Glasgow Prognostic Score (GPS) and the modified Glasgow Prognostic Score (mGPS) in evaluating the prognosis of patients with operable and inoperable non-small cell lung cancer. J. Cancer Res. Clin. Oncol. 2016, 142, 1285–1297. [Google Scholar] [CrossRef] [PubMed]


| Characteristics | Overall | Age Classes | |||||||
|---|---|---|---|---|---|---|---|---|---|
| (18–40) | (40–60) | (60–80) | (80–100) | ||||||
| F | M | F | M | F | M | F | M | ||
| n = 57,449 | n = 9152 | n = 5637 | n = 8003 | n = 8592 | n = 8864 | n=10,883 | n = 3310 | n = 3008 | |
| eGFRClass: | |||||||||
| G1 | 32,597 (57.7%) | 8800 (97.4%) | 4640 (83.5%) | 6325 (80.1%) | 4775 (56.4%) | 4026 (46.4%) | 3193 (29.8%) | 477 (14.8%) | 361 (12.2%) |
| G2 | 13,369 (23.7%) | 190 (2.10%) | 749 (13.5%) | 1189 (15.1%) | 2627 (31.1%) | 2995 (34.5%) | 3810 (35.6%) | 1081 (33.5%) | 728 (24.7%) |
| G3a | 4255 (7.53%) | 18 (0.20%) | 72 (1.30%) | 156 (1.98%) | 496 (5.86%) | 754 (8.69%) | 1542 (14.4%) | 668 (20.7%) | 549 (18.6%) |
| G3b | 2839 (5.02%) | 11 (0.12%) | 24 (0.43%) | 81 (1.03%) | 238 (2.81%) | 429 (4.94%) | 998 (9.32%) | 532 (16.5%) | 526 (17.8%) |
| G4 | 1785 (3.16%) | 8 (0.09%) | 21 (0.38%) | 62 (0.79%) | 126 (1.49%) | 234 (2.70%) | 573 (5.35%) | 325 (10.1%) | 436 (14.8%) |
| G5 | 1664 (2.94%) | 12 (0.13%) | 51 (0.92%) | 84 (1.06%) | 198 (2.34%) | 240 (2.77%) | 588 (5.49%) | 142 (4.40%) | 349 (11.8%) |
| mGPS: | |||||||||
| mGPS0a | 2681 (47.2%) | 435 (69.7%) | 328 (63.0%) | 371 (58.3%) | 420 (52.7%) | 421 (45.0%) | 419 (36.6%) | 167 (29.1%) | 120 (27.1%) |
| mGPS0b | 179 (3.15%) | 9 (1.44%) | 9 (1.73%) | 11 (1.73%) | 22 (2.76%) | 37 (3.96%) | 45 (3.93%) | 29 (5.06%) | 17 (3.84%) |
| mGPS1 | 1743 (30.7%) | 161 (25.8%) | 159 (30.5%) | 180 (28.3%) | 254 (31.9%) | 269 (28.8%) | 411 (35.9%) | 162 (28.3%) | 147 (33.2%) |
| mGPS2 | 1072 (18.9%) | 19 (3.04%) | 25 (4.80%) | 74 (11.6%) | 101 (12.7%) | 208 (22.2%) | 271 (23.6%) | 215 (37.5%) | 159 (35.9%) |
| CRE (mg/dL) | 1.05 (1.03) | 0.65 (0.34) | 0.98 (0.79) | 0.82 (0.74) | 1.12 (1.15) | 1.03 (0.98) | 1.32 (1.28) | 1.32 (1.06) | 1.64 (1.46) |
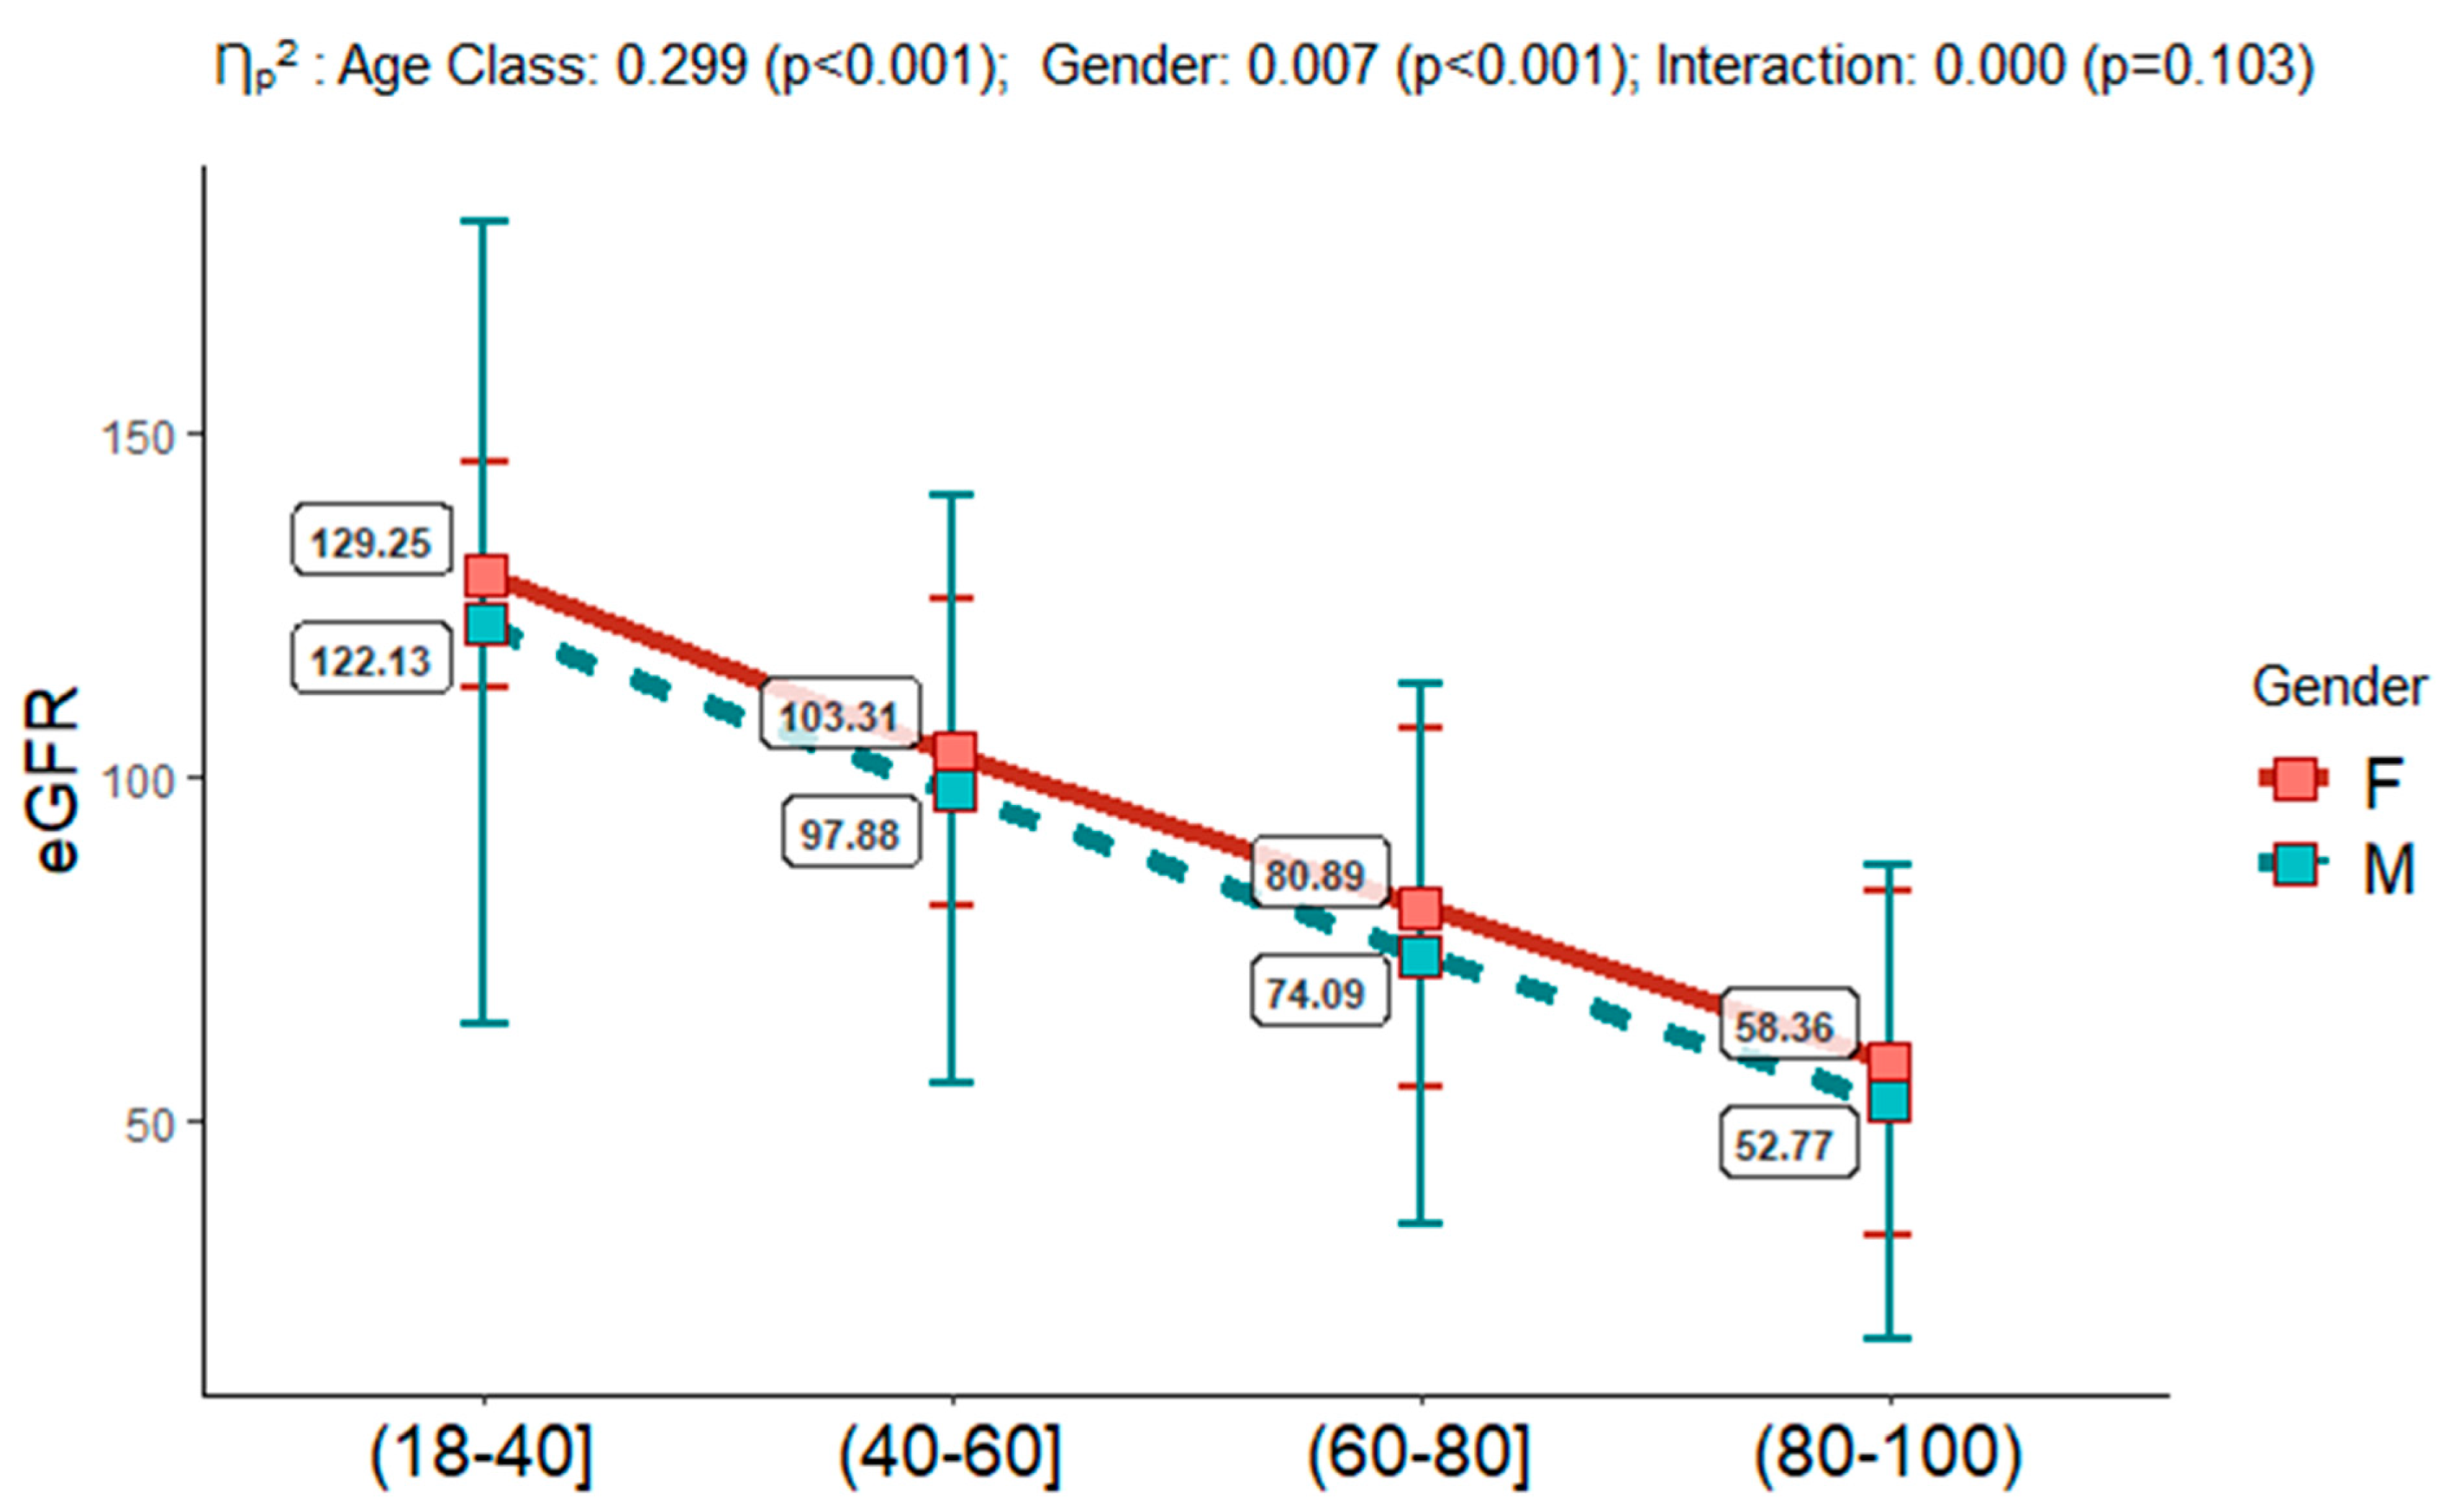
| eGFR | 94.3 (41.9) | 129 (16.5) | 122 (58.0) | 103 (22.1) | 97.9 (42.5) | 80.9 (25.8) | 74.1 (39.0) | 58.4 (25.1) | 52.8 (34.2) |
| WBC (×103/µL) | 8.99 (5.24) | 9.41 (4.95) | 9.20 (5.37) | 8.26 (4.74) | 9.07 (6.14) | 8.63 (4.79) | 8.93 (4.55) | 9.83 (5.95) | 9.46 (6.55) |
| RDW % | 14.5 (2.11) | 14.2 (1.87) | 13.5 (1.43) | 14.5 (2.24) | 14.0 (1.77) | 14.7 (2.27) | 14.7 (2.12) | 15.5 (2.47) | 15.4 (2.35) |
| NL (×103/µL) | 6.21 (4.33) | 6.62 (4.65) | 6.07 (3.70) | 5.45 (3.65) | 6.09 (5.18) | 5.94 (3.95) | 6.23 (3.83) | 7.37 (4.80) | 6.90 (5.14) |
| LN (×103/µL) | 1.92 (2.16) | 1.99 (0.80) | 2.20 (3.48) | 2.02 (1.27) | 2.05 (1.39) | 1.88 (2.53) | 1.77 (1.94) | 1.60 (3.22) | 1.62 (3.28) |
| NL/LN | 4.72(6.83) | 4.15 (4.32) | 3.86 (4.91) | 3.54 (4.33) | 4.02 (5.12) | 4.67 (6.62) | 5.32 (8.00) | 7.93 (12.7) | 7.59 (9.96) |
| MN (×103/µL) | 0.67 (0.96) | 0.64 (0.28) | 0.72 (0.57) | 0.60 (1.75) | 0.71 (0.87) | 0.62 (0.53) | 0.72 (1.06) | 0.71 (0.75) | 0.76 (1.00) |
| ES (×103/µL) | 0.14 (0.19) | 0.11 (0.16) | 0.16 (0.18) | 0.13 (0.16) | 0.16 (0.23) | 0.13 (0.17) | 0.15 (0.23) | 0.10 (0.14) | 0.13 (0.18) |
| BS (×103/µL) | 0.05 (0.08) | 0.04 (0.07) | 0.05 (0.06) | 0.05 (0.13) | 0.05 (0.05) | 0.05 (0.06) | 0.05 (0.05) | 0.05 (0.08) | 0.04 (0.06) |
| MDW (SDV) | 19.2 (3.20) | 19.3 (2.66) | 18.4 (2.81) | 18.9 (2.79) | 18.6 (3.05) | 19.5 (3.35) | 19.1 (3.30) | 20.3 (3.88) | 20.3 (4.21) |
| CRP (mg/dL) | 2.57 (5.80) | 1.36 (3.73) | 1.38 (3.93) | 1.78 (4.92) | 1.96 (5.14) | 2.85 (6.13) | 3.46 (6.79) | 4.10 (6.93) | 4.34 (7.13) |
| PCT (µg/L) | 5.55 (19.3) | 1.19 (2.75) | 1.83 (8.69) | 6.51 (22.4) | 3.67 (14.8) | 5.30 (19.1) | 6.73 (22.6) | 5.93 (16.2) | 7.77 (23.7) |
| Albumin (g/dL) | 3.95 (0.60) | 3.95 (0.47) | 4.45 (0.57) | 4.10 (0.55) | 4.10 (0.64) | 3.88 (0.62) | 3.84 (0.64) | 3.54 (0.61) | 3.53 (0.60) |
| CPK (U/L) | 202 (942) | 118 (254) | 346 (1631) | 165 (1141) | 229 (1102) | 150 (492) | 205 (765) | 183 (684) | 194 (591) |
| ALP (U/L) | 26.4 (71.1) | 18.8 (45.4) | 32.5 (90.0) | 23.7 (57.2) | 33.8 (95.0) | 24.6 (54.0) | 27.7 (72.7) | 26.1 (74.2) | 28.5 (85.1) |
| Albumin/CRE | 1.03 (2.29) | 2.80 (3.50) | 0.73 (1.88) | 1.01 (2.34) | 0.61 (1.62) | 0.73 (1.86) | 0.55 (1.45) | 0.68 (1.55) | 0.51 (1.25) |
| eGFR Class (Ref. Category G1) | Fixed Factors | OR | 95% CI | p-Value | |
|---|---|---|---|---|---|
| Lower Limit | Upper Limit | ||||
| G2 | Age Class: | ||||
| (18–40) vs. (80–100) | 0.03 | 0.03 | 0.03 | <0.001 | |
| (40–60) vs. (80–100) | 0.14 | 0.12 | 0.15 | <0.001 | |
| (60–80) vs. (80–100) | 0.39 | 0.35 | 0.42 | <0.001 | |
| Gender (F vs. M) | 0.44 | 0.42 | 0.46 | <0.001 | |
| Age Class: | |||||
| G3a | (18–40) vs. (80–100) | 0.00 | 0.00 | 0.01 | <0.001 |
| (40–60) vs. (80–100) | 0.03 | 0.03 | 0.04 | <0.001 | |
| (60–80) vs. (80–100) | 0.19 | 0.17 | 0.21 | <0.001 | |
| Gender (F vs. M) | 0.34 | 0.32 | 0.37 | <0.001 | |
| G3b | Age Class: | ||||
| (18–40) vs. (80–100) | 0.00 | 0.00 | 0.00 | <0.001 | |
| (40–60) vs. (80–100) | 0.02 | 0.02 | 0.02 | <0.001 | |
| (60–80) vs. (80–100) | 0.13 | 0.12 | 0.15 | <0.001 | |
| Gender (F vs. M) | 0.32 | 0.29 | 0.35 | <0.001 | |
| G4 | Age Class: | ||||
| (18–40) vs. (80–100) | 0.00 | 0.00 | 0.00 | <0.001 | |
| (40–60) vs. (80–100) | 0.01 | 0.01 | 0.02 | <0.001 | |
| (60–80) vs. (80–100) | 0.10 | 0.09 | 0.12 | <0.001 | |
| Gender (F vs. M) | 0.28 | 0.25 | 0.31 | <0.001 | |
| G5 | Age Class: | ||||
| (18–40) vs. (80–100) | 0.01 | 0.01 | 0.01 | <0.001 | |
| (40–60) vs. (80–100) | 0.03 | 0.03 | 0.04 | <0.001 | |
| (60–80) vs. (80–100) | 0.16 | 0.14 | 0.18 | <0.001 | |
| Gender (F vs. M) | 0.23 | 0.20 | 0.25 | <0.001 | |
| mGPS (Ref. mGPS2) | Fixed Factors | OR | 95% CI | p-Value | |
|---|---|---|---|---|---|
| Lower Limit | Upper Limit | ||||
| mGPS0a | Age Class: | ||||
| (18–40) vs. (80–100) | 22.77 | 16.20 | 32.02 | <0.001 | |
| (40–60) vs. (80–100) | 6.05 | 4.83 | 7.58 | <0.001 | |
| (60–80) vs. (80–100) | 2.34 | 1.93 | 2.84 | <0.001 | |
| Gender (F vs. M) | 1.22 | 1.05 | 1.42 | 0.009 | |
| Age Class: | |||||
| mGPS0b | (18–40) vs. (80–100) | 3.33 | 1.78 | 6.24 | <0.001 |
| (40–60) vs. (80–100) | 1.54 | 0.95 | 2.49 | 0.081 | |
| (60–80) vs. (80–100) | 1.40 | 0.95 | 2.06 | 0.092 | |
| Gender (F vs. M) | 1.02 | 0.74 | 1.41 | 0.889 | |
| mGPS1 | Age Class: | ||||
| (18–40) vs. (80–100) | 8.76 | 6.18 | 12.43 | <0.001 | |
| (40–60) vs. (80–100) | 2.96 | 2.34 | 3.73 | <0.001 | |
| (60–80) vs. (80–100) | 1.69 | 1.40 | 2.05 | <0.001 | |
| Gender (F vs. M) | 0.89 | 0.76 | 1.04 | 0.150 | |
Disclaimer/Publisher’s Note: The statements, opinions and data contained in all publications are solely those of the individual author(s) and contributor(s) and not of MDPI and/or the editor(s). MDPI and/or the editor(s) disclaim responsibility for any injury to people or property resulting from any ideas, methods, instructions or products referred to in the content. |
© 2023 by the authors. Licensee MDPI, Basel, Switzerland. This article is an open access article distributed under the terms and conditions of the Creative Commons Attribution (CC BY) license (https://creativecommons.org/licenses/by/4.0/).
Share and Cite
Carella, M.; Porreca, A.; Piazza, C.; Gervasi, F.; Magro, D.; Venezia, M.; Verso, R.L.; Vitale, G.; Agnello, A.G.; Scola, L.; et al. Could the Combination of eGFR and mGPS Facilitate the Differential Diagnosis of Age-Related Renal Decline from Diseases? A Large Study on the Population of Western Sicily. J. Clin. Med. 2023, 12, 7352. https://doi.org/10.3390/jcm12237352
Carella M, Porreca A, Piazza C, Gervasi F, Magro D, Venezia M, Verso RL, Vitale G, Agnello AG, Scola L, et al. Could the Combination of eGFR and mGPS Facilitate the Differential Diagnosis of Age-Related Renal Decline from Diseases? A Large Study on the Population of Western Sicily. Journal of Clinical Medicine. 2023; 12(23):7352. https://doi.org/10.3390/jcm12237352
Chicago/Turabian StyleCarella, Miriam, Annamaria Porreca, Cinzia Piazza, Francesco Gervasi, Daniele Magro, Marika Venezia, Raffaella Lo Verso, Giuseppe Vitale, Annalisa Giusy Agnello, Letizia Scola, and et al. 2023. "Could the Combination of eGFR and mGPS Facilitate the Differential Diagnosis of Age-Related Renal Decline from Diseases? A Large Study on the Population of Western Sicily" Journal of Clinical Medicine 12, no. 23: 7352. https://doi.org/10.3390/jcm12237352
APA StyleCarella, M., Porreca, A., Piazza, C., Gervasi, F., Magro, D., Venezia, M., Verso, R. L., Vitale, G., Agnello, A. G., Scola, L., Aronica, T. S., & Balistreri, C. R. (2023). Could the Combination of eGFR and mGPS Facilitate the Differential Diagnosis of Age-Related Renal Decline from Diseases? A Large Study on the Population of Western Sicily. Journal of Clinical Medicine, 12(23), 7352. https://doi.org/10.3390/jcm12237352