Abstract
Objective: Although the clinical outcomes for patients with ST-elevation myocardial infarction (STEMI) have improved significantly, some patients still experience poor clinical outcomes. The available risk classifications focus on the short-term outcomes, and it remains important to find high-risk features among patients with STEMI. In Japan, the 200 m walk electrocardiogram (ECG) test is widely performed before discharge. The purpose of this study was to investigate the association between the excessive increase in systolic blood pressure (SBP) following a 200 m walk and the long-term clinical outcomes in patients with STEMI. Methods: We included 680 patients with STEMI and divided those into an excessive increase in SBP group (n = 144) and a non-excessive increase in SBP group (n = 536) according to the SBP increase after a 200 m walk ECG test. We defined an excessive increase in SBP as SBP ≥ 20 mmHg either just after or 3 min after a 200 m walk ECG test. The primary endpoint consisted of major cardiovascular events (MACE), defined as the composite of all-cause death, non-fatal myocardial infarction, readmission for heart failure, and ischemia-driven target vessel revascularization. Results: The median follow-up duration was 831 days. MACE was more frequently observed in the excessive increase in SBP group (24.3%) than in the non-excessive increase in SBP group (15.1%). Multivariate Cox hazard analysis revealed that the excessive increase in SBP was significantly associated with MACE (HR 1.509, 95% CI: 1.005–2.267, p = 0.047) after controlling for multiple confounding factors. Conclusion: An excessive increase in SBP after the 200 m walk ECG test was significantly associated with MACE in patients with STEMI. The 200 m walk ECG test is simple and low-cost, but may help to identify high-risk patients with STEMI.
1. Introduction
The clinical outcomes of patients with ST-elevation myocardial infarction (STEMI) have improved significantly through the spread of primary percutaneous coronary intervention (PCI), intensive care units, and optimal medical therapy [1,2]. However, some patients still experience poor clinical outcomes [3]. Although some patients with STEMI have been classified as high-risk according to well-known risk scores such as the Global Registry of Acute Coronary Events (GRACE) score or the Thrombolysis in Myocardial Infarction (TIMI) risk score, the available classifications focus on the short-term outcomes rather than the long-term outcomes [4,5,6]. Therefore, it is still important to find high-risk features for the improvement of mid-term or long-term clinical outcomes in patients with STEMI.
In Japan, the 200 m (and 500 m) walk electrocardiogram (ECG) tests are widely performed during hospital stays for acute myocardial infarction (AMI) [7]. The primary purpose of these ECG tests is to identify patients with residual ischemia prior to hospital discharge. However, a slow gait speed during 200 m walk test is also reported to be associated with an increased risk of cardiovascular events [8]. Although the excessive increase in blood pressure is one of the criteria for unsuccessful 200 m (and 500 m) walk ECG tests [7,9], it remains unclear whether an excessive increase in blood pressure after a 200 m walk has an impact on long-term outcomes in patients with STEMI. The purpose of this retrospective study was to investigate the association between the excessive increase in blood pressure following the 200 m walk test and the long-term clinical outcomes in patients with STEMI.
2. Methods
We reviewed all patients with AMI who were treated at our institution (Saitama Medical Center, Jichi Medical University) between January 2015 and December 2021. The inclusion criterion was (1) patients with AMI. The exclusion criteria were as follows: (1) patients with non-ST elevation myocardial infarction; (2) patients who did not undergo primary PCI for the culprit lesion; (3) patients who underwent cardiac surgery, such as CABG; (4) patients who could not walk the 200 m distance during index hospitalization; (5) patients who had missing data on blood pressure levels before and after the 200 m ECG test; and (6) a second or more than second STEMI during the study period, i.e., when a patient experienced ≥2 STEMI during the study period.
The 200 m walk ECG tests were performed by registered nurses in general cardiology wards. Patients were instructed to walk 2 laps down the 50 m corridor in general cardiology wards at their own pace. Patients wore an ECG monitor during the walk. The 12-leads ECG and vital signs were registered by nurses at 3 points (before the test, just after the test, and 3 min after the test). We defined an excessive increase in systolic blood pressure (SBP) as an increase in the SBP to ≥20 mmHg just after or 3 min after 200 m walk ECG test. The patients involved in the study were divided into an excessive increase in SBP group and a non-excessive increase in SBP group according to the SBP increase just after or 3 min after the 200 m walk ECG test. The primary endpoint was a major cardiovascular event (MACE), defined as the composite of all-cause death, non-fatal myocardial infarction, readmission for heart failure, and ischemia-driven target vessel revascularization. Information regarding the above clinical outcomes was acquired from hospital records. The day of the 200 m walk ECG test was defined as the index day (day 1). The patients were followed until the point of MACE or until the study’s end date (26 December 2022). This study was approved by the institutional review board of the Saitama Medical Center, Jichi Medical University (S23-036), and written informed consent was waived because of the retrospective study design. The data collection and storage were performed anonymously, according to the guidelines of the Japan Ministry of Health, Labour, and Welfare.
2.1. Definitions
AMI was defined according to the universal definition [10]. Diagnostic ST elevation was defined as new ST elevation at the J point in at least two contiguous leads of 2 mm (0.2 mV), and the AMI patients with ST elevation were diagnosed as STEMI [11,12]. The definitions of hypertension, diabetes mellitus, and dyslipidemia were described elsewhere [13,14]. We used the laboratory data recorded at admission. Since we were unable to measure some laboratory data, such as HbA1c and low-density lipoprotein (LDL) cholesterol levels, during off hours (night or holidays), we substituted the earliest HbA1c or LDL cholesterol levels recorded since admission for the laboratory data [15]. Left ventricular ejection fraction (LVEF) was measured by transthoracic echocardiography during the index hospitalization. LVEF was calculated through either the modified Simpson’s method, the Teichholz method, or eyeball estimation [16]. The Teichholz method was adopted only when the modified Simpson’s method was not available. An eyeball estimation was adopted only when both the modified Simpson’s method and the Teichholz method were unavailable. We also calculated the estimated glomerular filtration rate (eGFR) using serum creatinine (Cr), age, weight, and gender according to the following formula: eGFR = 194 × Cr−1.094 × age−0.287 (male), or eGFR = 194 × Cr−1.094 × age−0.287 × 0.739 (female). The initial thrombolysis in myocardial infarction (TIMI) flow grade and final TIMI flow grade were recorded according to coronary angiography [17].
2.2. Statistical Analysis
The Shapiro–Wilk test was performed to determine whether the continuous variables were normally distributed or not. Data are presented as percentages for categorical variables, means ± standard deviations (SDs) for normally distributed continuous variables, and medians (quartile 1–quartile 3) for nonparametric variables. Categorical variables are presented as numbers (percentage), and were compared using the Chi-square test. Normally distributed continuous variables were compared using the Student t-test. Otherwise, continuous variables were compared using the Mann–Whitney U test. Event-free survival curves were constructed using the Kaplan–Meier method, and the statistical differences between curves were assessed by the log-rank test. We also performed a multivariate Cox hazard analysis to investigate the association between excessive increases in SBP and MACE after controlling for confounding factors. In this model, MACE was adopted as a dependent variable. Variables that were significantly different (p < 0.05) between the excessive increase in SBP group and the non-excessive increase in SBP group were included as independent variables in the model. The hazard ratios and 95% confidence intervals (CI) were calculated. A p value < 0.05 was considered statistically significant. All analyses were performed using statistical software, i.e., SPSS 25/Windows (SPSS, Chicago, IL, USA).
3. Results
From January 2015 to December 2021, a total of 1966 patients with AMI were admitted to our medical center. After excluding 1286 patients who met the exclusion criteria, the final study population consisted of 680 patients with STEMI. They were divided into an excessive increase in SBP group (n = 144) and a non-excessive increase in SBP group (n = 536). The study’s flow chart is shown in Figure 1.
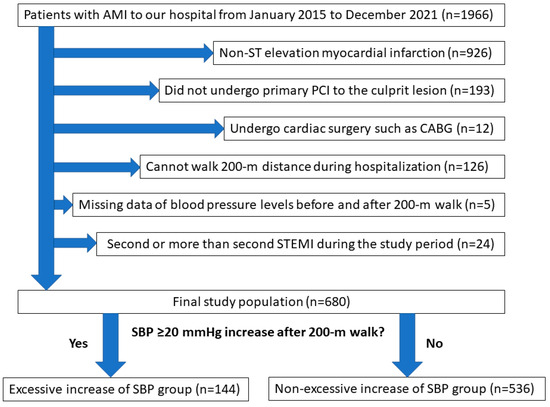
Figure 1.
Study flowchart. Abbreviations: AMI = acute myocardial infarction, PCI = percutaneous coronary intervention, CABG = coronary artery bypass graft surgery, SBP = systolic blood pressure.
A comparison of characteristics between the patients in the two groups is shown in Table 1. The median age was significantly older in the excessive increase in SBP group than in the non-excessive increase in SBP group. The peak creatine kinase (CK) and the creatine kinase–myocardial band (CK-MB) were significantly lower in the excessive increase in SBP group than in the non-excessive increase in SBP group. BNP was significantly higher in the excessive increase in SBP group than in the non-excessive increase in SBP group. Diuretics were more frequently prescribed on the day of the 200 m walk ECG test in the excessive increase in SBP group than in the non-excessive increase in SBP group. The SBP before the 200 m walk ECG test was similarly controlled between the two groups.

Table 1.
Comparison of patient’s characteristics between the excessive increase in SBP group and the non-excessive increase in SBP group.
Table 2 shows the comparison of lesion and procedural findings between the two groups. The characteristics of the lesions were similar between the two groups. Non-invasive positive pressure ventilation (NPPV) was more frequently used in the excessive increase in SBP group than in the non-excessive increase in SBP group. The other procedural characteristics were not different between the two groups.
Table 2.
Comparison of lesion and procedural characteristics between the excessive increase in SBP group and the non-excessive increase in SBP group.
Table 3 shows a comparison of the clinical outcomes between the two groups. The median follow-up duration was 831 days (Q1: 263 days–Q3: 1530 days). Figure 2 shows the Kaplan–Meier curves for MACE-free survival between the two groups. MACE was more frequently observed in the excessive increase in SBP group than in the non-excessive increase in SBP group. The multivariate Cox hazard analysis is shown in Table 4. An excessive increase in SBP was significantly associated with MACE (HR 1.509, 95% CI: 1.005–2.267, p = 0.047) after controlling for age, eGFR, peak CK, use of diuretics on the day of the 200 m walk ECG test, and use of NPPV.
Table 3.
Comparison of clinical outcomes between the excessive increase in SBP group and the non-excessive increase in SBP group.
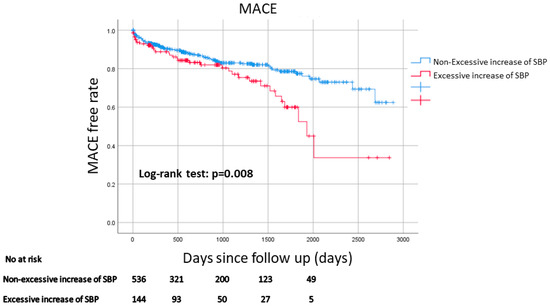
Figure 2.
Kaplan–Meier curves for MACE-free survival between the excessive increase in SBP group and the non-excessive increase in SBP group. A log-rank test was used. Abbreviations: MACE = major cardiovascular events.
Table 4.
Univariate and multivariate Cox hazard analysis to predict MACE.
4. Discussion
The main findings of this study are as follows: (1) We followed up on 680 patients with STEMI after hospital discharge with a median duration of 831 days, and found that MACEs were more frequently observed in the excessive increase in SBP group than in the non-excessive increase in SBP group, and (2) the multivariate Cox hazard analysis revealed that an excessive increase in SBP after the 200 m walk test was significantly associated with MACE after controlling for multiple confounding factors. Our results suggest that the excessive increase in SBP may be one of predictors of poor clinical outcomes in patients with STEMI.
Specific literature regarding the 200 m walk ECG test in patients with AMI is sparse, but there are several studies regarding the blood pressure response after stress tests in patients with AMI or coronary artery disease. Kato et al. conducted a treadmill exercise test for 217 patients with AMI at an average of 9.3 weeks after AMI, and defined an abnormal post-exercise SBP response as a ratio of SBP at 3 min of recovery to peak exercise of 0.9 or more [18]. An abnormal post-exercise SBP response was significantly associated with cardiac death [18]. This finding was in line with our results, although we focused on long-term outcomes. Huang et al. included 3054 patients with suspected coronary artery disease who underwent exercise treadmill tests, and they defined a paradoxical SBP increase as an SBP at 3 min of recovery equal to or higher than that at 1 min of recovery [19]. They found that the combination of an ischemic ST-segment change and a paradoxical SBP increase were associated with long-term mortality [19]. Although they adopted a combination of ischemic ECG changes and an SBP increase, we adopted an SBP increase alone, because an ischemic ST-change after exercise is an established risk factor for clinical outcomes. Hashimoto et al. investigated the mechanism of abnormal SBP response during exercise recovery in patients with angina pectoris [20]. Their finding was also in line with our results. However, their study population consisted of patients with angina pectoris, whereas our study population comprised patients with STEMI. They inserted a Swan–Ganz catheter during bicycle ergometric studies, and concluded that an abnormal SBP response after exercise is indicative of severe myocardial ischemia and may be caused by an increase in stroke volume due to recovery from myocardial ischemia [20]. However, these studies were conducted before the development of drug-eluting stents or primary PCI, while all patients in our study underwent primary PCI for the culprit lesion of STEMI. Furthermore, the energy intensity for the 200 m walk test at the patient’s own pace is supposed to be mild (2–3 METs). The meaning of an excessive increase in SBP after 200 m walk ECG test would be different from that of the SBP response after a treadmill exercise test.
We should discuss why the excessive increase in SBP after the 200 m walk test was associated with long-term MACE. A possible explanation is increased arterial stiffness. Sung et al. reported an association between a higher SBP during exercise treadmill test and high brachial-ankle pulse wave velocity, which is an indicator of arterial stiffness, in normotensive persons [21]. Although the baseline SBP prior to the 200 m walk test was similar between the two groups, the mean age was significantly higher in the excessive increase in SBP group than in the non-excessive increase in SBP group. Advanced age is strongly associated with increased arterial stiffness [22]. Another mechanism is the baroreflex failure, which results in excessive fluctuations of arterial blood pressure [23]. Veronese et al. reported that orthostatic hypertension was a predictor of all-cause mortality in elderly patients [24]. Therefore, arterial stiffness and baroreflex failure might be possible reasons for the association between the excessive increase in SBP after a 200 m walk test and long-term MACE in patients with STEMI.
There are several potential confounding factors, including age, eGFR, BNP, peak CK, use of diuretics, and the need for NPPV. Although all these factors, except for BNP, were included as variables in our multivariate Cox hazard analysis, we should discuss the association of each factor with excessive SBP increase. As mentioned in the previous paragraph, age is strongly associated with increased arterial stiffness [22], which results in excessive SBP change. Estimated GFR is inversely associated with age, because the calculating formula for eGFR includes age. Higher levels of BNP, use of diuretics, and the need for NPPV were more frequently observed in the excessive increase in SBP group than in the non-excessive increase in SBP group, which suggests the presence of heart failure as a potential reason for the excessive increase in SBP. Interestingly, peak CK levels were lower in the excessive increase in SBP group than in the non-excessive increase in SBP group. These findings suggest that an excessive increase in SBP is not associated with myocardial damage caused by STEMI, but with the presence of heart failure.
The clinical implications of the present study should be noted. Although the 200 m walk ECG test is recommended for patients with AMI by the Japanese Circulation Society [7], there have been few studies to support the usefulness of the 200 m walk ECG test [8]. In comparison with traditional treadmill ECG tests, the 200 m walk ECG test does not require special equipment. Furthermore, since a 200 m walk at the patient’s own pace is equivalent to daily physical activity, the risk associated with the 200 m walk ECG test is minimal. We can identify a high-risk group according to information on SBP during a 200 m walk ECG test without additional cost. A careful follow-up may be required for those high-risk patients who show excessive increases in SBP after 200 m walk test. Our findings cannot provide sufficient evidence to change clinical practice beyond current guidelines. The main limitation is that the 200 m walk ECG test is not widely performed after AMI, except in Japan. Our study may become a springboard for the development of the 200 m walk ECG test after AMI outside of Japan.
Several limitations of this study need to be mentioned. As this study was a single-center, retrospective study, there is a potential selection bias. Each patient underwent the 200 m walk ECG test at a different time. The timing of the 200 m walk ECG test may have led to bias, while the medications, apart from diuretics, were similar at the time of the 200 m walk ECG test between the two groups. Although we identified the risk of an excessive increase in SBP after a 200 m walk ECG test, it is uncertain whether we should administer antihypertensive medications to patients who show excessive increases in SBP. Furthermore, we excluded patients who could not walk a 200 m distance or who died before the day of the 200 m walk test. In other words, we might have excluded the most severe STEMI patients from this study. Finally, ambulatory blood pressure monitoring, which can provide useful information regarding blood pressure variability, was not conducted in this study.
5. Conclusions
An excessive increase in SBP after 200 m walk ECG test was significantly associated with MACE after hospital discharge in patients with STEMI. The 200 m walk ECG test is simple and low-cost, but may help to identify high-risk groups among patients with STEMI.
Author Contributions
Conceptualization: T.Y. and K.S.; data curation: T.Y. and K.S.; formal analysis: T.Y. and K.S.; investigation: T.Y., K.S., H.J., Y.T. (Yousuke Taniguchi), T.T., M.H., Y.T. (Yusuke Tamanaha), T.K., Y.W., K.Y., M.S. and H.F.; methodology: T.Y. and K.S.; writing—original draft: T.Y. and K.S.; writing—review and editing: T.Y., K.S., H.J., Y.T. (Yousuke Taniguchi), T.T., M.H., Y.T. (Yusuke Tamanaha), T.K., Y.W., K.Y., M.S. and H.F.; supervision: K.S. and H.F. All authors have read and agreed to the published version of the manuscript.
Funding
This research received no external funding.
Institutional Review Board Statement
The institutional review board of Jichi Medical University approved this study (S23-036).
Informed Consent Statement
Written informed consent was waived because of the retrospective study design. Instead, an opt-out-style announcement of the outline of the present study was posted on the website of the Saitama Medical Center, Jichi Medical University.
Data Availability Statement
The data that support the findings of this study are available from the corresponding author upon reasonable request.
Conflicts of Interest
Dr. Sakakura has received speaking honoraria from Abbott Vascular, Boston Scientific, Medtronic Cardiovascular, Terumo, OrbusNeich, Japan Lifeline, Kaneka, and NIPRO. Dr. Jinnouchi has received speaking honoraria from Abbott Vascular. Prof. Fujita has served as a consultant for Mehergen Group Holdings, Inc.
References
- Keeley, E.C.; Boura, J.A.; Grines, C.L. Primary angioplasty versus intravenous thrombolytic therapy for acute myocardial infarction: A quantitative review of 23 randomised trials. Lancet 2003, 361, 13–20. [Google Scholar] [CrossRef] [PubMed]
- Lee, T.H.; Goldman, L. The Coronary Care Unit Turns 25: Historical Trends and Future Directions. Ann. Intern. Med. 1988, 108, 887–894. [Google Scholar] [CrossRef]
- Numasawa, Y.; Sawano, M.; Miyata, H.; Ueda, I.; Noma, S.; Suzuki, M.; Kuno, T.; Kodaira, M.; Maekawa, Y.; Fukuda, K.; et al. Outcomes After Percutaneous Coronary Intervention of Acute Coronary Syndrome Complicated with Cardiopulmonary Arrest (from a Japanese Multicenter Registry). Am. J. Cardiol. 2017, 119, 1173–1178. [Google Scholar] [CrossRef]
- Morrow, D.A.; Antman, E.M.; Charlesworth, A.; Cairns, R.; Murphy, S.A.; de Lemos, J.A.; Giugliano, R.P.; McCabe, C.H.; Braunwald, E. TIMI risk score for ST-elevation myocardial infarction: A convenient, bedside, clinical score for risk assessment at presentation: An intravenous nPA for treatment of infarcting myocardium early II trial substudy. Circulation 2000, 102, 2031–2037. [Google Scholar] [CrossRef] [PubMed]
- Mehta, R.H.; O’neill, W.W.; Harjai, K.J.; Cox, D.A.; Brodie, B.R.; Boura, J.; Grines, L.; Stone, G.W.; Grines, C.L. Prediction of One-Year Mortality Among 30-Day Survivors After Primary Percutaneous Coronary Interventions. Am. J. Cardiol. 2006, 97, 817–822. [Google Scholar] [CrossRef] [PubMed]
- Granger, C.B.; Goldberg, R.J.; Dabbous, O.; Pieper, K.S.; Eagle, K.A.; Cannon, C.P.; Van de Werf, F.; Avezum, Á.; Goodman, S.G.; Flather, M.D.; et al. Predictors of Hospital Mortality in the Global Registry of Acute Coronary Events. Arch. Intern. Med. 2003, 163, 2345–2353. [Google Scholar] [CrossRef]
- Kimura, K.; Kimura, T.; Ishihara, M.; Nakagawa, Y.; Nakao, K.; Miyauchi, K.; Sakamoto, T.; Tsujita, K.; Hagiwara, N.; Miyazaki, S.; et al. JCS 2018 Guideline on Diagnosis and Treatment of Acute Coronary Syndrome. Circ. J. 2019, 83, 1085–1196. [Google Scholar] [CrossRef]
- Matsuzawa, Y.; Konishi, M.; Akiyama, E.; Suzuki, H.; Nakayama, N.; Kiyokuni, M.; Sumita, S.; Ebina, T.; Kosuge, M.; Hibi, K.; et al. Association Between Gait Speed as a Measure of Frailty and Risk of Cardiovascular Events After Myocardial Infarction. J. Am. Coll. Cardiol. 2013, 61, 1964–1972. [Google Scholar] [CrossRef] [PubMed]
- Ohashi, J.; Sakakura, K.; Sasaki, W.; Taniguchi, Y.; Kani, K.; Yamamoto, K.; Tsukui, T.; Seguchi, M.; Wada, H.; Momomura, S.-I.; et al. Usefulness of 500-m walk electrocardiogram test on clinical outcomes in patients with ST-segment elevation myocardial infarction. Heart Vessels 2021, 36, 48–57. [Google Scholar] [CrossRef]
- Thygesen, K.; Alpert, J.S.; Jaffe, A.S.; Chaitman, B.R.; Bax, J.J.; Morrow, D.A.; White, H.D.; The Executive Group on behalf of the Joint European Society of Cardiology (ESC). Fourth Universal Definition of Myocardial Infarction (2018). J. Am. Coll. Cardiol. 2018, 72, 2231–2264. [Google Scholar] [CrossRef]
- Aono-Setoguchi, H.; Sakakura, K.; Jinnouchi, H.; Taniguchi, Y.; Tsukui, T.; Watanabe, Y.; Yamamoto, K.; Seguchi, M.; Wada, H.; Fujita, H. Factors associated with intensive care unit delirium in patients with acute myocardial infarction. Heart Vessels 2023, 38, 478–487. [Google Scholar] [CrossRef]
- Kasahara, T.; Sakakura, K.; Hori, N.; Jinnouchi, H.; Taniguchi, Y.; Tsukui, T.; Watanabe, Y.; Yamamoto, K.; Seguchi, M.; Wada, H.; et al. Comparison of in-hospital outcomes of acute myocardial infarction between patients with cardiogenic shock and with cardiac arrest. Heart Vessels 2022, 38, 139–146. [Google Scholar] [CrossRef]
- Murakami, T.; Sakakura, K.; Taniguchi, Y.; Yamamoto, K.; Tsukui, T.; Seguchi, M.; Jinnouchi, H.; Wada, H.; Fujita, H. Comparison of the cost in percutaneous coronary intervention between ST-segment elevation myocardial infarction vs. non-ST-segment elevation myocardial infarction. Cardiovasc. Interv. Ther. 2022, 37, 293–303. [Google Scholar] [CrossRef] [PubMed]
- Narita, M.; Sakakura, K.; Taniguchi, Y.; Yamamoto, K.; Tsukui, T.; Seguchi, M.; Jinnouchi, H.; Wada, H.; Fujita, H. Factors associated with aorto-ostial stent coverage during intravascular ultrasound-guided percutaneous coronary intervention to severely narrowed non-ostial right coronary artery lesions. Adv. Interv. Cardiol. 2021, 17, 163–169. [Google Scholar] [CrossRef] [PubMed]
- Otani, A.; Sakakura, K.; Yamamoto, K.; Taniguchi, Y.; Ito, M.; Ibe, T.; Wada, H.; Momomura, S.-I.; Fujita, H. Comparison of mid-term clinical outcomes after acute myocardial infarction in diabetic men between living alone and living together. Heart Vessels 2019, 34, 1288–1296. [Google Scholar] [CrossRef] [PubMed]
- Ban, S.; Sakakura, K.; Jinnouchi, H.; Taniguchi, Y.; Tsukui, T.; Watanabe, Y.; Yamamoto, K.; Seguchi, M.; Wada, H.; Fujita, H. Association of Asymptomatic Low Ankle–Brachial Index with Long-Term Clinical Outcomes in Patients after Acute Myocardial Infarction. J. Atheroscler. Thromb. 2022, 29, 992–1000. [Google Scholar] [CrossRef]
- Matsuo, S.; Imai, E.; Horio, M.; Yasuda, Y.; Tomita, K.; Nitta, K.; Yamagata, K.; Tomino, Y.; Yokoyama, H.; Hishida, A.; et al. Revised Equations for Estimated GFR From Serum Creatinine in Japan. Am. J. Kidney Dis. 2009, 53, 982–992. [Google Scholar] [CrossRef]
- Kato, K.; Saito, F.; Hatano, K.; Noda, S.; Tsuzuki, J.; Yokota, M.; Hayashi, H.; Saito, H.; Sotobata, I. Prognostic value of abnormal postexercise systolic blood pressure response: Prehospital discharge test after myocardial infarction in Japan. Am. Heart J. 1990, 119 Pt 1, 264–271. [Google Scholar] [CrossRef]
- Huang, C.-L.; Su, T.-C.; Chen, W.-J.; Lin, L.-Y.; Wang, W.-L.; Feng, M.-H.; Liau, C.-S.; Lee, Y.-T.; Chen, M.-F. Usefulness of Paradoxical Systolic Blood Pressure Increase After Exercise as a Predictor of Cardiovascular Mortality. Am. J. Cardiol. 2008, 102, 518–523. [Google Scholar] [CrossRef]
- Hashimoto, M.; Okamoto, M.; Yamagata, T.; Yamane, T.; Watanabe, M.; Tsuchioka, Y.; Matsuura, H.; Kajiyama, G. Abnormal systolic blood pressure response during exercise recovery in patients with angina pectoris. J. Am. Coll. Cardiol. 1993, 22, 659–664. [Google Scholar] [CrossRef]
- Sung, J.; Choi, S.H.; Choi, Y.-H.; Kim, D.-K.; Park, W.H. The relationship between arterial stiffness and increase in blood pressure during exercise in normotensive persons. J. Hypertens. 2012, 30, 587–591. [Google Scholar] [CrossRef] [PubMed]
- Kim, J.; Cha, M.-J.; Lee, D.H.; Lee, H.S.; Nam, C.M.; Nam, H.S.; Kim, Y.D.; Heo, J.H. The association between cerebral atherosclerosis and arterial stiffness in acute ischemic stroke. Atherosclerosis 2011, 219, 887–891. [Google Scholar] [CrossRef] [PubMed]
- Ketch, T.; Biaggioni, I.; Robertson, R.; Robertson, D. Four faces of baroreflex failure: Hypertensive crisis, volatile hypertension, orthostatic tachycardia, and malignant vagotonia. Circulation 2002, 105, 2518–2523. [Google Scholar] [PubMed]
- Veronese, N.; De Rui, M.; Bolzetta, F.; Zambon, S.; Corti, M.C.; Baggio, G.; Toffanello, E.D.; Maggi, S.; Crepaldi, G.; Perissinotto, E.; et al. Orthostatic Changes in Blood Pressure and Mortality in the Elderly: The Pro.V.A Study. Am. J. Hypertens. 2015, 28, 1248–1256. [Google Scholar] [CrossRef]
Disclaimer/Publisher’s Note: The statements, opinions and data contained in all publications are solely those of the individual author(s) and contributor(s) and not of MDPI and/or the editor(s). MDPI and/or the editor(s) disclaim responsibility for any injury to people or property resulting from any ideas, methods, instructions or products referred to in the content. |
© 2023 by the authors. Licensee MDPI, Basel, Switzerland. This article is an open access article distributed under the terms and conditions of the Creative Commons Attribution (CC BY) license (https://creativecommons.org/licenses/by/4.0/).