
Combination of Maternal Serum ESM-1 and PLGF with Uterine Artery Doppler PI for Predicting Preeclampsia


Abstract
1. Introduction
2. Patients and Methods
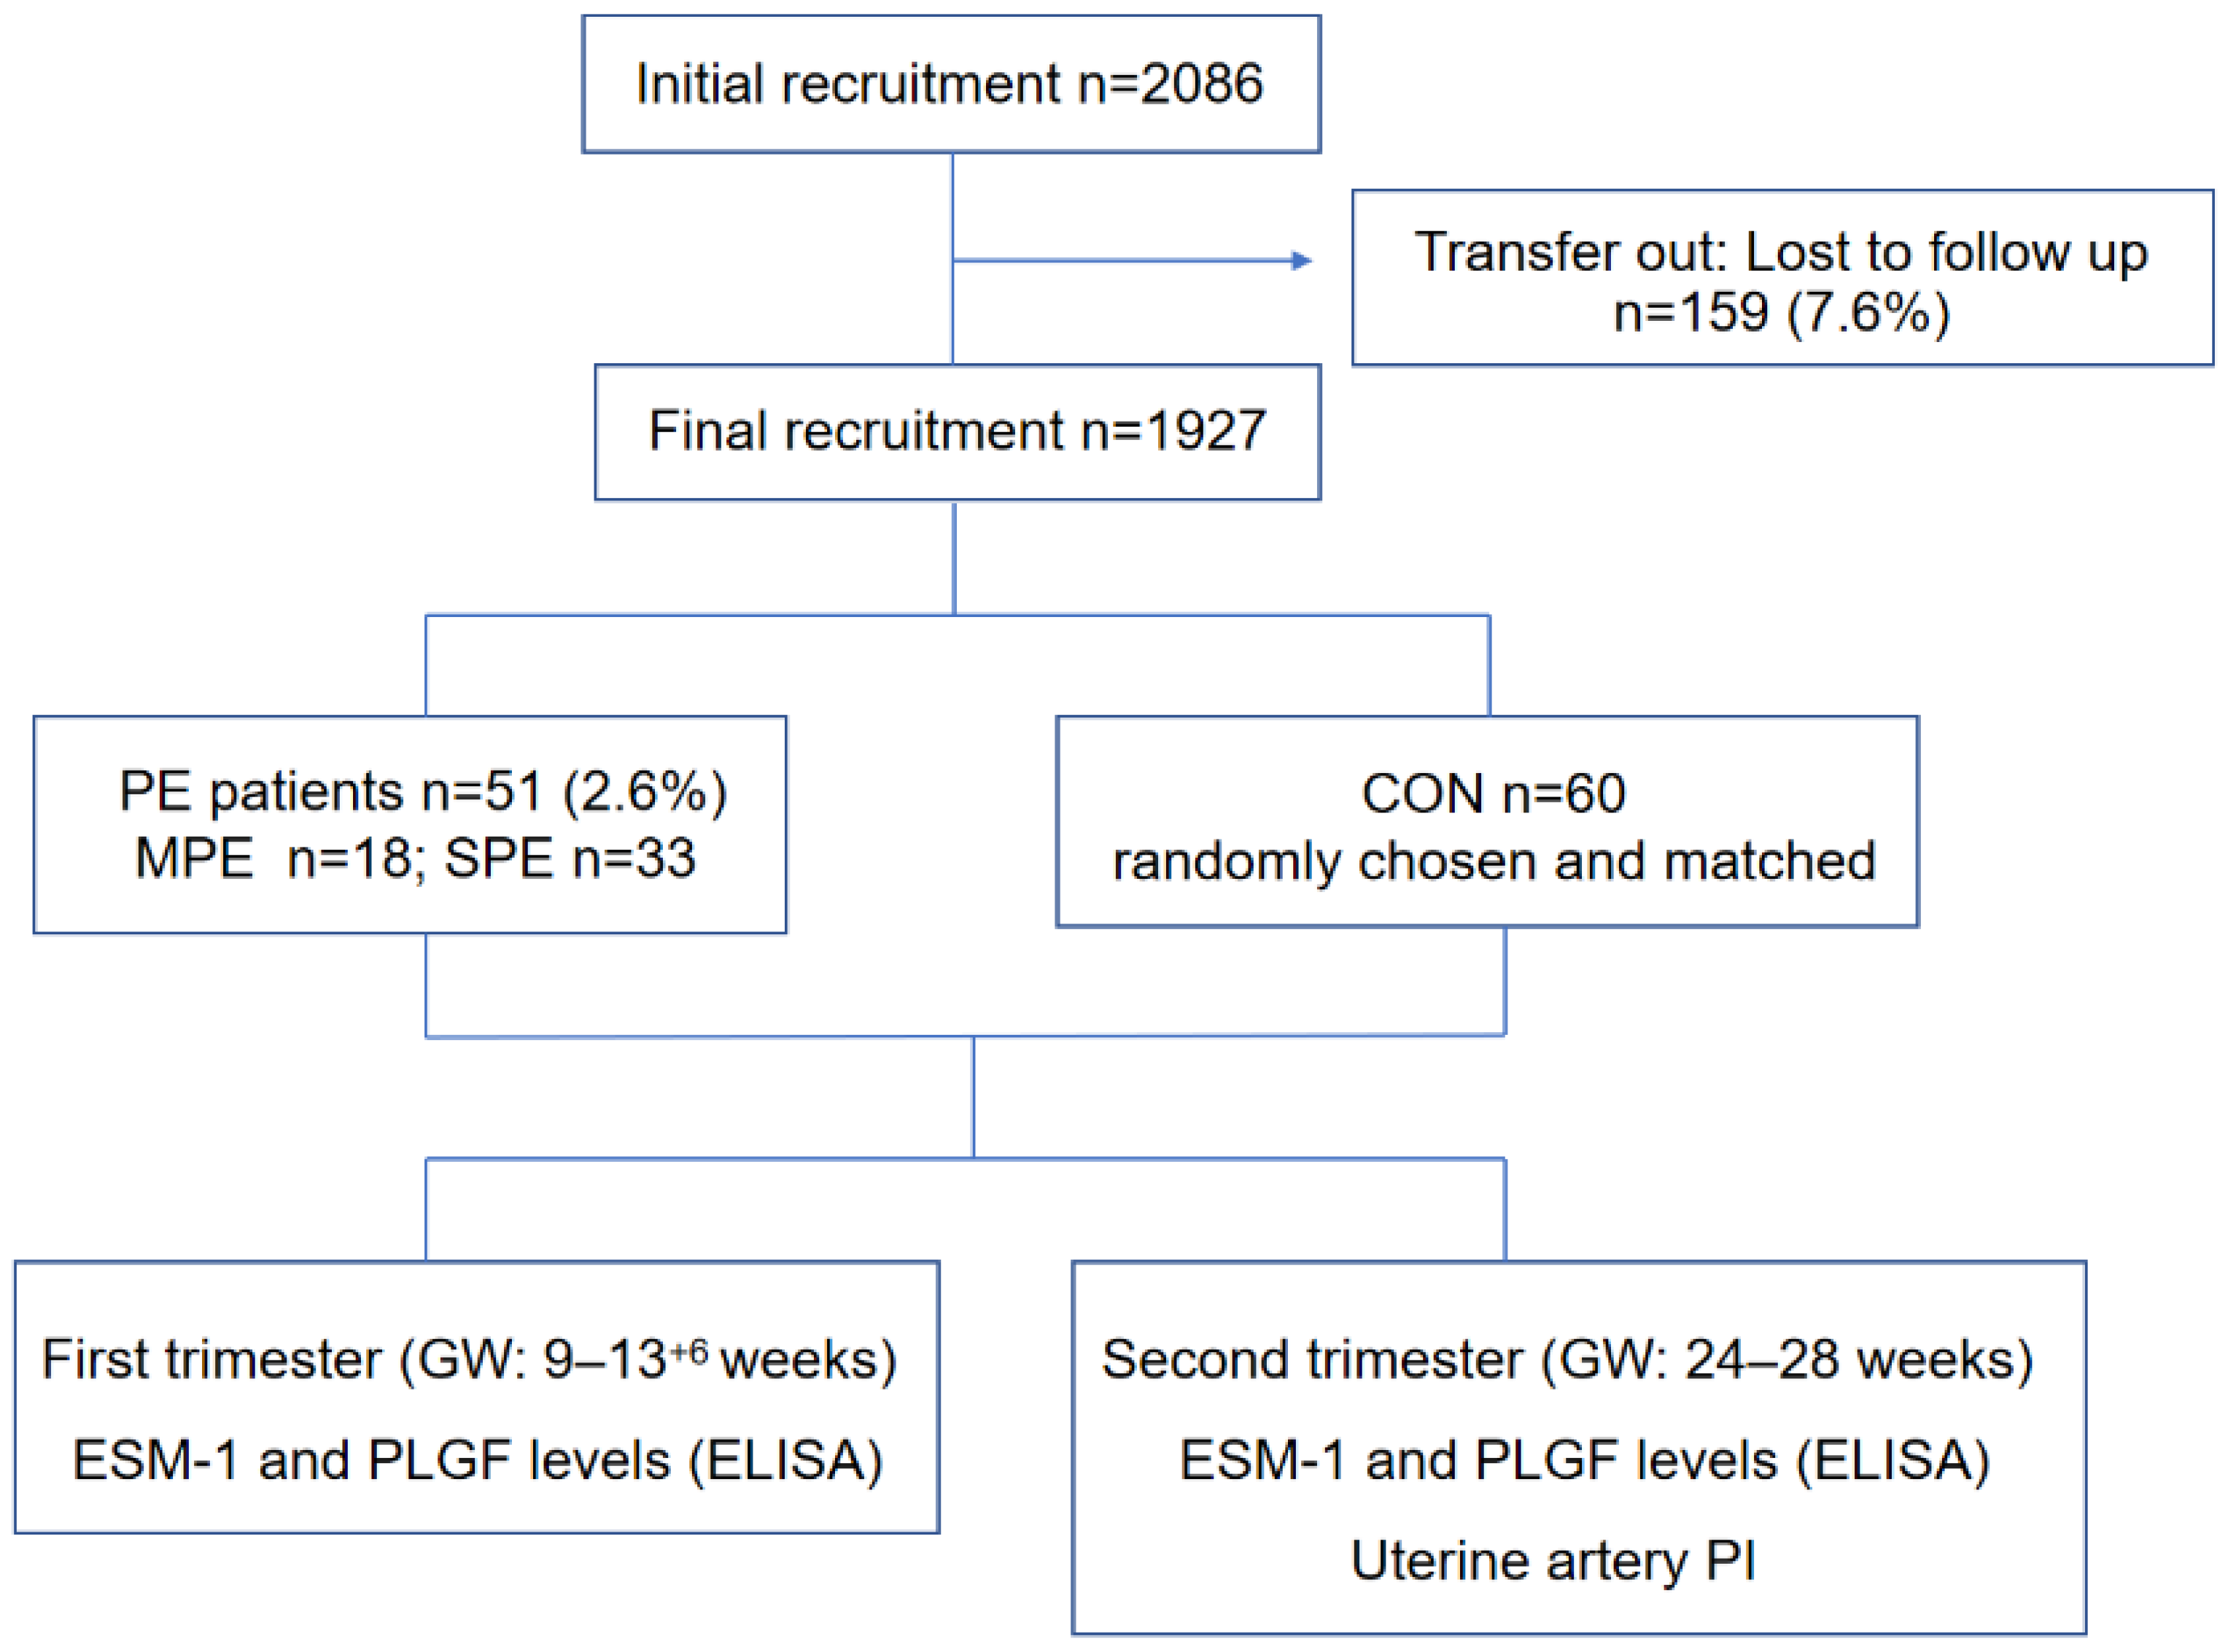
2.1. Patients
- (1)
- Blood pressure ≥160/110 mm Hg on two occasions at least 4 h apart (unless antihypertensive therapy was initiated before this time);
- (2)
- Thrombocytopenia: platelet count <100 × 109/L;
- (3)
- Renal insufficiency: serum creatinine concentrations >1.1 mg/dL or a doubling of the serum creatinine concentration in the absence of other renal diseases;
- (4)
- Impaired liver function: elevated blood concentrations of liver transaminases to twice the normal concentration;
- (5)
- Pulmonary edema;
- (6)
- New-onset headache unresponsive to medication and not accounted for by alternative diagnoses or visual symptoms.
- (1)
- Blood pressure ≥140/90 mmHg on two occasions at least 4 h apart after 20 weeks of gestation in a woman with previously normal blood pressure;
- (2)
- Three hundred milligrams or more per 24 h of urine collection (or this amount extrapolated from a timed collection) or a protein/creatinine ratio ≥ 0.3 mg/dL or a dipstick reading of 2+.
2.2. Maternal Serum Analytes
2.3. Uterine Artery PI
2.4. Statistical Analysis
3. Results
4. Discussion
5. Conclusions
Author Contributions
Funding
Institutional Review Board Statement
Informed Consent Statement
Data Availability Statement
Acknowledgments
Conflicts of Interest
References
- Kassebaum, N.J.; Barber, R.M.; Bhutta, Z.A.; Dandona, L.; Gething, P.W.; Hay, S.I.; Kinfu, Y.; Larson, H.J.; Liang, X.; Lim, S.S.; et al. Global, regional, and national levels of maternal mortality, 1990–2015: A systematic analysis for the Global Burden of Disease Study 2015. Lancet 2016, 388, 1775–1812. [Google Scholar] [CrossRef] [PubMed]
- Roberts, J.M.; Lain, K.Y. Recent Insights into the pathogenesis of pre-eclampsia. Placenta 2002, 23, 359–372. [Google Scholar] [CrossRef] [PubMed]
- Kornacki, J.; Wender-Ożegowska, E. Utility of biochemical tests in prediction, diagnostics and clinical management of preeclampsia: A review. Arch. Med. Sci. 2020, 16, 1370–1375. [Google Scholar] [CrossRef] [PubMed]
- Lassalle, P.; Molet, S.; Janin, A.; Van der Heyden, J.; Tavernier, J.; Fiers, W.; Devos, R.; Tonnel, A.-B. ESM-1 is a novel human endothelial cell-specific molecule expressed in lung and regulated by cytokines. J. Biol. Chem. 1996, 271, 20458–20464. [Google Scholar] [CrossRef] [PubMed]
- Balta, S.; Mikhailidis, D.P.; Demirkol, S.; Ozturk, C.; Kurtoglu, E.; Demir, M.; Celik, T.; Turker, T.; Iyisoy, A. Endocan—A novel inflammatory indicator in newly diagnosed patients with hypertension: A pilot study. Angiology 2014, 65, 773–777. [Google Scholar] [CrossRef]
- Lan, X.; Liu, Z. Circulating endocan and preeclampsia: A meta-analysis. Biosci. Rep. 2020, 40, 1–9. [Google Scholar] [CrossRef]
- Kingdom, J.; Huppertz, B.; Seaward, G.; Kaufmann, P. Development of the placental villous tree and its consequences for fetal growth. Eur. J. Obstet. Gynecol. Reprod. Biol. 2000, 92, 35–43. [Google Scholar] [CrossRef]
- Chau, K.; Hennessy, A.; Makris, A. Placental growth factor and pre-eclampsia. J. Hum. Hypertens. 2017, 31, 782–786. [Google Scholar] [CrossRef]
- Agrawal, S.; Shinar, S.; Cerdeira, A.S.; Redman, C.; Vatish, M. Predictive Performance of PlGF (Placental Growth Factor) for Screening Preeclampsia in Asymptomatic Women: A Systematic Review and Meta-Analysis. Hypertension 2019, 74, 1124–1135. [Google Scholar] [CrossRef]
- Levine, R.J.; Maynard, S.E.; Qian, C.; Lim, K.-H.; England, L.J.; Yu, K.F.; Schisterman, E.F.; Thadhani, R.; Sachs, B.P.; Epstein, F.H.; et al. Circulating Angiogenic Factors and the Risk of Preeclampsia. N. Engl. J. Med. 2004, 350, 672–683. [Google Scholar] [CrossRef]
- Polliotti, B.M.; Fry, A.G.; Saller, D.N.; Mooney, R.A.; Cox, C.; Miller, R.K. Second-trimester maternal serum placental growth factor and vascular endothelial growth factor for predicting severe, early-onset preeclampsia. Obstet. Gynecol. 2003, 101, 1266–1274. [Google Scholar] [CrossRef] [PubMed]
- Perry, H.; Binder, J.; Kalafat, E.; Jones, S.; Thilaganathan, B.; Khalil, A. Angiogenic Marker Prognostic Models in Pregnant Women with Hypertension. Hypertension 2020, 75, 755–761. [Google Scholar] [CrossRef] [PubMed]
- Carbillon, L.; Challier, J.; Alouini, S.; Uzan, M.; Uzan, S. Uteroplacental Circulation Development: Doppler Assessment and Clinical Importance. Placenta 2001, 22, 795–799. [Google Scholar] [CrossRef] [PubMed]
- Lloyd-Davies, C.; Collins, S.L.; Burton, G.J. Understanding the uterine artery Doppler waveform and its relationship to spiral artery remodelling. Placenta 2021, 105, 78–84. [Google Scholar] [CrossRef]
- Cui, S.; Gao, Y.; Zhang, L.; Wang, Y.; Zhang, L.; Liu, P.; Liu, L.; Chen, J. Combined use of serum MCP-1/IL-10 ratio and uterine artery Doppler index significantly improves the prediction of preeclampsia. Clin. Chim. Acta 2017, 473, 228–236. [Google Scholar] [CrossRef]
- Papageorghiou, A.T.; Yu, C.K.H.; Bindra, R.; Pandis, G.; Nicolaides, K. Multicenter screening for pre-eclampsia and fetal growth restriction by transvaginal uterine artery Doppler at 23 weeks of gestation. Ultrasound Obstet. Gynecol. 2001, 18, 441–449. [Google Scholar] [CrossRef]
- American College of Obstetricians and Gynecologists. Gestational Hypertension and Preeclampsia: ACOG Practice Bulletin Summary, Number 222. Obstet. Gynecol. 2020, 135, 1492–1495. [Google Scholar] [CrossRef] [PubMed]
- Ives, C.W.; Sinkey, R.; Rajapreyar, I.; Tita, A.T.; Oparil, S. Preeclampsia—Pathophysiology and Clinical Presentations: JACC State-of-the-Art Review. J. Am. Coll. Cardiol. 2020, 76, 1690–1702. [Google Scholar] [CrossRef]
- Chappell, L.C.; Cluver, C.A.; Kingdom, J.; Tong, S. Pre-eclampsia. Lancet 2021, 398, 341–354. [Google Scholar] [CrossRef]
- Balta, S.; Mikhailidis, D.P.; Demirkol, S.; Ozturk, C.; Celik, T.; Iyisoy, A. Endocan: A novel inflammatory indicator in cardiovascular disease? Atherosclerosis 2015, 243, 339–343. [Google Scholar] [CrossRef]
- Oktar, S.F.; Guney, I.; Eren, S.A.; Oktar, L.; Kosar, K.; Buyukterzi, Z.; Alkan, E.; Biyik, Z.; Erdem, S.S. Serum endocan levels, carotid intima-media thickness and microalbuminuria in patients with newly diagnosed hypertension. Clin. Exp. Hypertens. 2019, 41, 787–794. [Google Scholar] [CrossRef] [PubMed]
- Mihajlovic, D.M.; Lendak, D.F.; Draskovic, B.G.; Brkic, S.V.; Mitic, G.P.; Mikic, A.S.N.; Cebovic, T.N. Corrigendum to “Endocan is useful biomarker of survival and severity in sepsis” [Microvasc. Res. 93 (2014) 92–97]. Microvasc. Res. 2020, 129, 103992. [Google Scholar] [CrossRef] [PubMed]
- Scherpereel, A.; Gentina, T.; Grigoriu, B.; Sénéchal, S.; Janin, A.; Tsicopoulos, A.; Plénat, F.; Béchard, D.; Tonnel, A.-B.; Lassalle, P. Overexpression of endocan induces tumor formation. Cancer Res. 2003, 63, 6084–6089. [Google Scholar] [PubMed]
- Schuitemaker, J.; Woudenberg, J.; Wijbenga, G.; Scherjon, S.; van Pampus, M.; Faas, M. PPNew prognostic marker for the risk to develop early-onset preeclampsia. Pregnancy Hypertens. 2013, 3, 95–96. [Google Scholar] [CrossRef]
- Hentschke, M.R.; Lucas, L.S.; Mistry, H.D.; Pinheiro da Costa, B.E.; Poli-de-Figueiredo, C.E. Endocan-1 concentrations in maternal and fetal plasma and placentae in pre-eclampsia in the third trimester of pregnancy. Cytokine 2015, 74, 152–156. [Google Scholar] [CrossRef]
- Cakmak, M.; Yilmaz, H.; Bağlar, E.; Darçın, T.; Inan, O.; Aktas, A.; Celik, H.T.; Özdemir, O.; Atalay, C.R.; Akcay, A. Serum levels of endocan correlate with the presence and severity of pre-eclampsia. Clin. Exp. Hypertens. 2015, 38, 137–142. [Google Scholar] [CrossRef]
- Roudnicky, F.; Poyet, C.; Wild, P.; Krampitz, S.; Negrini, F.; Huggenberger, R.; Rogler, A.; Stöhr, R.; Hartmann, A.; Provenzano, M.; et al. Endocan Is Upregulated on Tumor Vessels in Invasive Bladder Cancer Where It Mediates VEGF-A–Induced Angiogenesis. Cancer Res. 2013, 73, 1097–1106. [Google Scholar] [CrossRef]
- Zhang, H.; Shen, Y.-W.; Zhang, L.-J.; Chen, J.-J.; Bian, H.-T.; Gu, W.-J.; Zhang, H.; Chen, H.-Z.; Zhang, W.-D.; Luan, X. Targeting Endothelial Cell-Specific Molecule 1 Protein in Cancer: A Promising Therapeutic Approach. Front. Oncol. 2021, 11, 687120. [Google Scholar] [CrossRef]
- Lohela, M.; Bry, M.; Tammela, T.; Alitalo, K. VEGFs and receptors involved in angiogenesis versus lymphangiogenesis. Curr. Opin. Cell Biol. 2009, 21, 154–165. [Google Scholar] [CrossRef]
- Myatt, L.; Clifton, R.G.; Roberts, J.M.; Spong, C.Y.; Hauth, J.C.; Varner, M.W.; Thorp, J.M.; Mercer, B.M.; Peaceman, A.M.; Ramin, S.M.; et al. First-Trimester Prediction of Preeclampsia in Nulliparous Women at Low Risk. Obstet. Gynecol. 2012, 119, 1234–1242. [Google Scholar] [CrossRef]
- Andersen, L.B.; Dechend, R.; Jørgensen, J.S.; Luef, B.M.; Nielsen, J.; Barington, T.; Christesen, H.T. Prediction of preeclampsia with angiogenic biomarkers. Results from the prospective Odense Child Cohort. Hypertens. Pregnancy 2016, 35, 405–419. [Google Scholar] [CrossRef] [PubMed]
- De Vivo, A.; Baviera, G.; Giordano, D.; Todarello, G.; Corrado, F.; D’Anna, R. Endoglin, PlGF and sFlt-1 as markers for predicting pre-eclampsia. Acta Obstet. Gynecol. Scand. 2008, 87, 837–842. [Google Scholar] [CrossRef] [PubMed]
- Chappell, L.C.; Duckworth, S.; Seed, P.T.; Griffin, M.; Myers, J.; Mackillop, L.; Simpson, N.; Waugh, J.; Anumba, D.; Kenny, L.; et al. Diagnostic Accuracy of Placental Growth Factor in Women with Suspected Preeclampsia: A prospective multicenter study. Circulation 2013, 128, 2121–2131. [Google Scholar] [CrossRef] [PubMed]
- Robinson, C.J.; Johnson, D.D.; Chang, E.Y.; Armstrong, D.M.; Wang, W. Evaluation of placenta growth factor and soluble Fms-like tyrosine kinase 1 receptor levels in mild and severe preeclampsia. Am. J. Obstet. Gynecol. 2006, 195, 255–259. [Google Scholar] [CrossRef]
- Cnossen, J.S.; Morris, R.K.; ter Riet, G.; Mol, B.W.; van der Post, J.A.; Coomarasamy, A.; Zwinderman, A.H.; Robson, S.C.; Bindels, P.J.; Kleijnen, J.; et al. Use of uterine artery Doppler ultrasonography to predict pre-eclampsia and intrauterine growth restriction: A systematic review and bivariable meta-analysis. Can. Med. Assoc. J. 2008, 178, 701–711. [Google Scholar] [CrossRef]
- Poon, L.C.; Nicolaides, K.H. Early Prediction of Preeclampsia. Obstet. Gynecol. Int. 2014, 2014, 1–11. [Google Scholar] [CrossRef]
- Yu, N.; Cui, H.; Chen, X.; Chang, Y. First trimester maternal serum analytes and second trimester uterine artery Doppler in the prediction of preeclampsia and fetal growth restriction. Taiwan J. Obstet. Gynecol. 2017, 56, 358–361. [Google Scholar] [CrossRef]


| Characteristic | SPE (n = 33) | MPE (n = 18) | CON (n = 60) |
|---|---|---|---|
| Maternal age, y | 31.06 ± 4.34 | 31.89 ± 4.38 | 30.03 ± 3.61 |
| Pre-BMI, kg/m2 | 21.02 ± 2.55 | 21.51 ± 2.02 | 20.60 ± 1.82 |
| SBP (mmHg) | 166.18 ± 9.74 ** | 144.39 ± 5.38 ** | 117.00 ± 9.39 |
| DBP (mmHg) | 97.91 ± 8.91 ** | 92.33 ± 5.24 ** | 74.78 ± 9.11 |
| Nulliparous, n (%) | 29 (87.88%) | 16 (88.89%) | 52 (86.67%) |
| GA at delivery, weeks | 37.09 ± 3.01 ** | 38.73 ± 1.20 * | 39.45 ± 0.81 |
| Fetal weight, g | 2660.45 ± 754.43 ** | 3161.39 ± 266.34 * | 3375.50 ± 297.29 |
| Placental weight, g | 537.27 ± 165.52 * | 622.50 ± 84.53 | 614.08 ± 67.01 |
| 5′ Apgar score | 9.33 ± 1.83 | 9.61 ± 0.61 | 9.81 ± 0.62 |
| SPE (n = 33) | MPE (n = 18) | CON (n = 60) | p Value | ||
|---|---|---|---|---|---|
| SPE | MPE | ||||
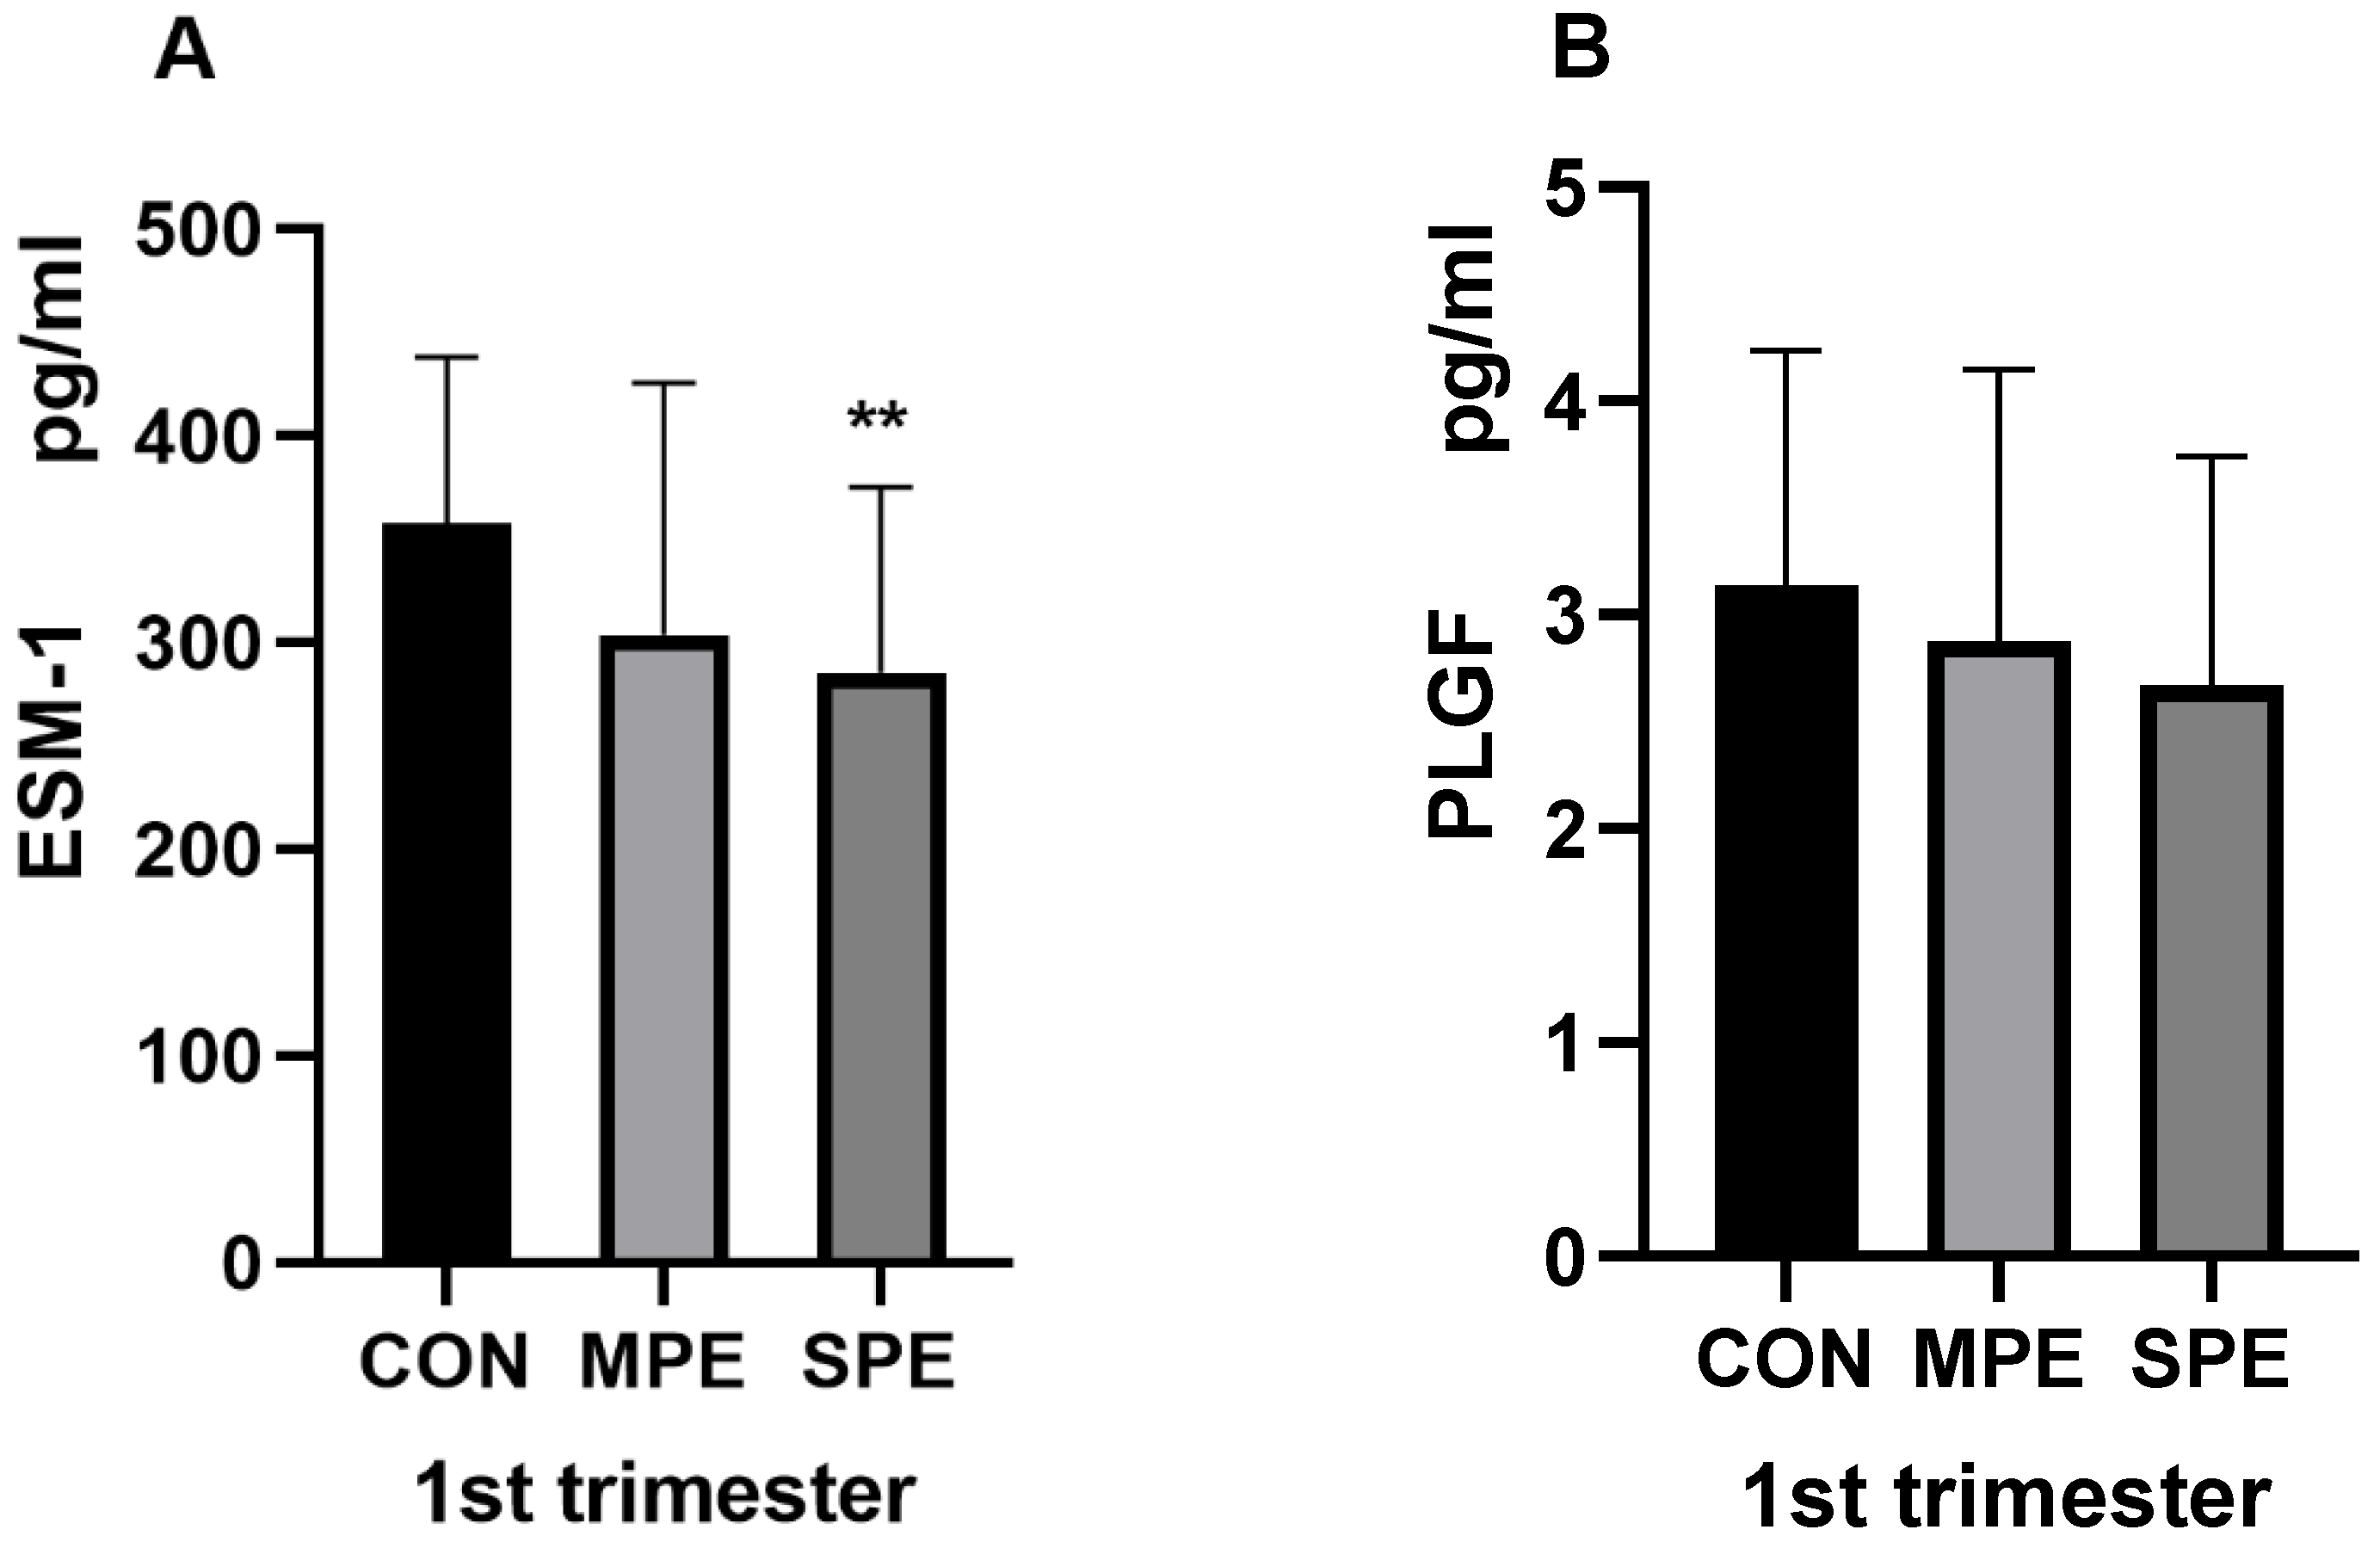
| 1st ESM-1 (pg/mL) | 285.82 ± 89.53 | 304.00 ± 121.59 | 357.61 ± 80.40 | <0.001 ** | 0.093 |
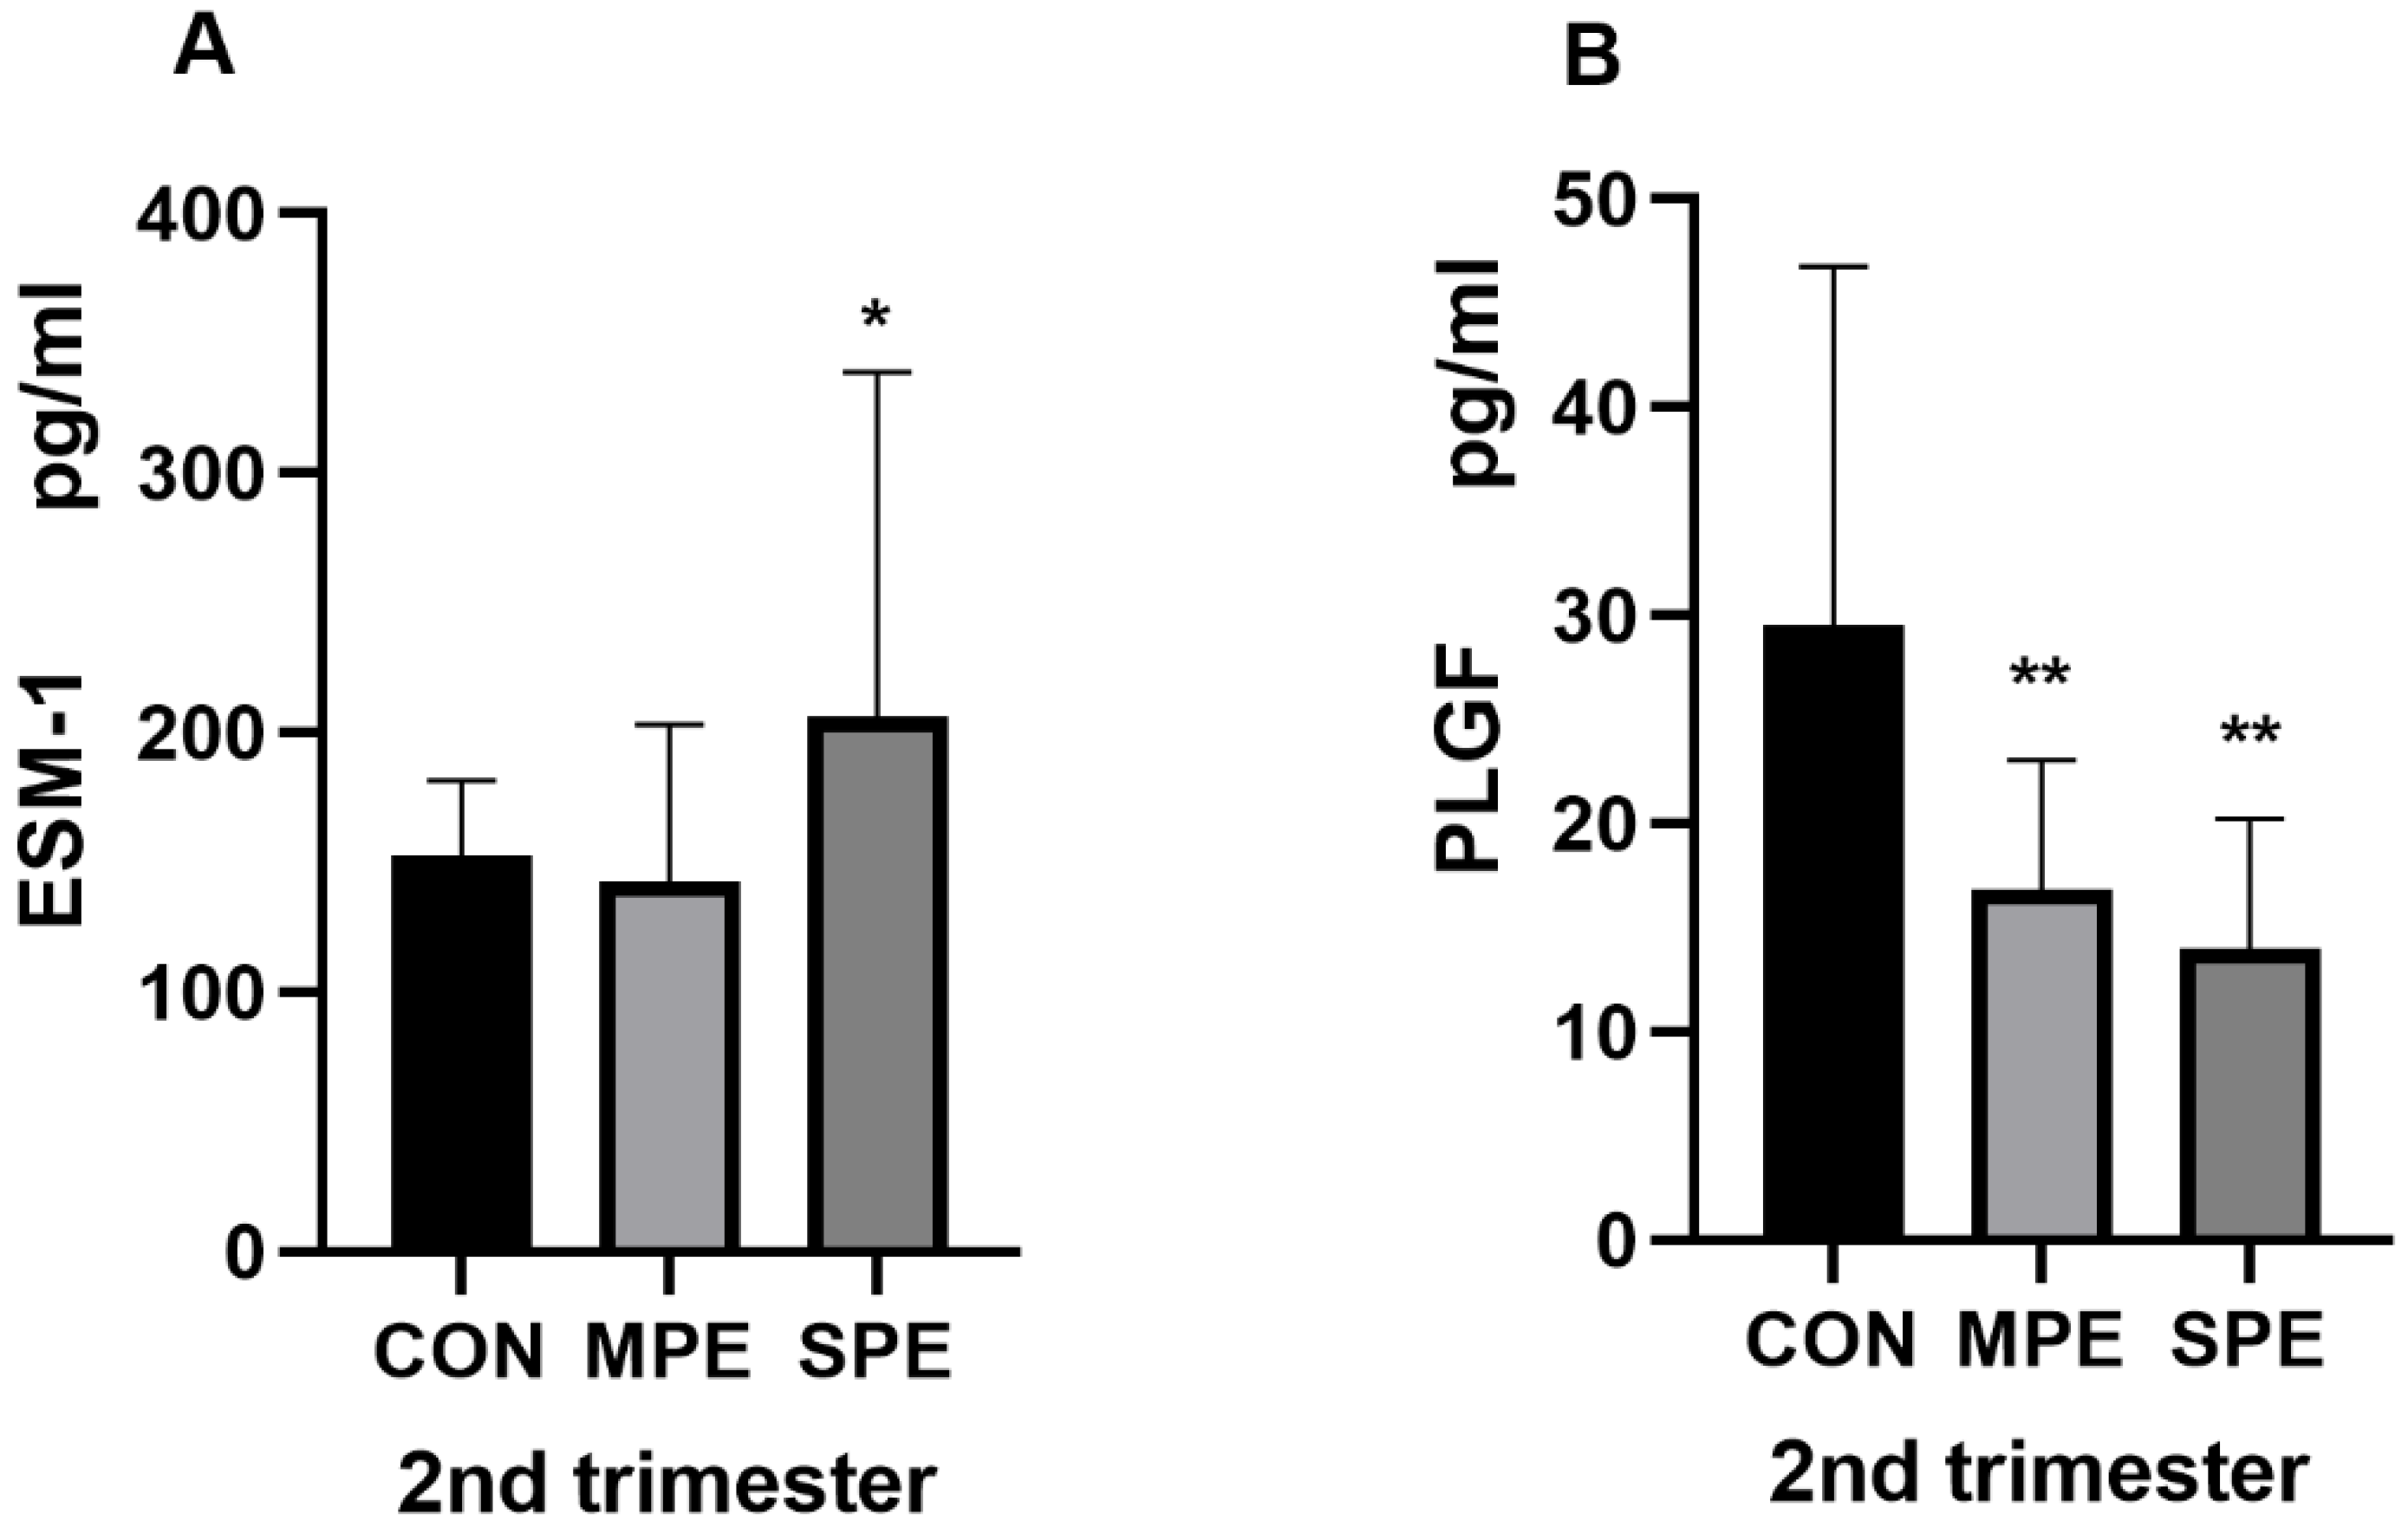
| 2nd ESM-1 (pg/mL) | 206.24 ± 132.53 | 142.58 ± 60.68 | 152.35 ± 29.00 | 0.0032 * | 0.347 |
| 1st PLGF (pg/mL) | 2.67 ± 1.07 | 2.87 ± 1.27 | 3.13 ± 1.10 | 0.0524 | 0.400 |
| 2nd PLGF (pg/mL) | 14.03 ± 6.21 | 16.82 ± 6.25 | 29.52 ± 17.26 | <0.001 ** | <0.001 ** |
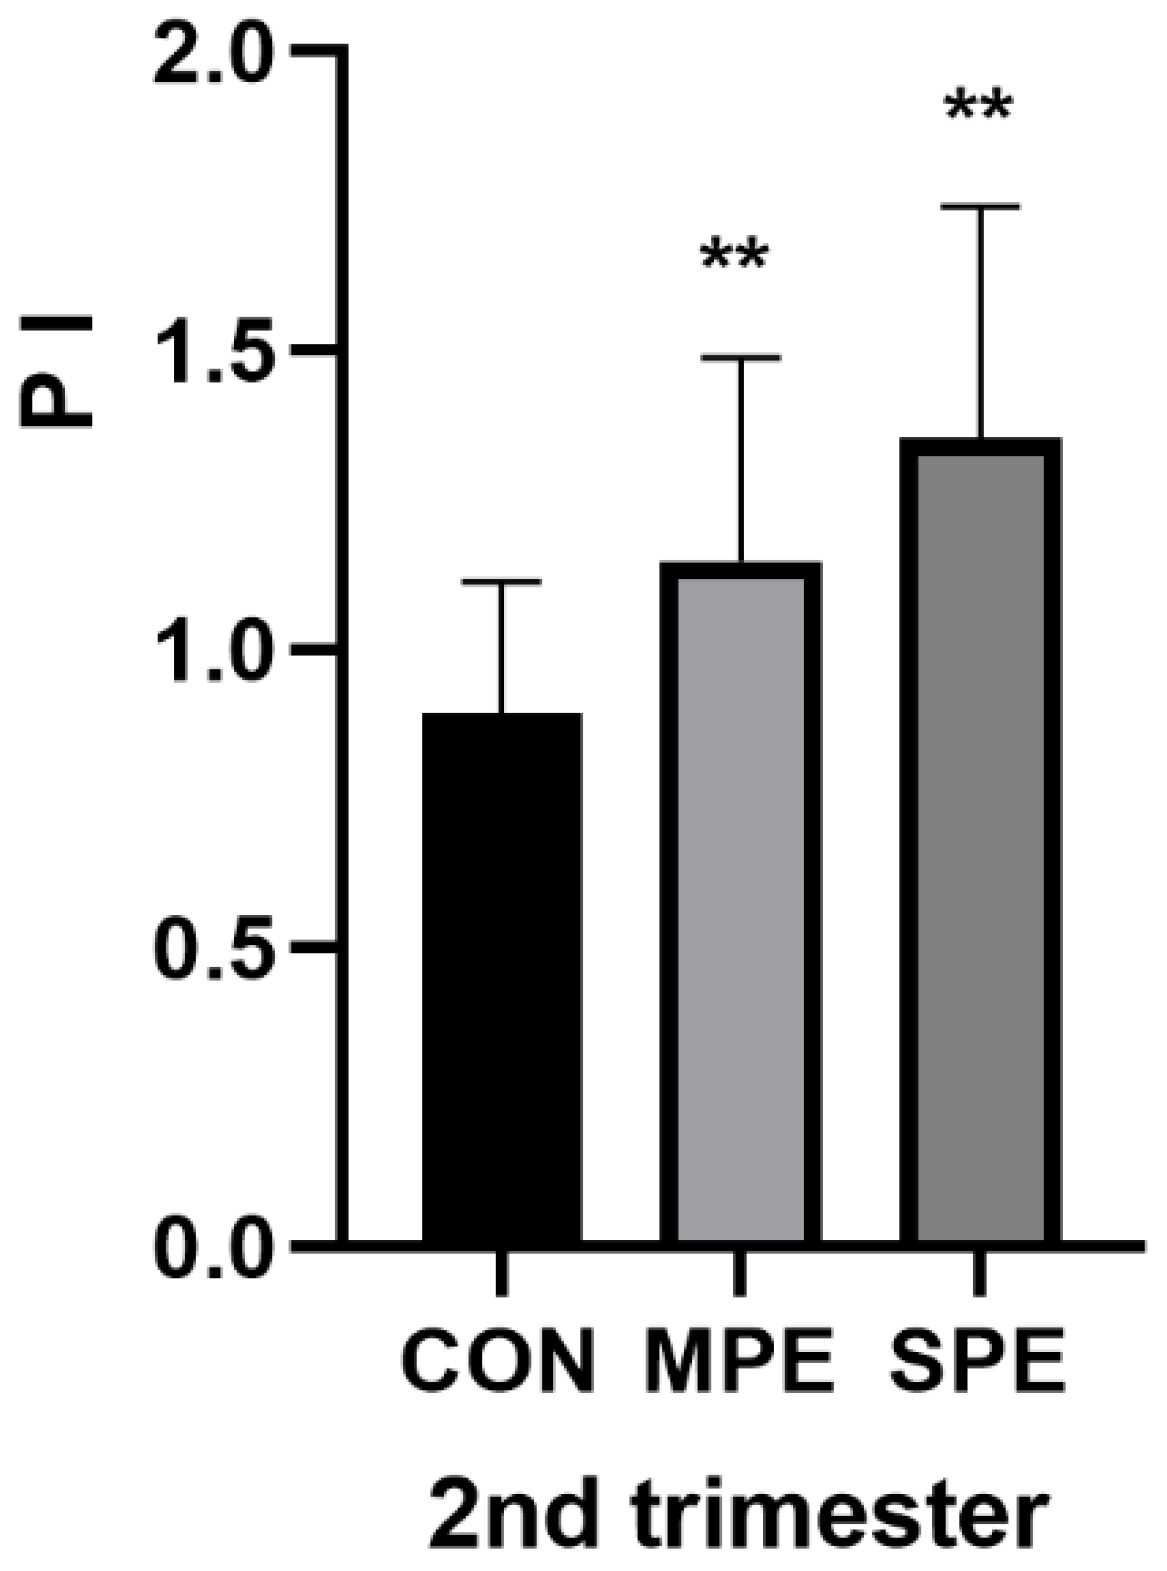
| 2nd PI | 1.35 ± 0.39 | 1.15 ± 0.34 | 0.89 ± 0.22 | <0.001 ** | <0.001 ** |
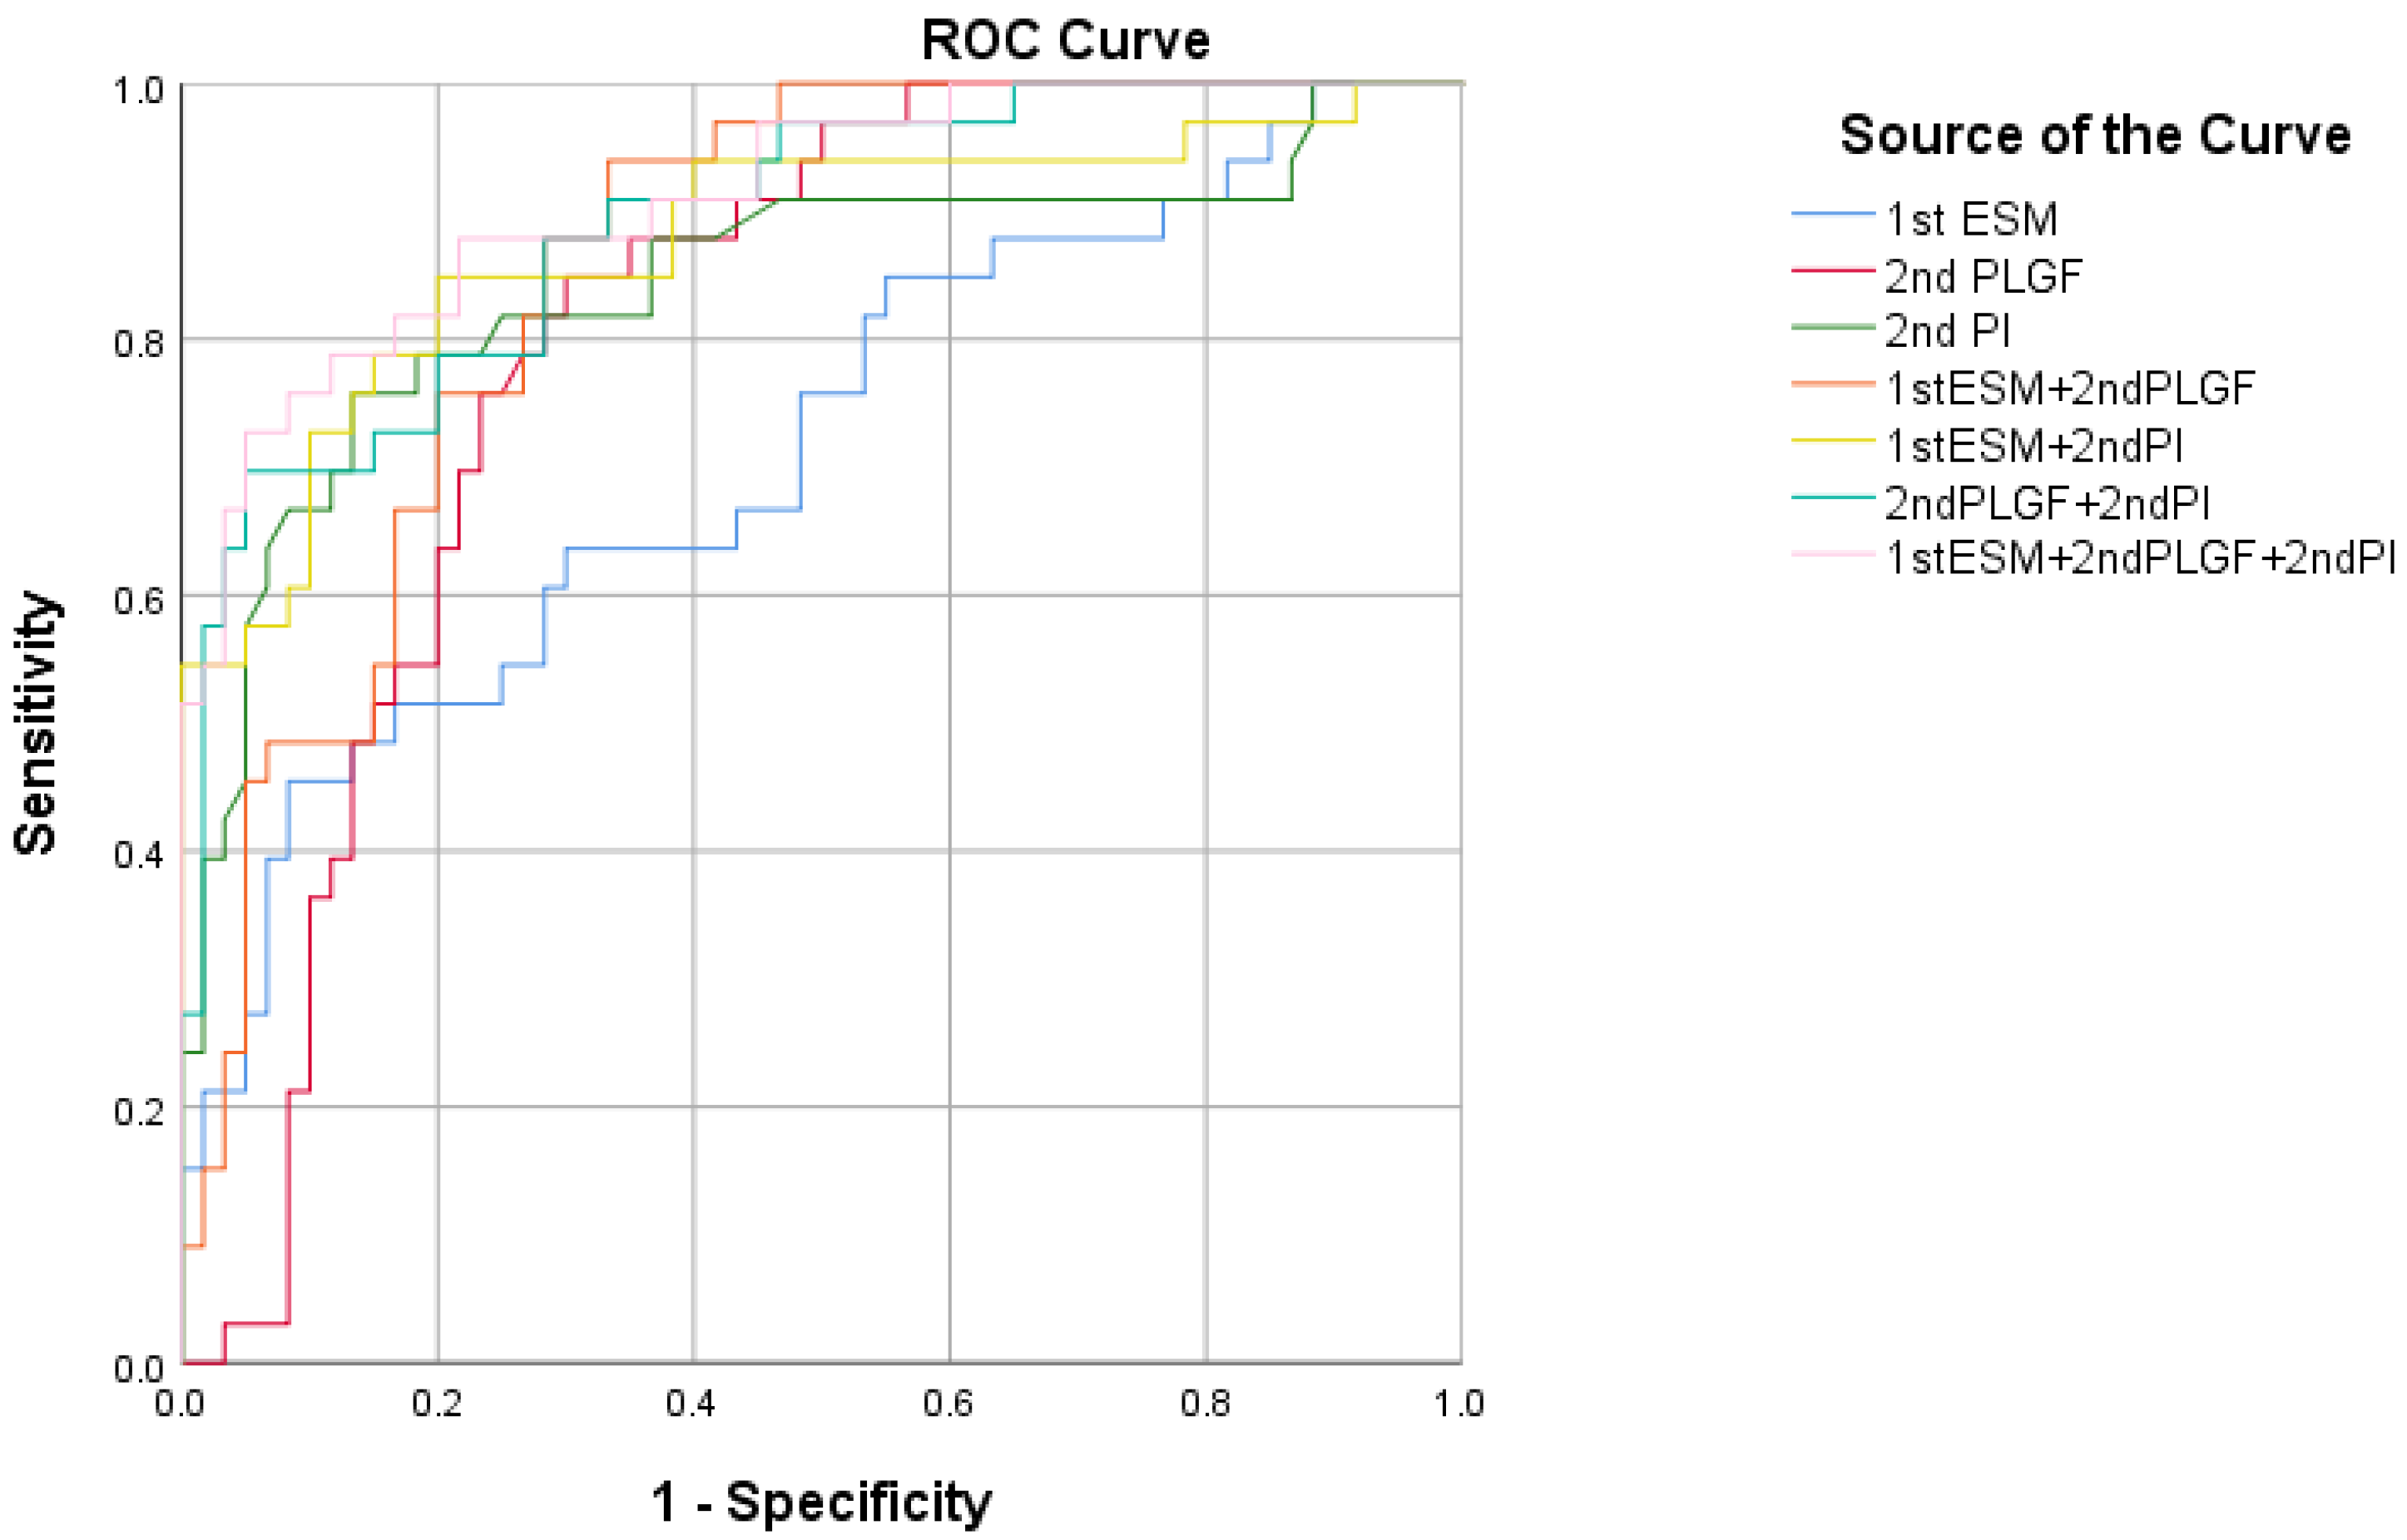
| Variable | AUC | p Value | 95%CI | Cutoff | Specificity (%) | Sensitivity (%) |
|---|---|---|---|---|---|---|
| 1st ESM-1 | 0.714 | 0.0002 | 0.611–0.803 | 262. 33 | 91.67 | 45.50 |
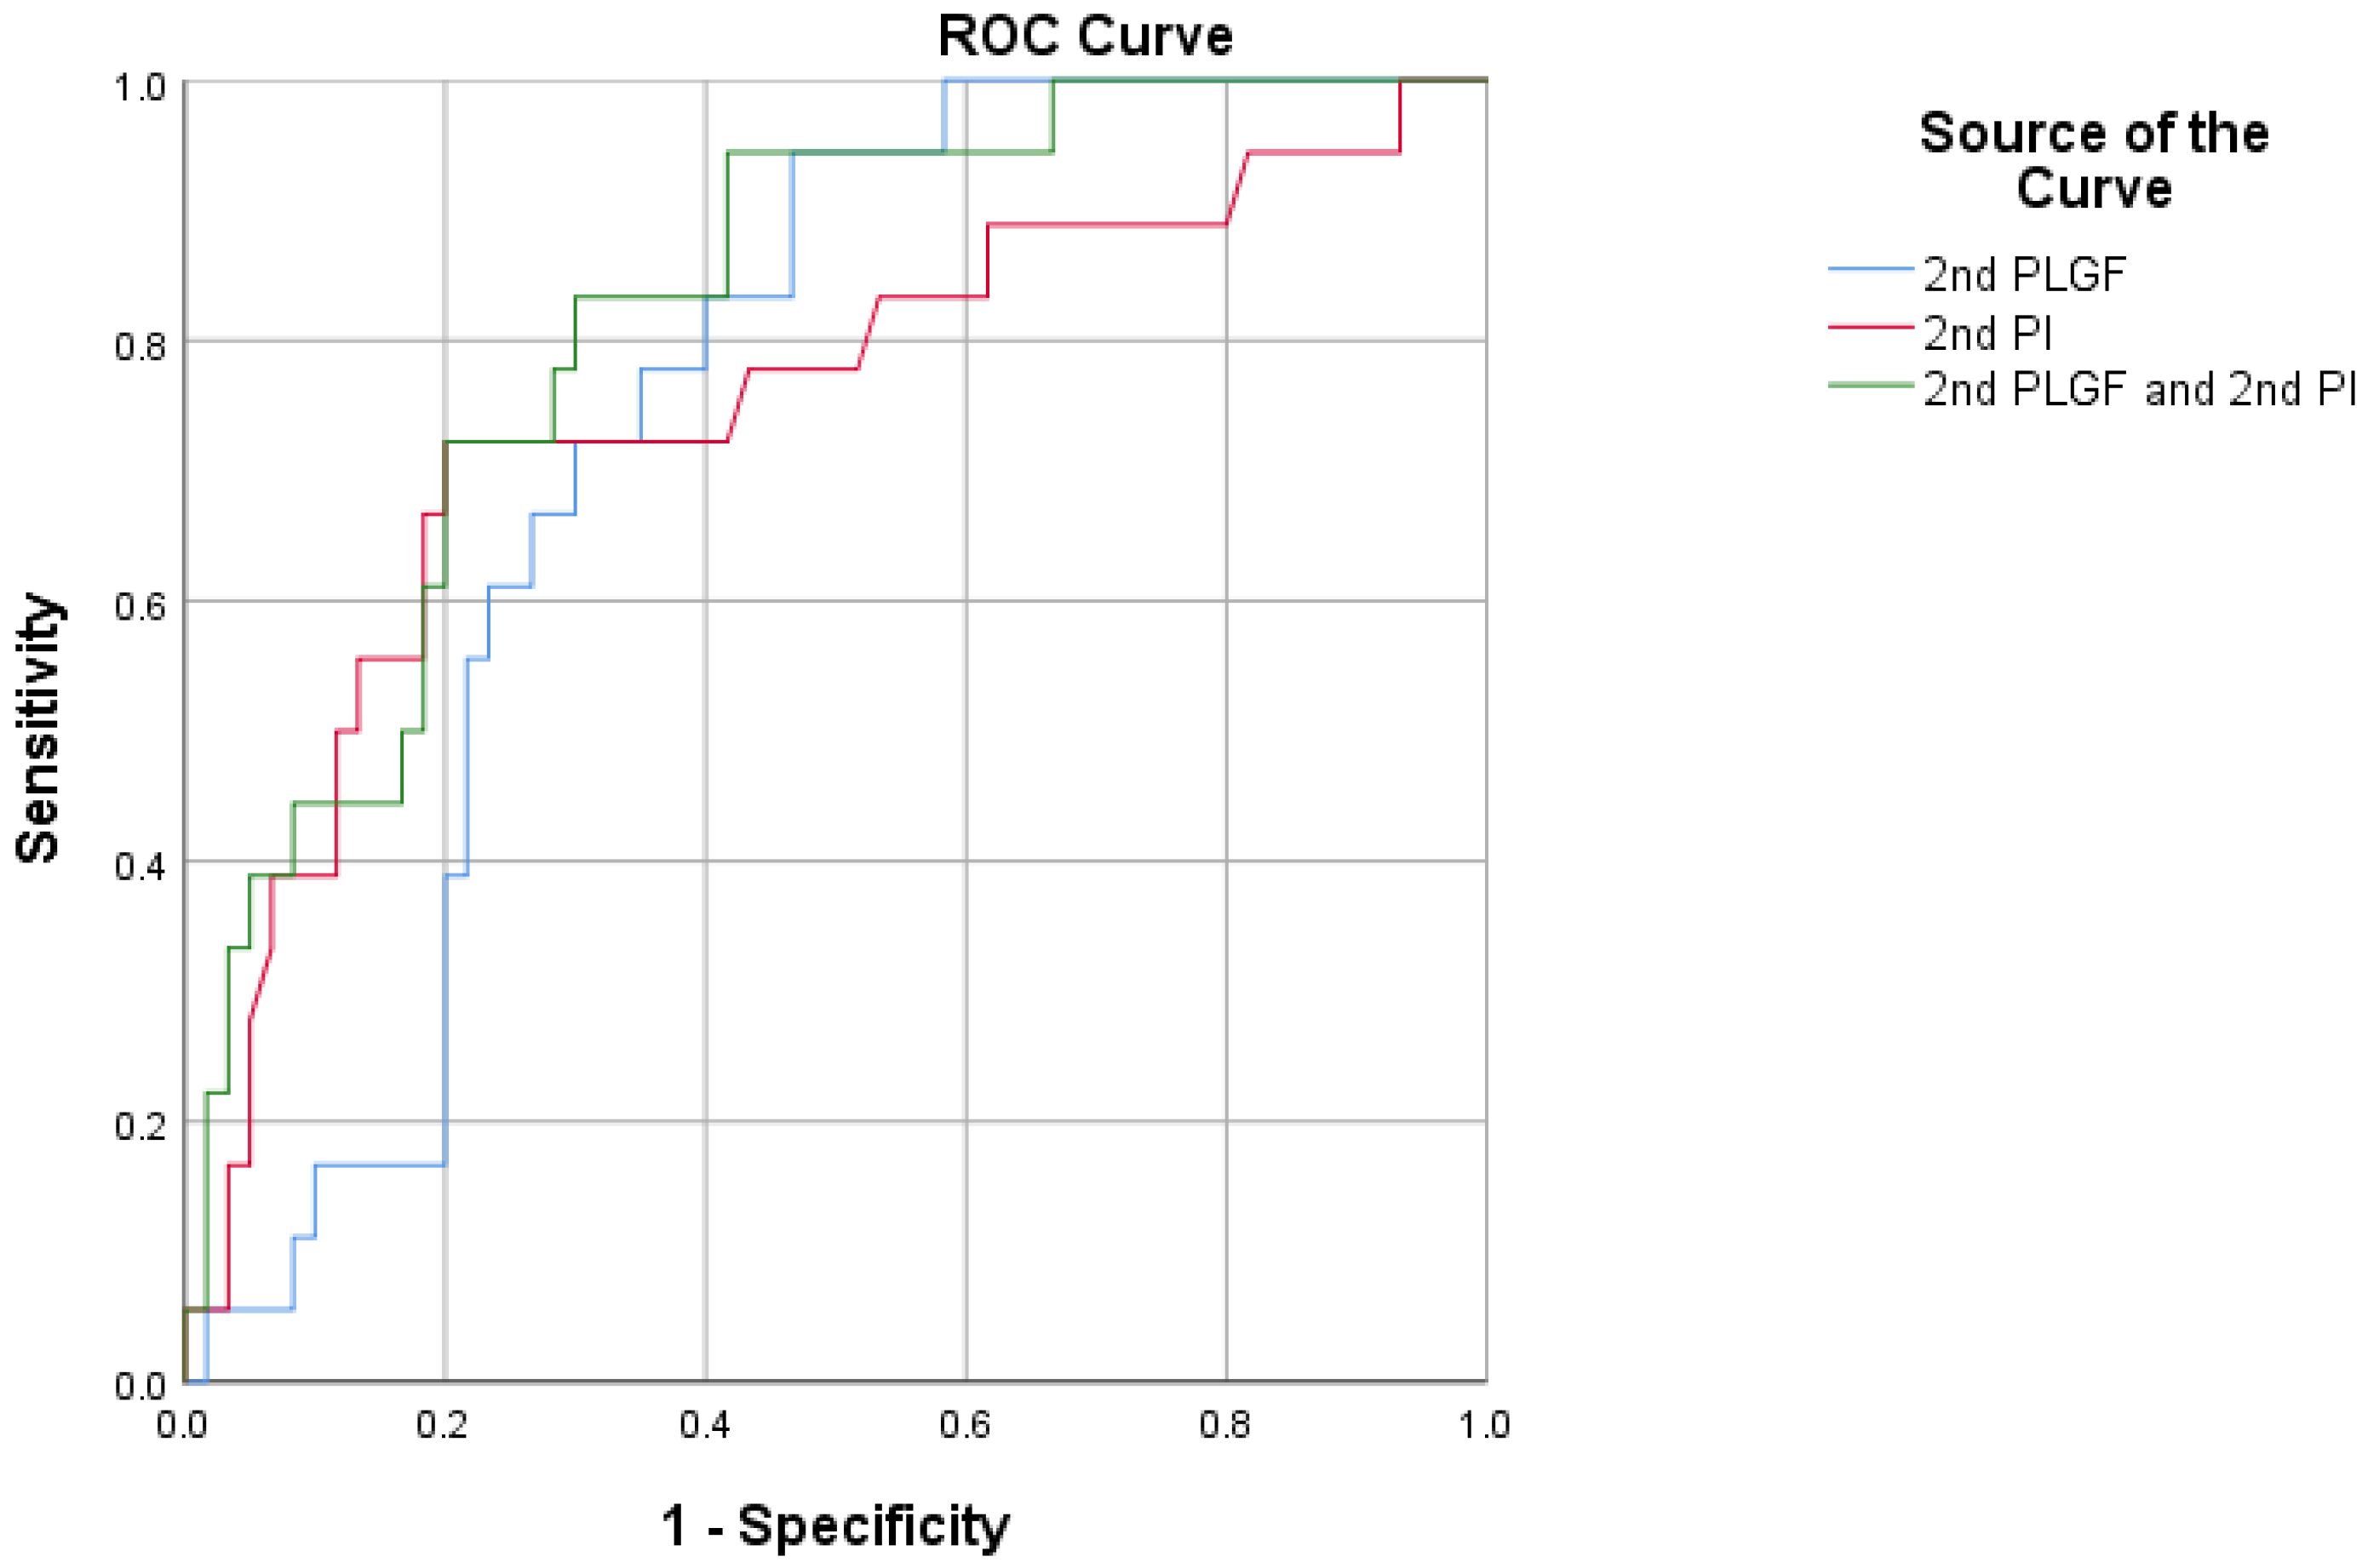
| 2nd PLGF | 0.802 | <0.0001 | 0.706–0.877 | 19.12 | 70.00 | 84.85 |
| 2nd PI | 0.843 | <0.0001 | 0.753–0.911 | 1.12 | 86.67 | 75.76 |
| 1st ESM-1 + 2nd PLGF | 0.856 | <0.0001 | 0.767–0.920 | - | 66.70 | 93.90 |
| 1st ESM-1 + 2nd PI | 0.876 | <0.0001 | 0.792–0.935 | - | 80.00 | 84.85 |
| 2nd PLGF + 2nd PI | 0.890 | <0.0001 | 0.808–0.945 | - | 95.00 | 69.70 |
| 1st ESM-1 + 2nd PLGF + 2nd PI | 0.912 | <0.0001 | 0.835–0.961 | - | 95.00 | 72.73 |
Disclaimer/Publisher’s Note: The statements, opinions and data contained in all publications are solely those of the individual author(s) and contributor(s) and not of MDPI and/or the editor(s). MDPI and/or the editor(s) disclaim responsibility for any injury to people or property resulting from any ideas, methods, instructions or products referred to in the content. |
© 2023 by the authors. Licensee MDPI, Basel, Switzerland. This article is an open access article distributed under the terms and conditions of the Creative Commons Attribution (CC BY) license (https://creativecommons.org/licenses/by/4.0/).
Share and Cite
Xie, X.; Chen, D.; Yang, X.; Cao, Y.; Guo, Y.; Cheng, W. Combination of Maternal Serum ESM-1 and PLGF with Uterine Artery Doppler PI for Predicting Preeclampsia. J. Clin. Med. 2023, 12, 459. https://doi.org/10.3390/jcm12020459
Xie X, Chen D, Yang X, Cao Y, Guo Y, Cheng W. Combination of Maternal Serum ESM-1 and PLGF with Uterine Artery Doppler PI for Predicting Preeclampsia. Journal of Clinical Medicine. 2023; 12(2):459. https://doi.org/10.3390/jcm12020459
Chicago/Turabian StyleXie, Xianjing, Dan Chen, Xingyu Yang, Yunyun Cao, Yuna Guo, and Weiwei Cheng. 2023. "Combination of Maternal Serum ESM-1 and PLGF with Uterine Artery Doppler PI for Predicting Preeclampsia" Journal of Clinical Medicine 12, no. 2: 459. https://doi.org/10.3390/jcm12020459
APA StyleXie, X., Chen, D., Yang, X., Cao, Y., Guo, Y., & Cheng, W. (2023). Combination of Maternal Serum ESM-1 and PLGF with Uterine Artery Doppler PI for Predicting Preeclampsia. Journal of Clinical Medicine, 12(2), 459. https://doi.org/10.3390/jcm12020459