
Evolving a Model for Cochlear Implant Outcome


Abstract
:1. Introduction
2. Materials and Methods
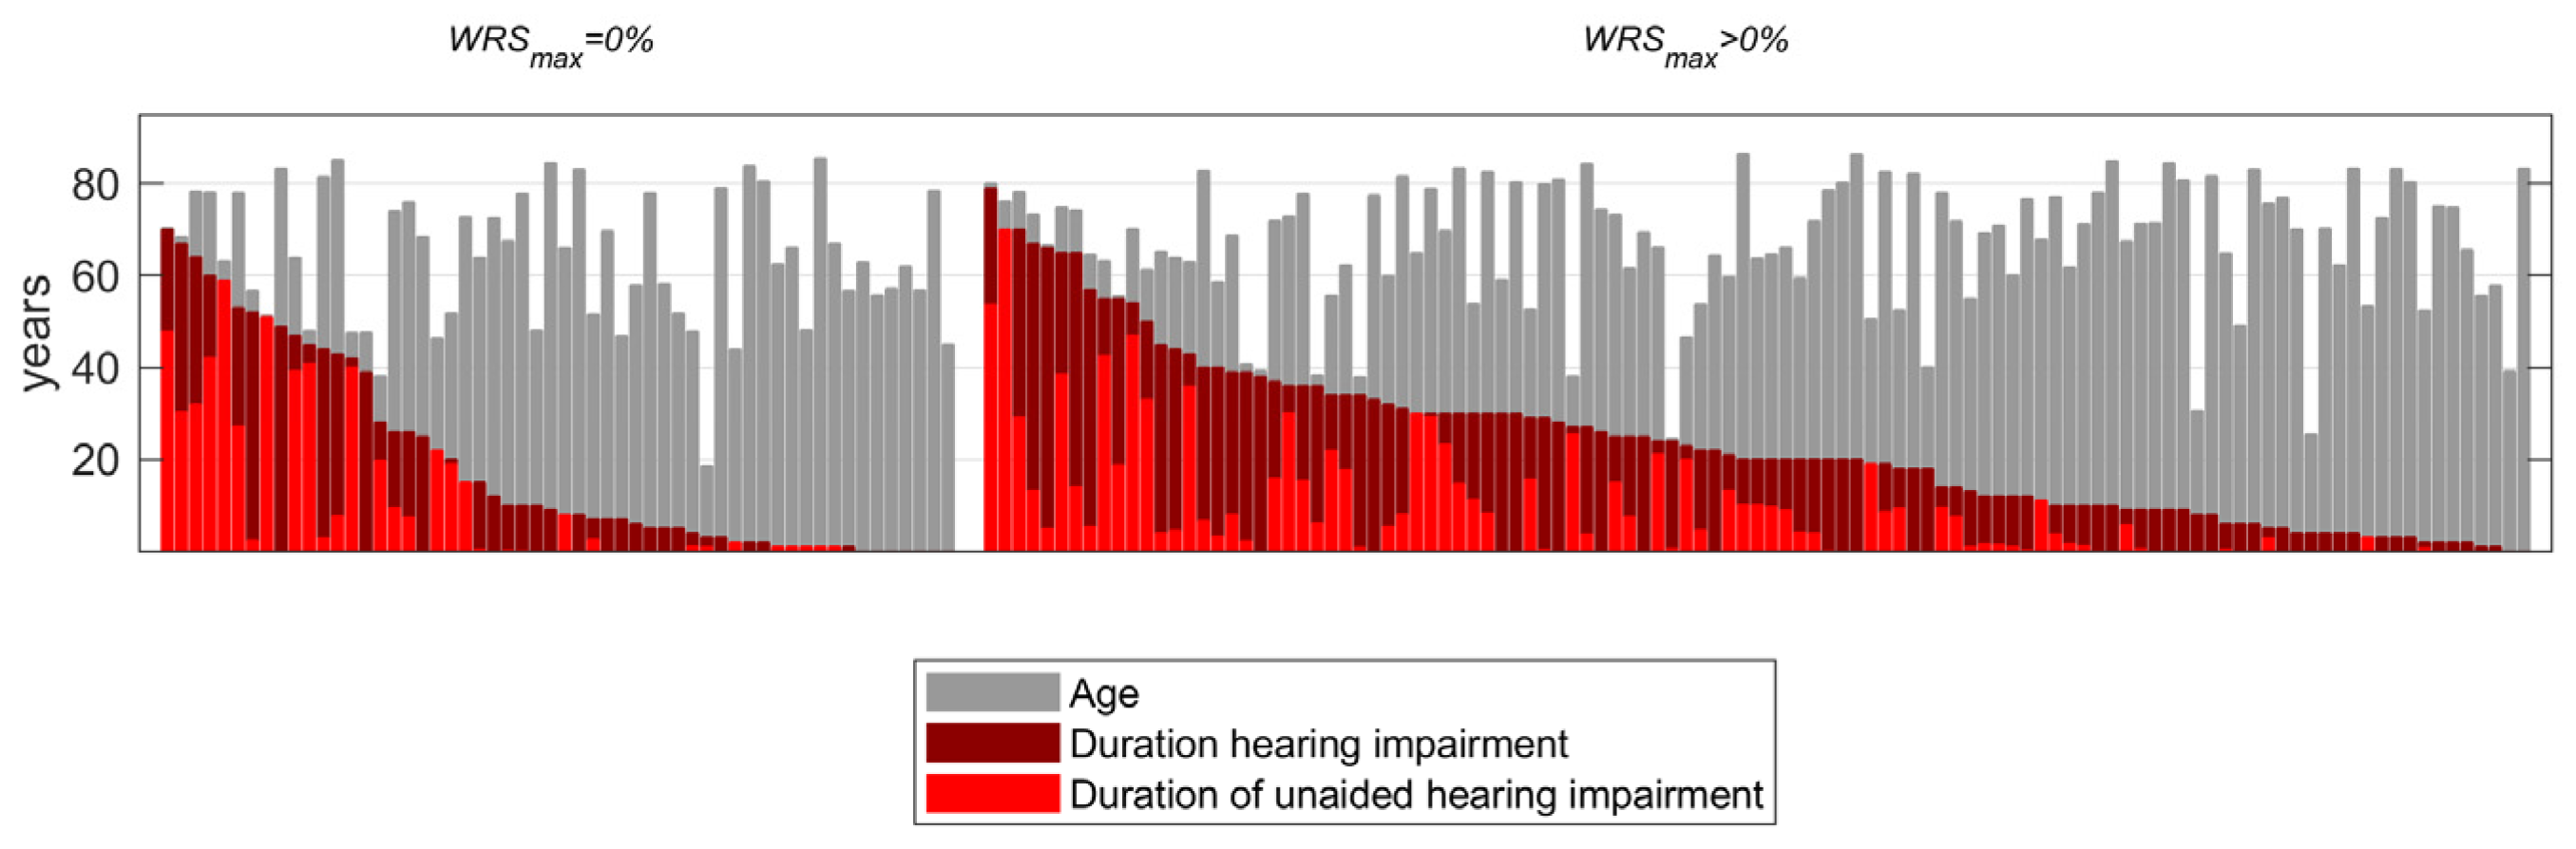
2.1. Patients
2.2. Speech Audiometry
2.3. Data Analysis
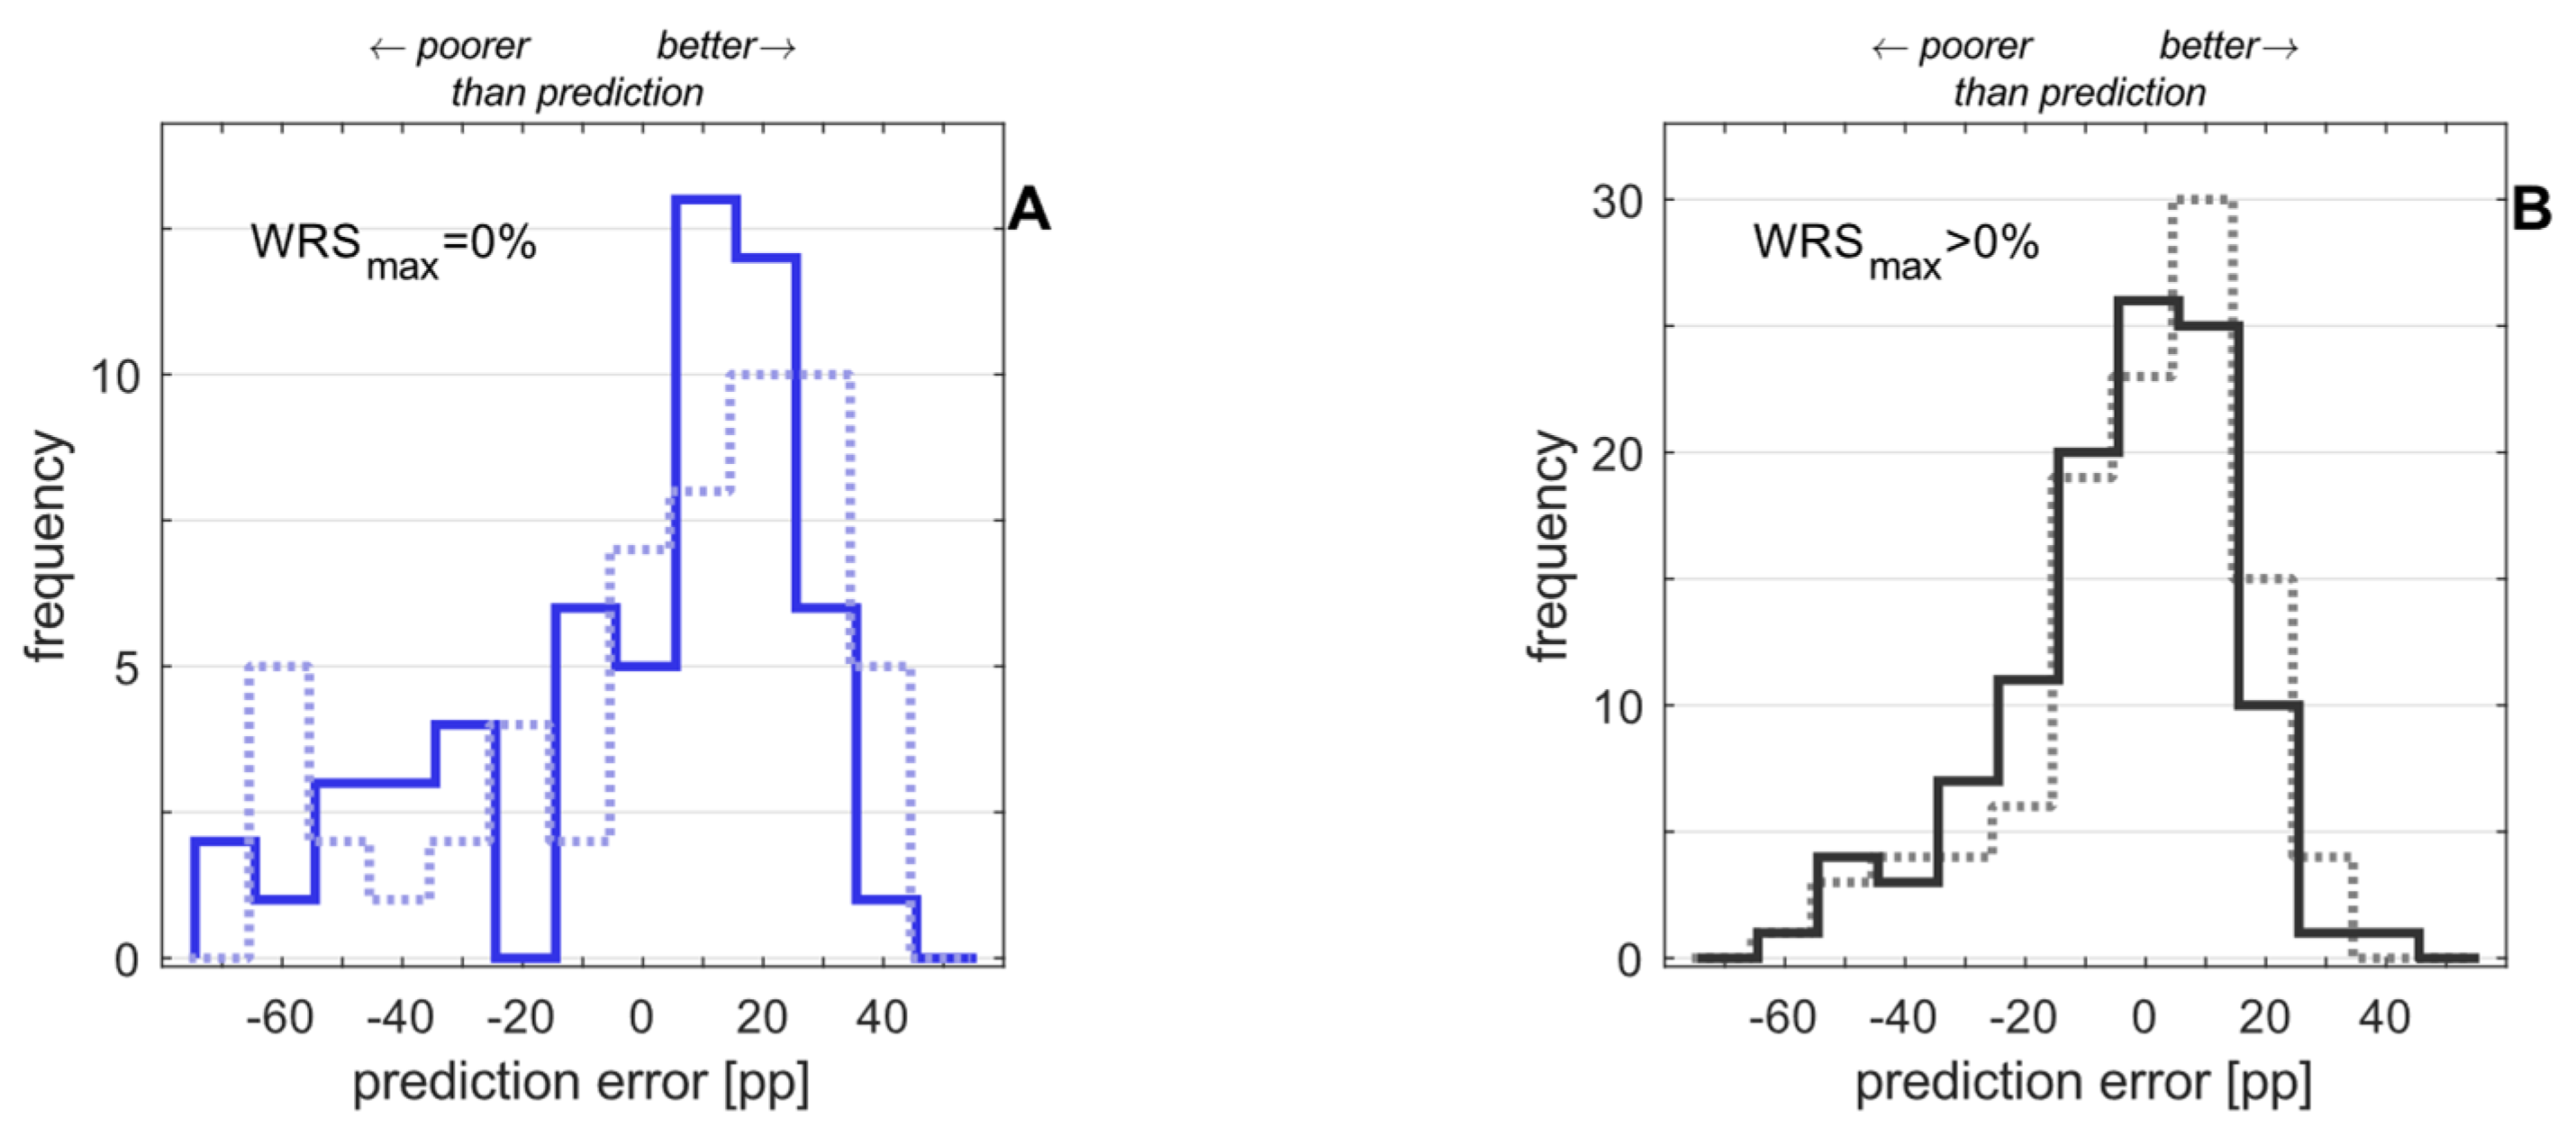
3. Results
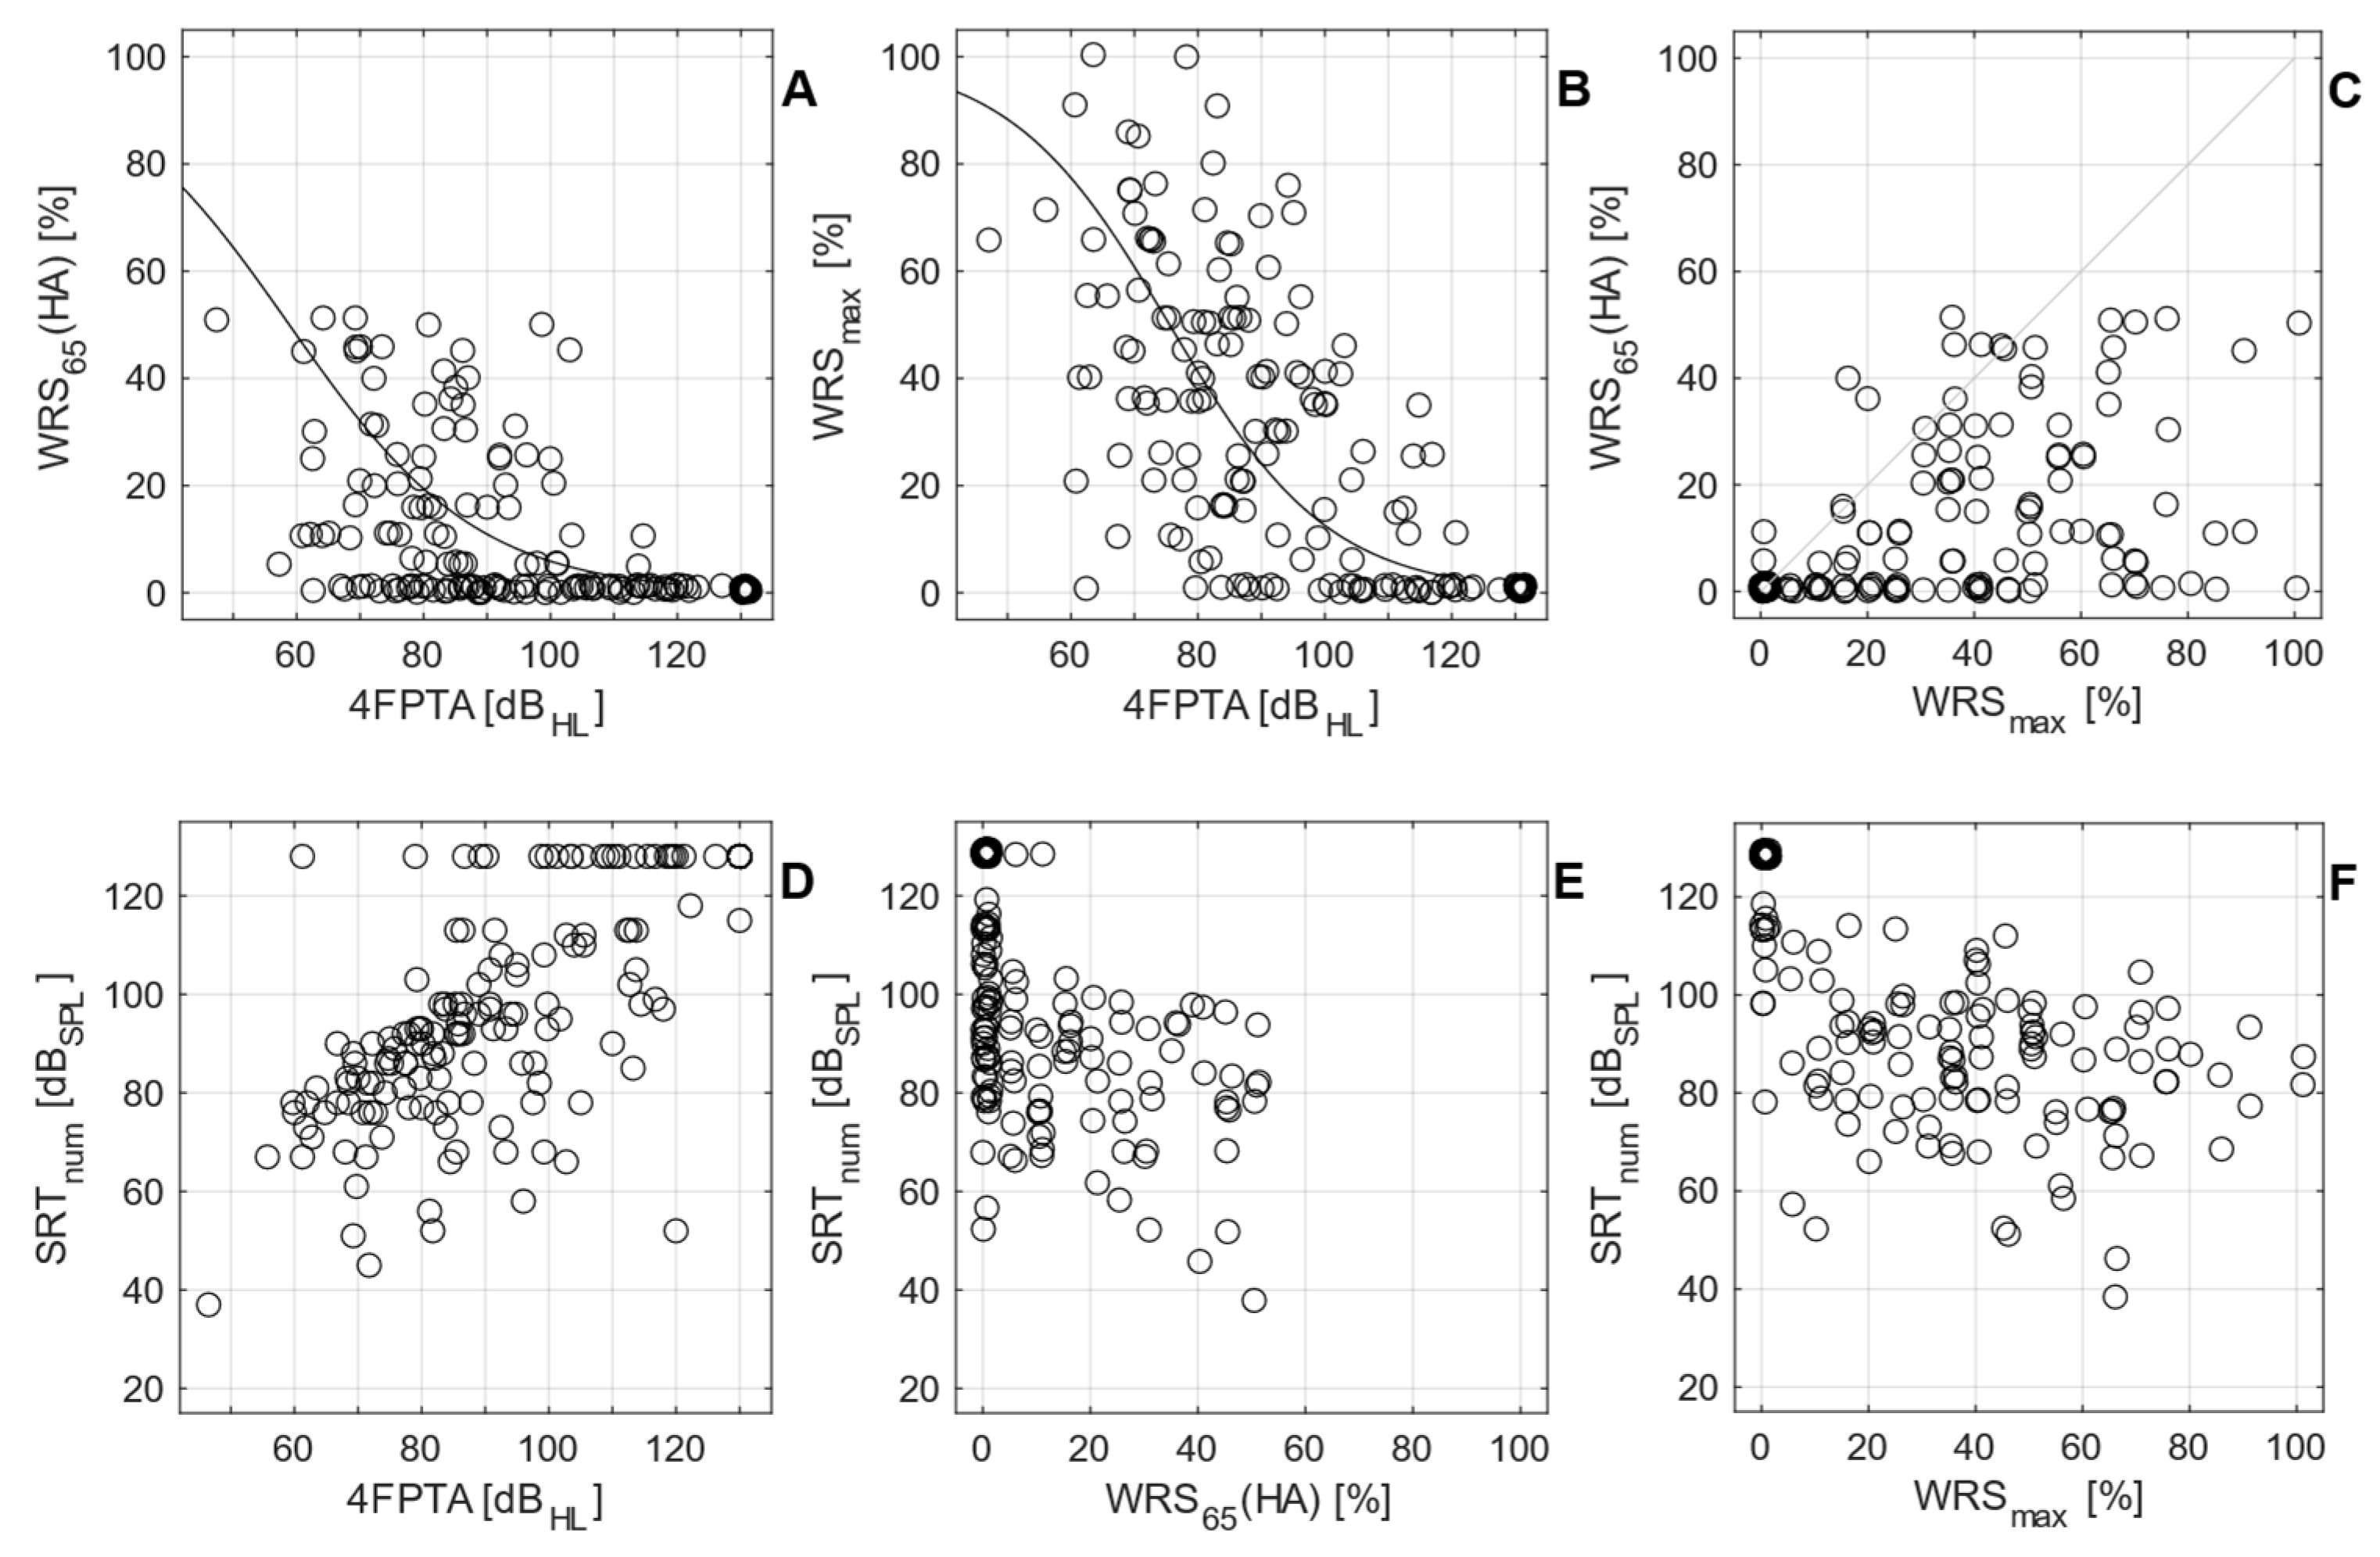
3.1. Preoperative Measurements
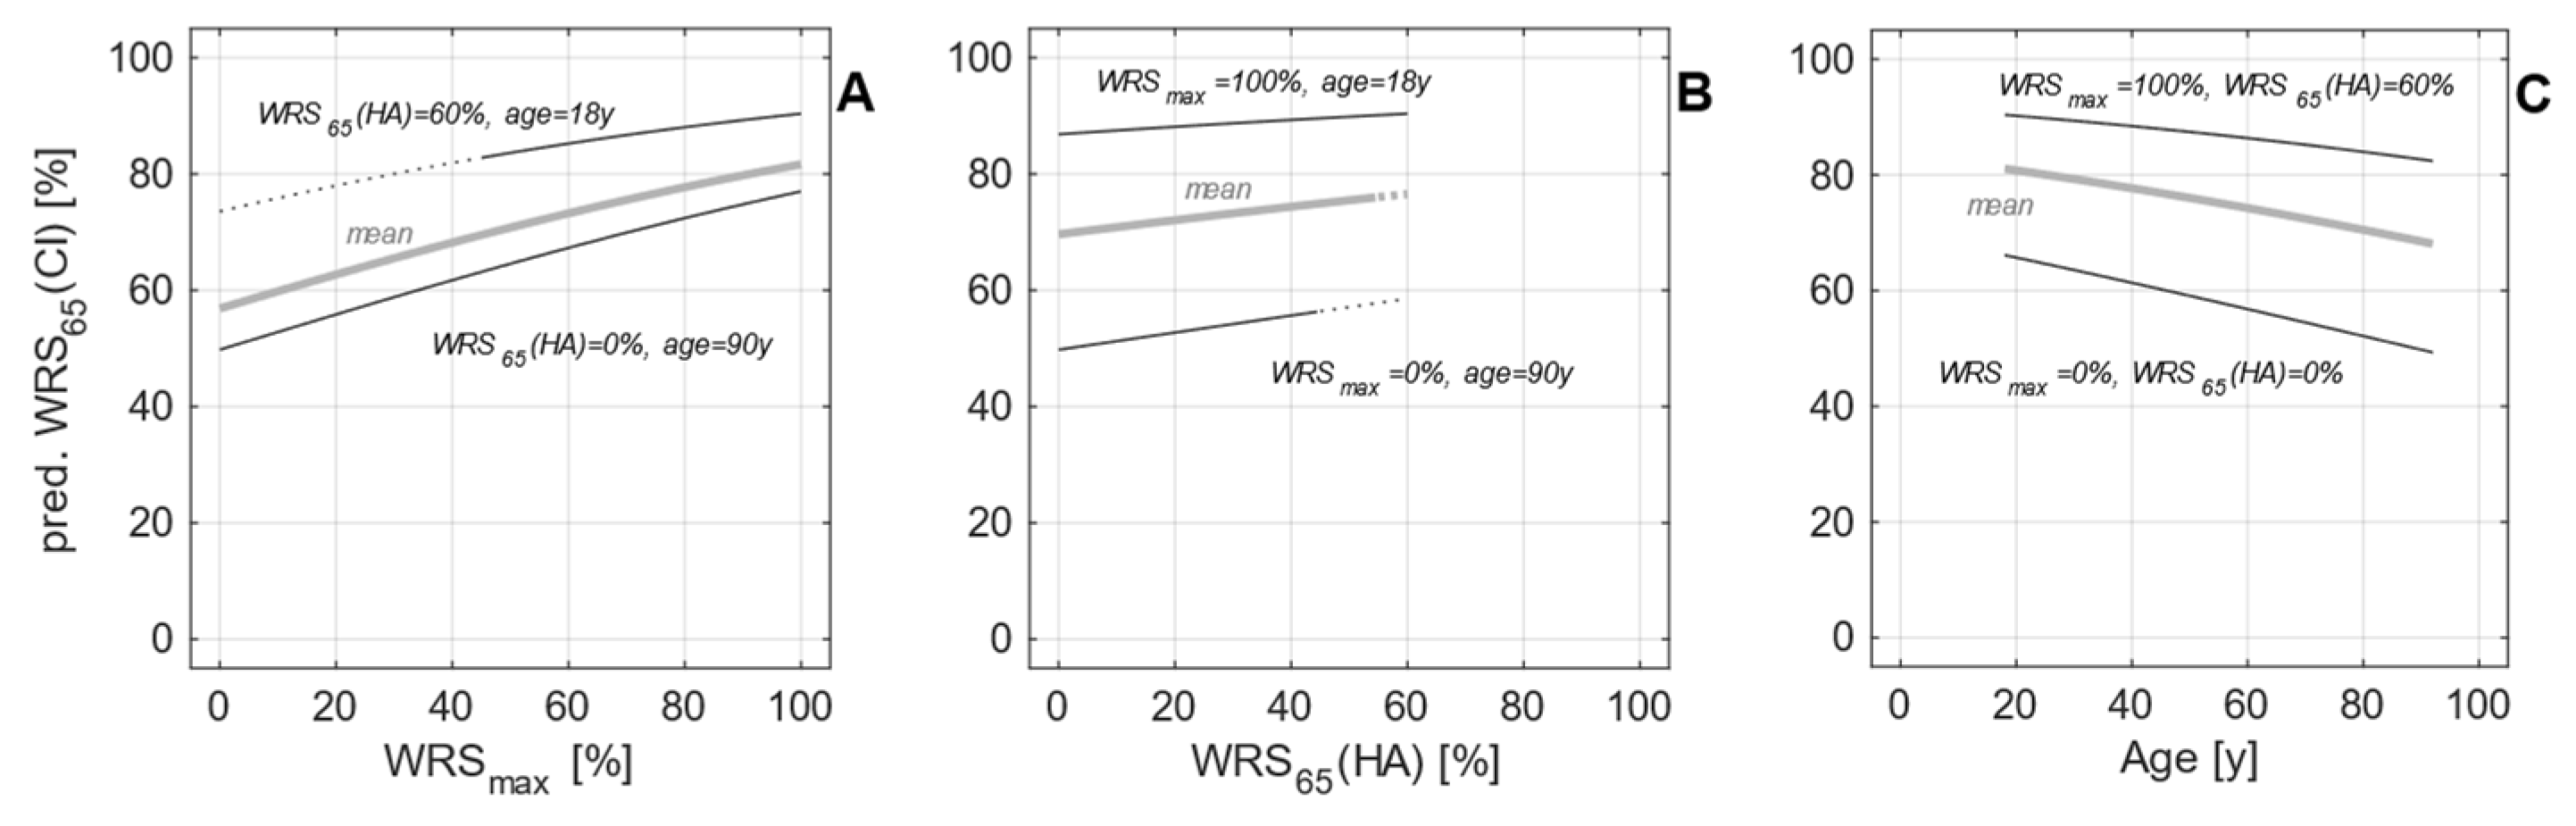
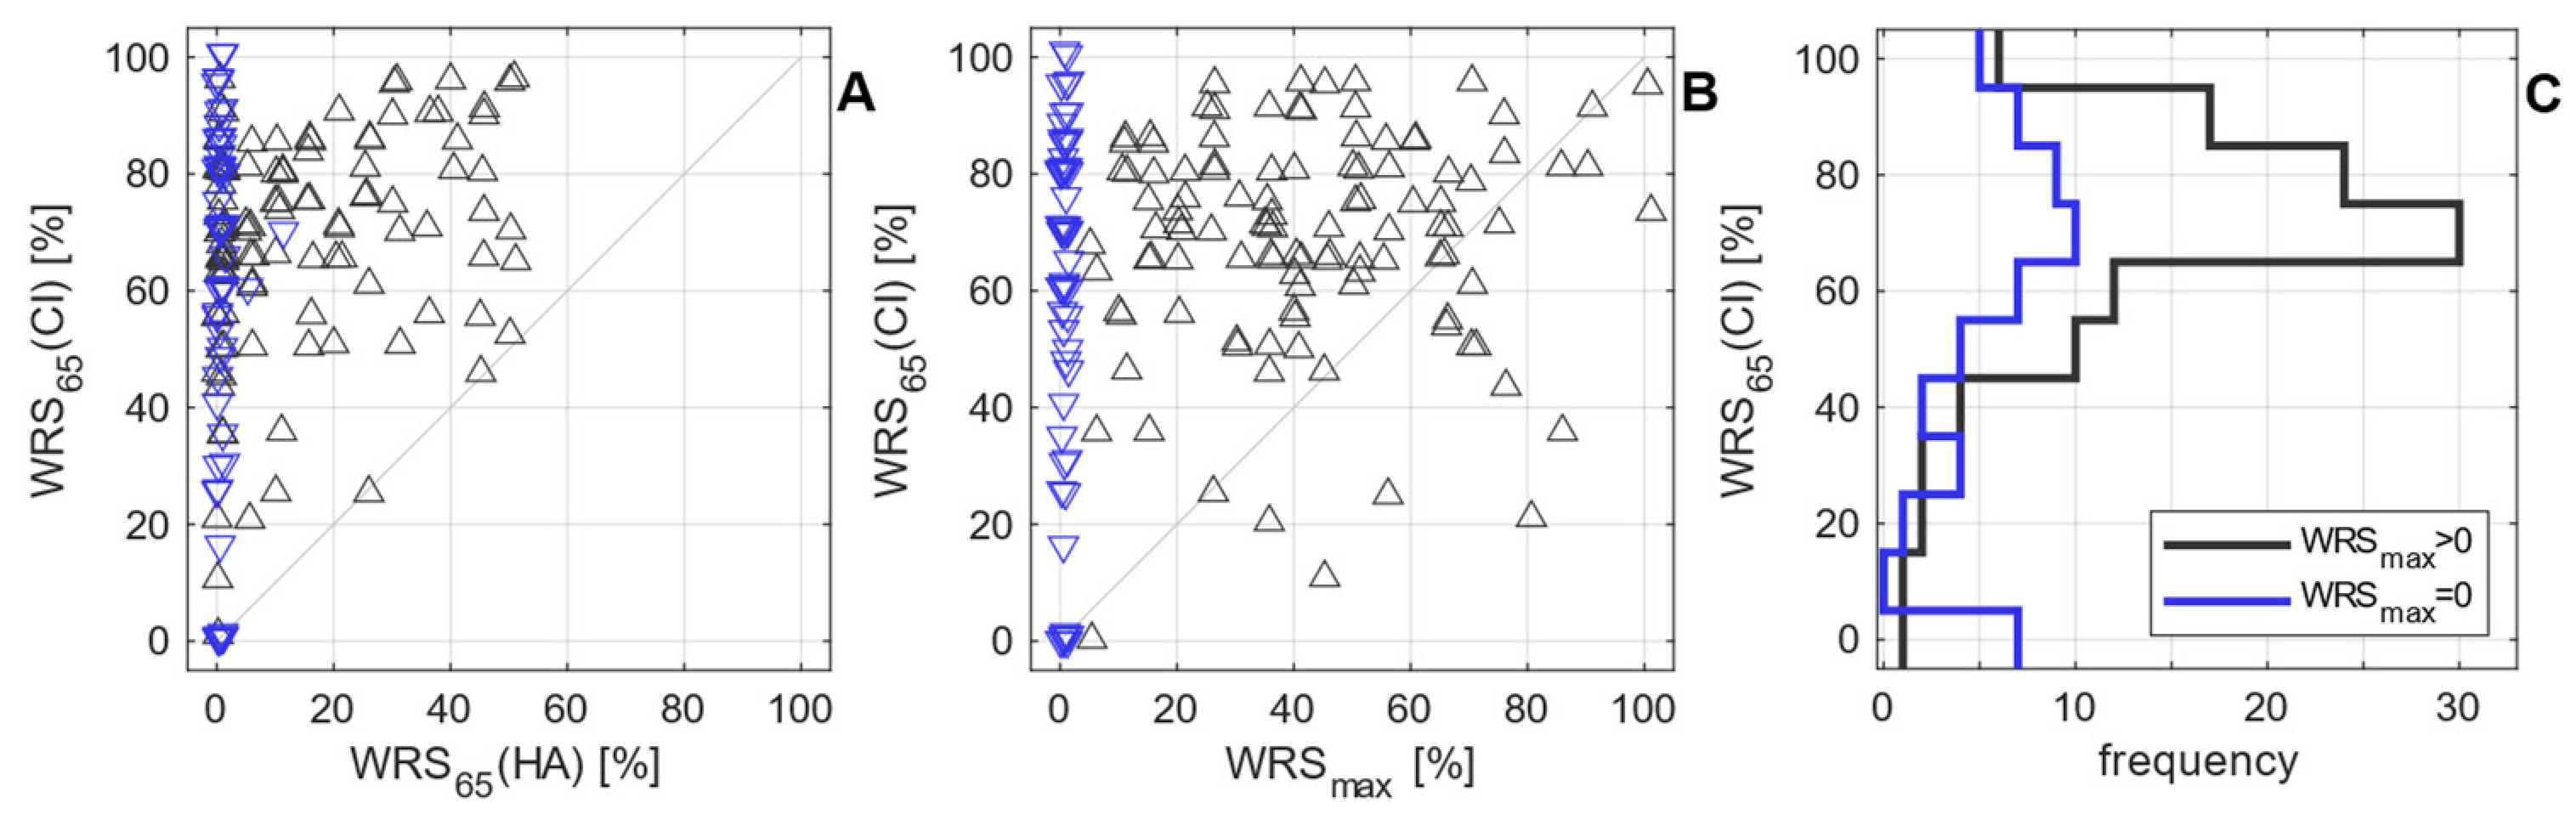
3.2. Postoperative Measurements
3.3. Model Expansion
4. Discussion
5. Conclusions
Author Contributions
Funding
Institutional Review Board Statement
Informed Consent Statement
Data Availability Statement
Conflicts of Interest
References
- National Institute for Health and Care Excellence. Cochlear Implants for Children and Adults with Severe to Profound Deafness. 2019. Available online: https://www.nice.org.uk/guidance/ta566 (accessed on 1 June 2023).
- Buchman, C.A.; Gifford, R.H.; Haynes, D.S.; Lenarz, T.; O’Donoghue, G.; Adunka, O.; Biever, A.; Briggs, R.J.; Carlson, M.L.; Dai, P.; et al. Unilateral Cochlear Implants for Severe, Profound, or Moderate Sloping to Profound Bilateral Sensorineural Hearing Loss: A Systematic Review and Consensus Statements. JAMA Otolaryngol. Head Neck Surg. 2020, 146, 942–953. [Google Scholar] [CrossRef] [PubMed]
- AWMF. Leitlinien: Cochlea-Implantat Versorgung und Zentral-Auditorische Implantate. 2020. Available online: https://www.awmf.org/uploads/tx_szleitlinien/017-071l_S2k_Cochlea-Implantat-Versorgung-zentral-auditorische-Implantate_2020-12.pdf (accessed on 1 June 2023).
- DGHNO-KHC. Weißbuch Cochlea-Implantat(CI)-Versorgung. 2nd Edition. 2021. Available online: https://cdn.hno.org/media/2021/ci-weissbuch-20-inkl-anlagen-datenblocke-und-zeitpunkte-datenerhebung-mit-logo-05-05-21.pdf (accessed on 1 June 2023).
- Van der Straaten, T.F.K.; Briaire, J.J.; Vickers, D.; Boermans, P.; Frijns, J.H.M. Selection Criteria for Cochlear Implantation in the United Kingdom and Flanders: Toward a Less Restrictive Standard. Ear Hear. 2020, 42, 68–75. [Google Scholar] [CrossRef]
- Hoppe, U.; Hocke, T.; Hast, A.; Iro, H. Cochlear Implantation in Candidates with Moderate-to-Severe Hearing Loss and Poor Speech Perception. Laryngoscope 2021, 131, E940–E945. [Google Scholar] [CrossRef] [PubMed]
- Turton, L.; Souza, P.; Thibodeau, L.; Hickson, L.; Gifford, R.; Bird, J.; Stropahl, M.; Gailey, L.; Fulton, B.; Scarinci, N.; et al. Guidelines for Best Practice in the Audiological Management of Adults with Severe and Profound Hearing Loss. Semin. Hear. 2020, 41, 141–246. [Google Scholar] [CrossRef] [PubMed]
- Hoppe, U.; Hast, A.; Hocke, T. Audiometry-Based Screening Procedure for Cochlear Implant Candidacy. Otol. Neurotol. 2015, 36, 1001–1005. [Google Scholar] [CrossRef]
- McRackan, T.R.; Fabie, J.E.; Burton, J.A.; Munawar, S.; Holcomb, M.A.; Dubno, J.R. Earphone and Aided Word Recognition Differences in Cochlear Implant Candidates. Otol. Neurotol. 2018, 39, e543–e549. [Google Scholar] [CrossRef]
- Kronlachner, M.; Baumann, U.; Stover, T.; Weissgerber, T. Investigation of the quality of hearing aid provision in seniors considering cognitive functions. Laryngorhinootologie 2018, 97, 852–859. [Google Scholar] [CrossRef]
- Franks, Z.G.; Jacob, A. The speech perception gap in cochlear implant patients. Cochlear Implants Int. 2019, 20, 176–181. [Google Scholar] [CrossRef]
- Lupo, J.E.; Biever, A.; Kelsall, D.C. Comprehensive hearing aid assessment in adults with bilateral severe-profound sensorineural hearing loss who present for Cochlear implant evaluation. Am. J. Otolaryngol. 2020, 41, 102300. [Google Scholar] [CrossRef]
- Weissgerber, T.; Muller, C.; Stover, T.; Baumann, U. Speech perception and cognitive abilities in seniors without subjective hearing loss. Laryngorhinootologie 2019, 98, 489–496. [Google Scholar] [CrossRef]
- Dörfler, C.; Hocke, T.; Hast, A.; Hoppe, U. Speech recognition with hearing aids for 10 standard audiograms. HNO 2020, 68, 93–99. [Google Scholar] [CrossRef] [PubMed]
- Digeser, F.M.; Engler, M.; Hoppe, U. Comparison of bimodal benefit for the use of DSL v5.0 and NAL-NL2 in cochlear implant listeners. Int. J. Audiol. 2020, 59, 383–391. [Google Scholar] [CrossRef] [PubMed]
- Engler, M.; Digeser, F.; Hoppe, U. Effectiveness of hearing aid provision for severe hearing loss. HNO 2022, 70, 520–532. [Google Scholar] [CrossRef]
- Rieck, J.H.; Beyer, A.; Mewes, A.; Caliebe, A.; Hey, M. Extended Preoperative Audiometry for Outcome Prediction and Risk Analysis in Patients Receiving Cochlear Implants. J. Clin. Med. 2023, 12, 3262. [Google Scholar] [CrossRef] [PubMed]
- Krüger, B.; Joseph, G.; Rost, U.; Strauss-Schier, A.; Lenarz, T.; Büchner, A. Performance groups in adult cochlear implant users: Speech perception results from 1984 until today. Otol. Neurotol. 2008, 29, 509–512. [Google Scholar] [CrossRef]
- Blamey, P.J.; Artieres, F.; Baskent, D.; Bergeron, F.; Beynon, A.; Burke, E.; Dillier, N.; Dowell, R.; Fraysse, B.; Gallégo, S.; et al. Factors affecting auditory performance of postlinguistically deaf adults using cochlear implants: An update with 2251 patients. Audiol. Neurotol. 2013, 18, 36–47. [Google Scholar] [CrossRef] [PubMed]
- Holden, L.K.; Finley, C.C.; Firszt, J.B.; Holden, T.A.; Brenner, C.; Potts, L.G.; Gotter, B.D.; Vanderhoof, S.S.; Mispagel, K.; Heydebrand, G.; et al. Factors affecting open-set word recognition in adults with cochlear implants. Ear Hear. 2013, 34, 342–360. [Google Scholar] [CrossRef] [PubMed]
- Zeh, R.; Baumann, U. Inpatient rehabilitation of adult CI users: Results in dependency of duration of deafness, CI experience and age. HNO 2015, 63, 557–576. [Google Scholar] [CrossRef]
- Hoppe, U.; Hocke, T.; Hast, A.; Iro, H. Maximum preimplantation monosyllabic score as predictor of cochlear implant outcome. HNO 2019, 67, 62–68. [Google Scholar] [CrossRef]
- Helbig, S.; Adel, Y.; Rader, T.; Stover, T.; Baumann, U. Long-term Hearing Preservation Outcomes After Cochlear Implantation for Electric-Acoustic Stimulation. Otol. Neurotol. 2016, 37, e353–e359. [Google Scholar] [CrossRef]
- Dalbert, A.; Huber, A.; Baumann, N.; Veraguth, D.; Roosli, C.; Pfiffner, F. Hearing Preservation After Cochlear Implantation May Improve Long-term Word Perception in the Electric-only Condition. Otol. Neurotol. 2016, 37, 1314–1319. [Google Scholar] [CrossRef] [PubMed]
- Buchman, C.A.; Herzog, J.A.; McJunkin, J.L.; Wick, C.C.; Durakovic, N.; Firszt, J.B.; Kallogjeri, D. Assessment of Speech Understanding After Cochlear Implantation in Adult Hearing Aid Users: A Nonrandomized Controlled Trial. JAMA Otolaryngol. Head Neck Surg. 2020, 146, 916–924. [Google Scholar] [CrossRef] [PubMed]
- Kelsall, D.; Lupo, J.; Biever, A. Longitudinal outcomes of cochlear implantation and bimodal hearing in a large group of adults: A multicenter clinical study. Am. J. Otolaryngol. 2021, 42, 102773. [Google Scholar] [CrossRef]
- Walia, A.; Shew, M.A.; Kallogjeri, D.; Wick, C.C.; Durakovic, N.; Lefler, S.M.; Ortmann, A.J.; Herzog, J.A.; Buchman, C.A. Electrocochleography and cognition are important predictors of speech perception outcomes in noise for cochlear implant recipients. Sci. Rep. 2022, 12, 3083. [Google Scholar] [CrossRef]
- Thangavelu, K.; Nitzge, M.; Weiß, R.M.; Mueller-Mazzotta, J.; Stuck, B.A.; Reimann, K. Role of cochlear reserve in adults with cochlear implants following post-lingual hearing loss. Eur. Arch. Oto-Rhino-Laryngol. 2022, 280, 1063–1071. [Google Scholar] [CrossRef]
- Hoppe, U.; Hast, A.; Hocke, T. Validation of a predictive model for speech discrimination after cochlear impIant provision. HNO 2023, 71, 53–59. [Google Scholar] [CrossRef] [PubMed]
- Dziemba, O.C.; Merz, S.; Hocke, T. Evaluative audiometry after cochlear implant provision. HNO 2023. [Google Scholar] [CrossRef]
- Dazert, S.; Thomas, J.P.; Loth, A.; Zahnert, T.; Stöver, T. Cochlear implantation—Diagnosis, indications, and auditory rehabilitation results. Dtsch. Arztebl. Int. 2020, 117, 690–700. [Google Scholar] [CrossRef]
- Stöver, T.; Plontke, S.K.; Guntinas-Lichius, O.; Welkoborsky, H.J.; Zahnert, T.; Delank, K.W.; Deitmer, T.; Esser, D.; Dietz, A.; Wienke, A.; et al. Conception and implementation of a certification system for quality control of cochlear implant treatment in Germany. HNO 2023, 71, 73–81. [Google Scholar] [CrossRef]
- Hahlbrock, K.H. Sprachaudiometrie: Grundlagen und Praktische Anwendung Einer Sprachaudiometrie für das Deutsche Sprachgebiet; Thieme Verlag: Stuttgart, Germany, 1957. [Google Scholar]
- DIN45621-1:1995-08; Word Lists for Recognition Tests–Part 1: Monosyllabic and Polysyllabic Words. Beuth Berlin: Berlin, Germany, 1995.
- Braun, T.; Wimmer, M.; Hempel, J.M. Two formulas for exact calculation of hearing loss for numbers. HNO 2012, 60, 814–816. [Google Scholar] [CrossRef]
- Winkler, A.; Holube, I. Test-retest reliability of the Freiburg monosyllabic speech test. HNO 2016, 64, 564–571. [Google Scholar] [CrossRef] [PubMed]
- Cohen, P.R.; Howe, A.E. How Evaluation Guides AI Research: The Message Still Counts More Than the Medium. AI Mag. 1985, 9, 35–43. [Google Scholar] [CrossRef]
- Matlab Documentation. 2023. Available online: https://de.mathworks.com/help/stats/wilkinson-notation.html (accessed on 12 June 2023).
- Olusanya, B.O.; Davis, A.C.; Hoffman, H.J. Hearing loss grades and the International classification of functioning, disability and health. Bull. World Health Organ. 2019, 97, 725–728. [Google Scholar] [CrossRef] [PubMed]
- World Health Organization. World Report on Hearing; World Health Organization: Geneva, Switzerland, 2021; Available online: https://www.who.int/publications/i/item/9789240020481 (accessed on 12 June 2023).

| Size | Age [Years] | 4FPTA [dBHL] | WRSmax [%] | WRS65(HA) | Duration of Hearing Impairment [Years] | Duration of Unaided Hearing Impairment [Years] | SRTnum [dBSPL] | |
|---|---|---|---|---|---|---|---|---|
| Group 1 WRSmax > 0% | 109 | 67 ± 14 | 83 ± 14 | 42 ± 23 | 15 ± 16 | 24 ± 18 | 9 ± 13 | 85 ± 15 |
| Group 2 WRSmax = 0% | 56 | 64 ± 14 | 114 ± 17 | 0 | 0 ± 1 | 20 ± 22 | 10 ± 16 | 124 ± 10 |
| total | 165 | 66 ± 14 | 94 ± 21 | 27 ± 27 | 10 ± 15 | 22 ± 20 | 9 ± 14 | 98 ± 23 |
| Group | Size | WRS65(CI) [%] | No. of Cases with a Score of … | |||
|---|---|---|---|---|---|---|
| Mean ± SD | Median | WRS65(CI) = 0% | WRS65(CI): >0–<50% | WRS65(CI): 50–100% | ||
| Group 1 WRSmax > 0% | 109 | 68 ± 19 | 70 | 1 (1%) | 12 (11%) | 96 (88%) |
| Group 2 WRSmax = 0% | 56 | 59 ± 30 | 70 | 7 (13%) | 9 (16%) | 40 (71%) |
| total | 165 | 65 ± 24 | 70 | 8 (5%) | 21 (13%) | 136 (82%) |
| Estimate | Standard Error | t Statistic | p | |
|---|---|---|---|---|
| Constant, . | 0.35 | 0.04 | 8.44 | 3 × 10⁻¹⁷ |
| DHI [year−1] | −0.0027 | 0.0019 | −1.41 | 0.16 |
| DuHI, [year−1] | −0.0171 | 0.0056 | −3.05 | 0.002 |
| DHI:DuHI [year−2] | −4.20 | 0.0001 | −0.41 | 0.68 |
| Estimate | Standard Error | t Statistic | p | |
|---|---|---|---|---|
| Constant, . | 0.41 | 0.04 | 10.75 | 6 × 10⁻²⁷ |
| DHI, [year−1] | −0.0125 | 0.0013 | −9.73 | 2 × 10⁻²² |
Disclaimer/Publisher’s Note: The statements, opinions and data contained in all publications are solely those of the individual author(s) and contributor(s) and not of MDPI and/or the editor(s). MDPI and/or the editor(s) disclaim responsibility for any injury to people or property resulting from any ideas, methods, instructions or products referred to in the content. |
© 2023 by the authors. Licensee MDPI, Basel, Switzerland. This article is an open access article distributed under the terms and conditions of the Creative Commons Attribution (CC BY) license (https://creativecommons.org/licenses/by/4.0/).
Share and Cite
Hoppe, U.; Hast, A.; Hornung, J.; Hocke, T. Evolving a Model for Cochlear Implant Outcome. J. Clin. Med. 2023, 12, 6215. https://doi.org/10.3390/jcm12196215
Hoppe U, Hast A, Hornung J, Hocke T. Evolving a Model for Cochlear Implant Outcome. Journal of Clinical Medicine. 2023; 12(19):6215. https://doi.org/10.3390/jcm12196215
Chicago/Turabian StyleHoppe, Ulrich, Anne Hast, Joachim Hornung, and Thomas Hocke. 2023. "Evolving a Model for Cochlear Implant Outcome" Journal of Clinical Medicine 12, no. 19: 6215. https://doi.org/10.3390/jcm12196215
APA StyleHoppe, U., Hast, A., Hornung, J., & Hocke, T. (2023). Evolving a Model for Cochlear Implant Outcome. Journal of Clinical Medicine, 12(19), 6215. https://doi.org/10.3390/jcm12196215