
Transcutaneous CO2 Monitoring in Extremely Low Birth Weight Premature Infants

 , , , , ,
Abstract
:
1. Introduction
2. Materials and Methods
2.1. Study Population
2.2. Study Design
2.3. Statistical Analysis
3. Results
4. Discussion
5. Conclusions
Author Contributions
Funding
Institutional Review Board Statement
Informed Consent Statement
Data Availability Statement
Conflicts of Interest
References
- Wong, S.K.; Chim, M.; Allen, J.; Butler, A.; Tyrrell, J.; Hurley, T.; McGovern, M.; Omer, M.; Lagan, N.; Meehan, J.; et al. Carbon dioxide levels in neonates: What are safe parameters? Pediatr. Res. 2022, 91, 1049–1056. [Google Scholar] [CrossRef] [PubMed]
- Hochwald, O.; Borenstein-Levin, L.; Dinur, G.; Jubran, H.; Ben-David, S.; Kugelman, A. Continuous Noninvasive Carbon Dioxide Monitoring in Neonates: From Theory to Standard of Care. Pediatrics 2019, 144, e20183640. [Google Scholar] [CrossRef] [PubMed]
- Rozycki, H.J.; Sysyn, G.D.; Marshall, M.K.; Malloy, R.; Wiswell, T.E. Mainstream end-tidal carbon dioxide monitoring in the neonatal intensive care unit. Pediatrics 1998, 101 Pt 1, 648–653. [Google Scholar] [CrossRef] [PubMed]
- Kugelman, A.; Zeiger-Aginsky, D.; Bader, D.; Shoris, I.; Riskin, A. A novel method of distal end-tidal CO2 capnography in intubated infants: Comparison with arterial CO2 and with proximal mainstream end-tidal CO2. Pediatrics 2008, 122, e1219–e1224. [Google Scholar] [CrossRef] [PubMed]
- Aliwalas, L.L.D.; Noble, L.; Nesbitt, K.; Fallah, S.; Shah, V.; Shah, P.S. Agreement of carbon dioxide levels measured by arterial, transcutaneous and end tidal methods in preterm infants < or = 28 weeks gestation. J. Perinatol. 2005, 25, 26–29. [Google Scholar] [CrossRef]
- Singh, B.S.; Gilbert, U.; Singh, S.; Govindaswami, B. Sidestream microstream end tidal carbon dioxide measurements and blood gas correlations in neonatal intensive care unit. Pediatr. Pulmonol. 2013, 48, 250–256. [Google Scholar] [CrossRef] [PubMed]
- Trevisanuto, D.; Giuliotto, S.; Cavallin, F.; Doglioni, N.; Toniazzo, S.; Zanardo, V. End-tidal carbon dioxide monitoring in very low birth weight infants: Correlation and agreement with arterial carbon dioxide. Pediatr. Pulmonol. 2012, 47, 367–372. [Google Scholar] [CrossRef]
- Kugelman, A.; Golan, A.; Riskin, A.; Shoris, I.; Ronen, M.; Qumqam, N.; Bader, D.; Bromiker, R. Impact of Continuous Capnography in Ventilated Neonates: A Randomized, Multicenter Study. J. Pediatr. 2016, 168, 56–61.e2. [Google Scholar] [CrossRef]
- Eberhard, P. The design, use, and results of transcutaneous carbon dioxide analysis: Current and future directions. Anesth. Analg. 2007, 105, S48–S52. [Google Scholar] [CrossRef]
- Ochiai, M.; Kurata, H.; Inoue, H.; Ichiyama, M.; Fujiyoshi, J.; Watabe, S.; Hiroma, T.; Nakamura, T.; Ohga, S. Transcutaneous blood gas monitoring among neonatal intensive care units in Japan. Pediatr. Int. 2020, 62, 169–174. [Google Scholar] [CrossRef]
- Rüdiger, M.; Töpfer, K.; Hammer, H.; Schmalisch, G.; Wauer, R.R. A survey of transcutaneous blood gas monitoring among European neonatal intensive care units. BMC Pediatr. 2005, 5, 30. [Google Scholar] [CrossRef] [PubMed]
- Hand, I.L.; Shepard, E.K.; Krauss, A.N.; Auld, P.A. Discrepancies between transcutaneous and end-tidal carbon dioxide monitoring in the critically ill neonate with respiratory distress syndrome. Crit. Care Med. 1989, 17, 556–559. [Google Scholar] [CrossRef] [PubMed]
- Geven, W.B.; Nagler, E.; de Boo, T.; Lemmens, W. Combined transcutaneous oxygen, carbon dioxide tensions and end-expired CO2 levels in severely ill newborns. Adv. Exp. Med. Biol. 1987, 220, 115–120. [Google Scholar] [CrossRef] [PubMed]
- Epstein, M.F.; Cohen, A.R.; Feldman, H.A.; Raemer, D.B. Estimation of PaCO2 by two noninvasive methods in the critically ill newborn infant. J. Pediatr. 1985, 106, 282–286. [Google Scholar] [CrossRef] [PubMed]
- Tingay, D.G.; Stewart, M.J.; Morley, C.J. Monitoring of end tidal carbon dioxide and transcutaneous carbon dioxide during neonatal transport. Arch. Dis. Child. Fetal Neonatal Ed. 2005, 90, F523–F526. [Google Scholar] [CrossRef] [PubMed]
- Werther, T.; Aichhorn, L.; Stellberg, S.; Cardona, F.S.; Klebermass-Schrehof, K.; Berger, A.; Schmölzer, G.M.; Wagner, M. Monitoring of carbon dioxide in ventilated neonates: A prospective observational study. Arch. Dis. Child. Fetal Neonatal Ed. 2022, 107, 293–298. [Google Scholar] [CrossRef] [PubMed]
- Tingay, D.G.; Mun, K.S.; Perkins, E.J. End tidal carbon dioxide is as reliable as transcutaneous monitoring in ventilated postsurgical neonates. Arch. Dis. Child. Fetal Neonatal Ed. 2013, 98, F161–F164. [Google Scholar] [CrossRef] [PubMed]
- Aly, S.; El-Dib, M.; Mohamed, M.; Aly, H. Transcutaneous Carbon Dioxide Monitoring with Reduced-Temperature Probes in Very Low Birth Weight Infants. Am. J. Perinatol. 2017, 34, 480–485. [Google Scholar] [CrossRef]
- Bland, J.M.; Altman, D.G. Agreement between methods of measurement with multiple observations per individual. J. Biopharm. Stat. 2007, 17, 571–582. [Google Scholar] [CrossRef]
- Mukhopadhyay, S.; Maurer, R.; Puopolo, K.M. Neonatal Transcutaneous Carbon Dioxide Monitoring—Effect on Clinical Management and Outcomes. Respir. Care 2016, 61, 90–97. [Google Scholar] [CrossRef]
- van Weteringen, W.; van Essen, T.; Gangaram-Panday, N.H.; Goos, T.G.; de Jonge, R.C.J.; Reiss, I.K.M. Validation of a New Transcutaneous tcPO2/tcPCO2 Sensor with an Optical Oxygen Measurement in Preterm Neonates. Neonatology 2020, 117, 628–636. [Google Scholar] [CrossRef] [PubMed]
- Sullivan, K.P.; White, H.O.; Grover, L.E.; Negron, J.J.; Lee, A.F.; Rhein, L.M. Transcutaneous carbon dioxide pattern and trend over time in preterm infants. Pediatr. Res. 2021, 90, 840–846. [Google Scholar] [CrossRef] [PubMed]
- Janaillac, M.; Labarinas, S.; Pfister, R.E.; Karam, O. Accuracy of Transcutaneous Carbon Dioxide Measurement in Premature Infants. Crit. Care Res. Pract. 2016, 2016, 8041967. [Google Scholar] [CrossRef] [PubMed]
- Fabres, J.; Carlo, W.A.; Phillips, V.; Howard, G.; Ambalavanan, N. Both extremes of arterial carbon dioxide pressure and the magnitude of fluctuations in arterial carbon dioxide pressure are associated with severe intraventricular hemorrhage in preterm infants. Pediatrics 2007, 119, 299–305. [Google Scholar] [CrossRef] [PubMed]
- Bhat, R.; Kim, W.D.; Shukla, A.; Vidyasagar, D. Simultaneous tissue pH and transcutaneous carbon dioxide monitoring in critically ill neonates. Crit. Care Med. 1981, 9, 744–749. [Google Scholar] [CrossRef] [PubMed]
- Uslu, S.; Bulbul, A.; Dursun, M.; Zubarioglu, U.; Turkoglu, E.; Guran, O. Agreement of Mixed Venous Carbon Dioxide Tension (PvCO2) and Transcutaneous Carbon Dioxide (PtCO2) Measurements in Ventilated Infants. Iran. J. Pediatr. 2015, 25, e184. [Google Scholar] [CrossRef] [PubMed]
- Baumann, P.; Gotta, V.; Adzikah, S.; Bernet, V. Accuracy of a Novel Transcutaneous PCO2 and PO2 Sensor with Optical PO2 Measurement in Neonatal Intensive Care: A Single-Centre Prospective Clinical Trial. Neonatology 2022, 119, 230–237. [Google Scholar] [CrossRef] [PubMed]
- Tingay, D.G.; Mills, J.F.; Morley, C.J.; Pellicano, A.; Dargaville, P.A. Indicators of optimal lung volume during high-frequency oscillatory ventilation in infants. Crit. Care Med. 2013, 41, 237–244. [Google Scholar] [CrossRef]
- McIntosh, N.; Becher, J.C.; Cunningham, S.; Stenson, B.; Laing, I.A.; Lyon, A.J.; Badger, P. Clinical diagnosis of pneumothorax is late: Use of trend data and decision support might allow preclinical detection. Pediatr. Res. 2000, 48, 408–415. [Google Scholar] [CrossRef]
- Sivan, Y.; Eldadah, M.K.; Cheah, T.E.; Newth, C.J. Estimation of arterial carbon dioxide by end-tidal and transcutaneous PCO2 measurements in ventilated children. Pediatr. Pulmonol. 1992, 12, 153–157. [Google Scholar] [CrossRef]


| Premature Neonates n = 94 | |
|---|---|
| Gestational Age, weeks | 26.4 (26.0, 28.3) |
| Birth weight, g | 800 (702, 900) |
| Small for gestational age | 8 (8) |
| Prenatal steroids | 65 (69) |
| Preeclampsia | 25 (27) |
| Multiple births | 26 (28) |
| Male gender | 40 (43) |
| Delivery mode—Cesarean section | 72 (77) |
| Apgar 5’ | 8 (6, 9) |
| Intubation at delivery room | 41 (44) |
| Umbilical cord pH | 7.27 (7.19, 7.33) |
| RDS requiring surfactant treatment | 56 (60) |
| Ionotropic support during first week | 5 (6) |
| Sepsis during the first week | 5 (6) |
| Deceased during first week | 2 (2) |
| Deceased during NICU stay | 6 (6) |
| Number of samples per infant | 19 (14, 23) |
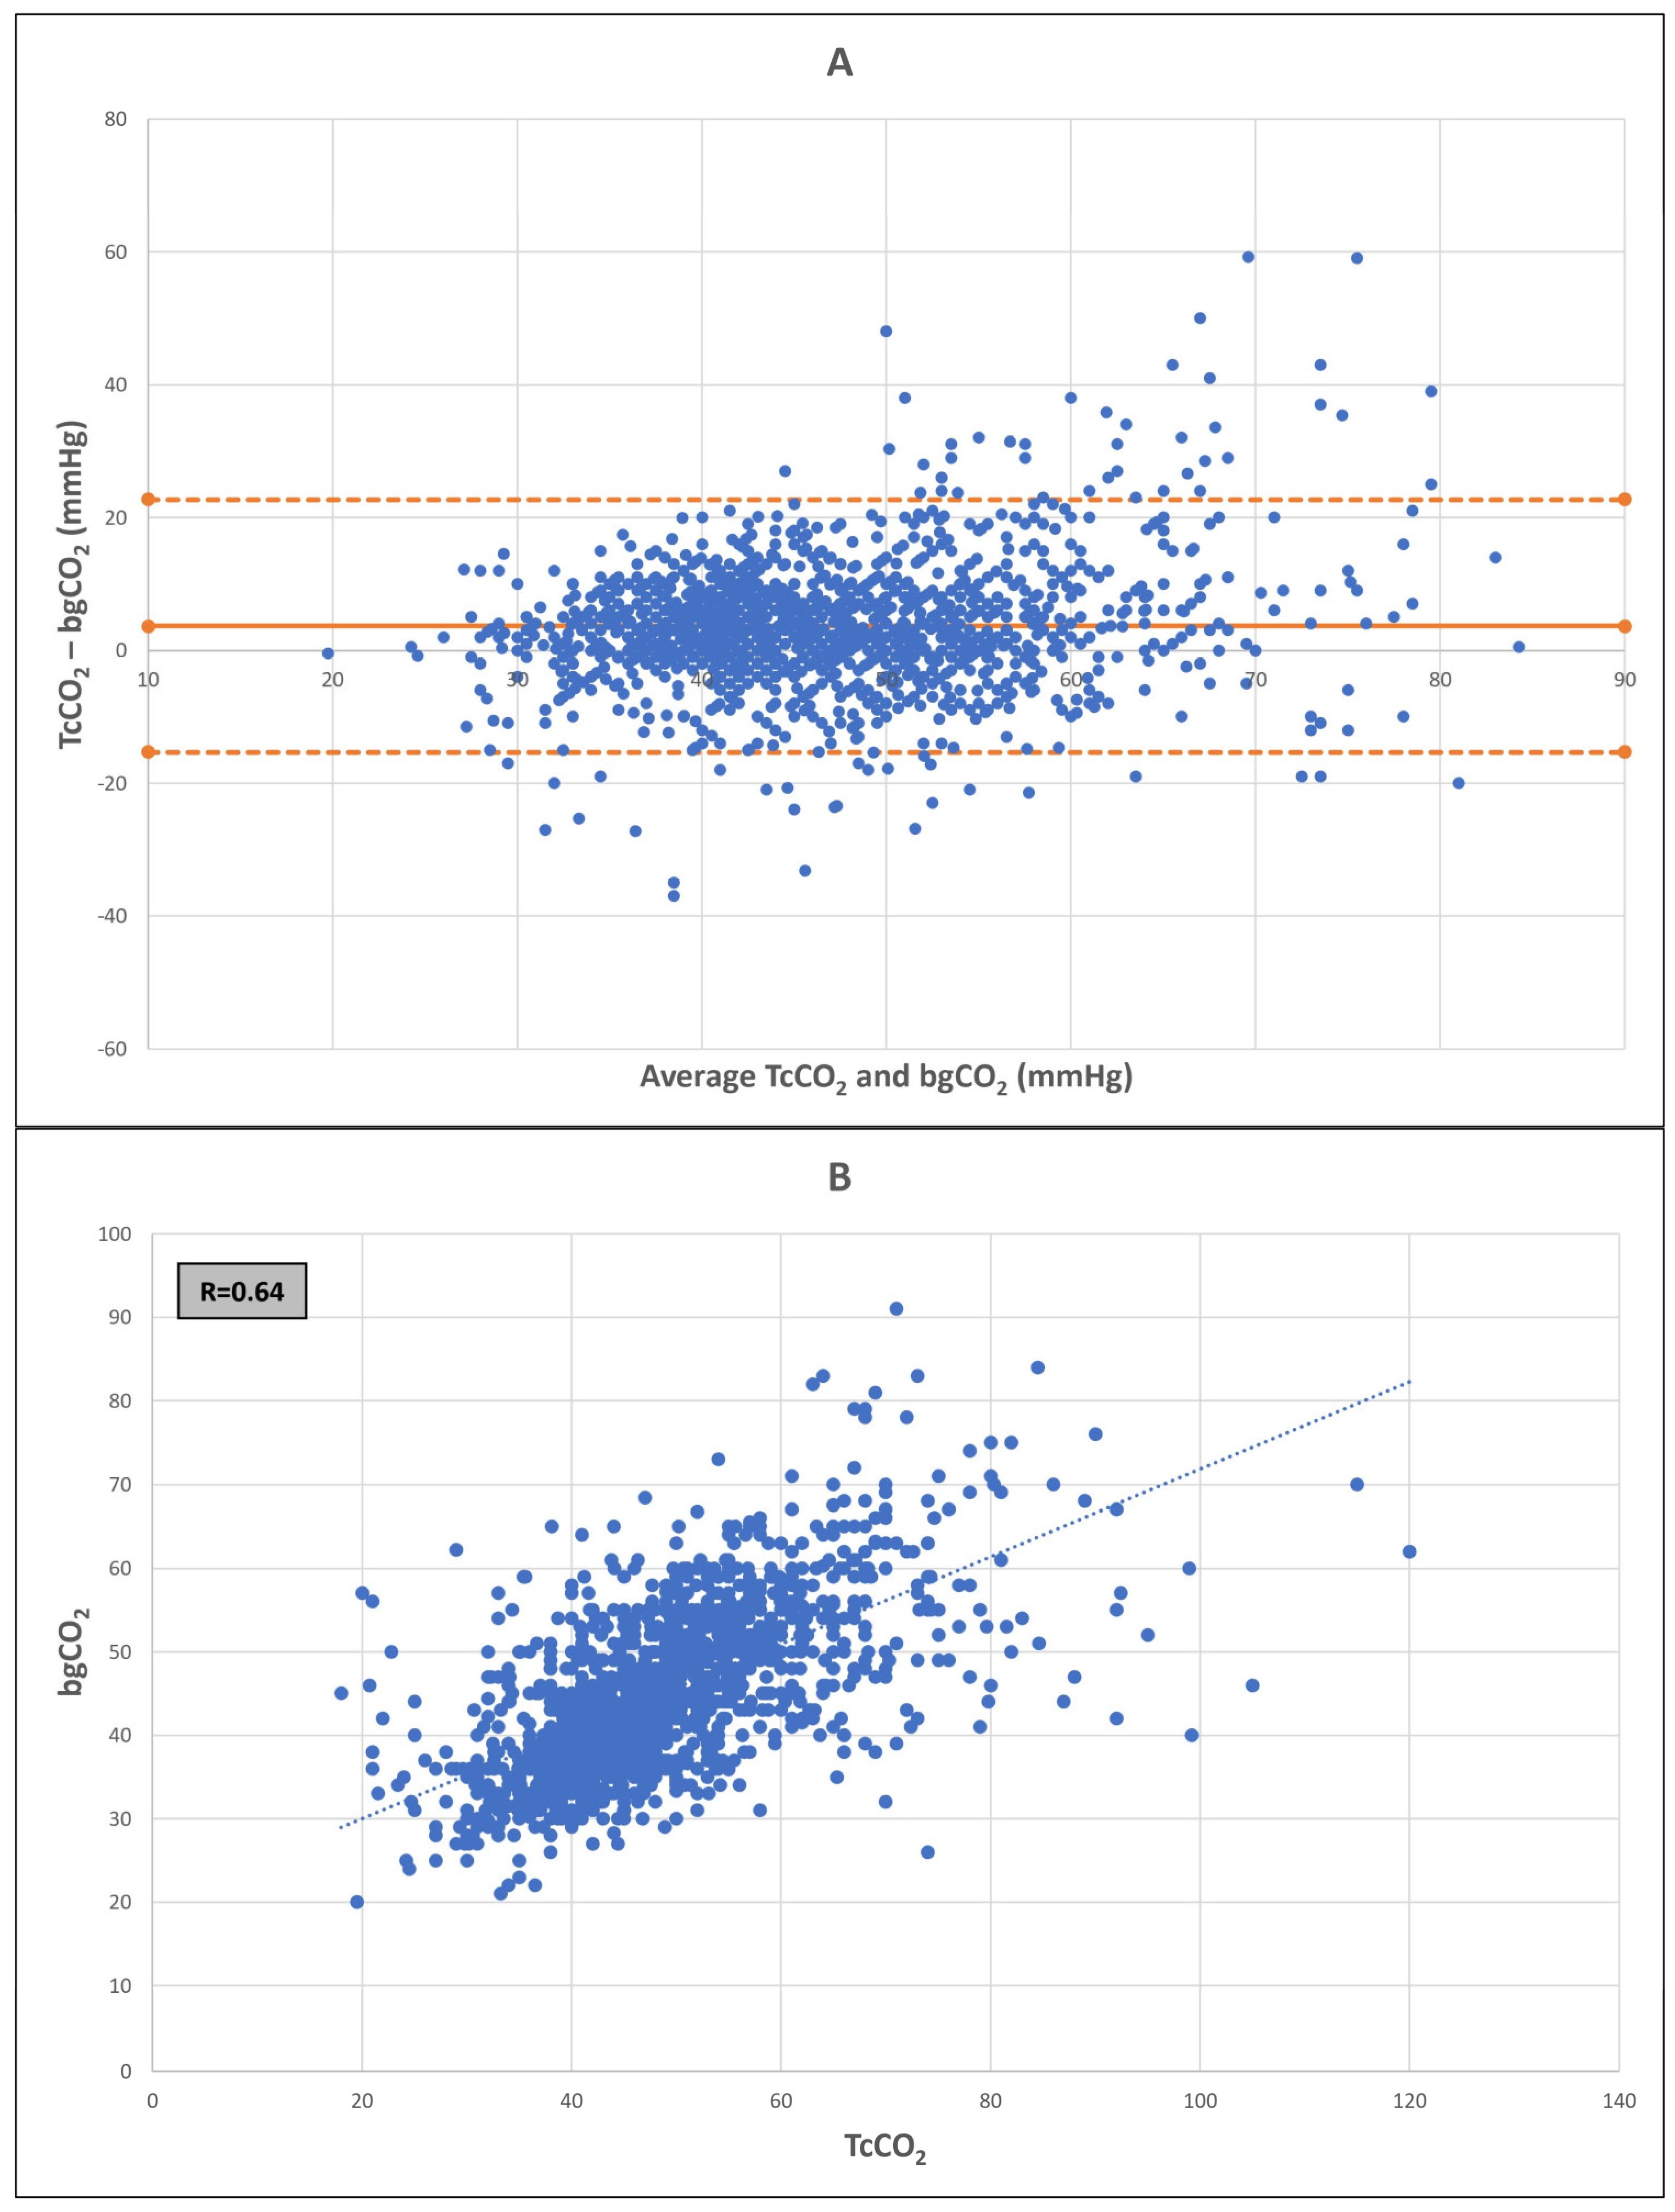
| Parameter | No. of Samples | R | Bias (SD) | Lower LoA, Upper LoA |
|---|---|---|---|---|
| Per TcCO2 measurements range | ||||
| All (20–115 mmHg) | 1828 | 0.64 | 3.6 (9.1) | −14.3, 21.4 |
| 30–60 mmHg | 1576 | 0.60 | 2.3 (6.8) | −11.1, 15.7 |
| 25–70 mmHg | 1724 | 0.65 | 2.9 (7.4) | −11.8, 17.6 |
| Per age (days) at sampling * | ||||
| Day of life 1 | 286 | 0.75 | 1 (6.8) | −12.3, 14.4 |
| Day of life 1–3 | 887 | 0.71 | 2.0 (6.7) | −11.1, 15.1 |
| Day of life 4+ | 851 | 0.59 | 3.8 (8.1) | −12.0, 19.6 |
| Per sampling mode * | ||||
| Capillary | 454 | 0.67 | 3.2 (8.1) | −12.6, 19.1 |
| Arterial | 1019 | 0.67 | 2.9 (7.4) | −11.6, 17.6 |
| Venous | 88 | 0.72 | 1.8 (6.2) | −10.3, 13.9 |
| Per mode of ventilation * | ||||
| Non-invasive ventilation ^ | 900 | 0.65 | 3.1 (7.1) | −10.8, 17.1 |
| Invasive ventilation | 684 | 0.61 | 2.52 (8.1) | −13.6, 18.3 |
| HFOV | 243 | 0.6 | 2.28 (9.3) | −16.1, 20.6 |
| CMV | 442 | 0.62 | 2.6 (7.9) | −12.7, 18.1 |
Disclaimer/Publisher’s Note: The statements, opinions and data contained in all publications are solely those of the individual author(s) and contributor(s) and not of MDPI and/or the editor(s). MDPI and/or the editor(s) disclaim responsibility for any injury to people or property resulting from any ideas, methods, instructions or products referred to in the content. |
© 2023 by the authors. Licensee MDPI, Basel, Switzerland. This article is an open access article distributed under the terms and conditions of the Creative Commons Attribution (CC BY) license (https://creativecommons.org/licenses/by/4.0/).
Share and Cite
Borenstein-Levin, L.; Avishay, N.; Soffer, O.; Arnon, S.; Riskin, A.; Dinur, G.; Lavie-Nevo, K.; Gover, A.; Kugelman, A.; Hochwald, O. Transcutaneous CO2 Monitoring in Extremely Low Birth Weight Premature Infants. J. Clin. Med. 2023, 12, 5757. https://doi.org/10.3390/jcm12175757
Borenstein-Levin L, Avishay N, Soffer O, Arnon S, Riskin A, Dinur G, Lavie-Nevo K, Gover A, Kugelman A, Hochwald O. Transcutaneous CO2 Monitoring in Extremely Low Birth Weight Premature Infants. Journal of Clinical Medicine. 2023; 12(17):5757. https://doi.org/10.3390/jcm12175757
Chicago/Turabian StyleBorenstein-Levin, Liron, Noa Avishay, Orit Soffer, Shmuel Arnon, Arieh Riskin, Gil Dinur, Karen Lavie-Nevo, Ayala Gover, Amir Kugelman, and Ori Hochwald. 2023. "Transcutaneous CO2 Monitoring in Extremely Low Birth Weight Premature Infants" Journal of Clinical Medicine 12, no. 17: 5757. https://doi.org/10.3390/jcm12175757
APA StyleBorenstein-Levin, L., Avishay, N., Soffer, O., Arnon, S., Riskin, A., Dinur, G., Lavie-Nevo, K., Gover, A., Kugelman, A., & Hochwald, O. (2023). Transcutaneous CO2 Monitoring in Extremely Low Birth Weight Premature Infants. Journal of Clinical Medicine, 12(17), 5757. https://doi.org/10.3390/jcm12175757