

Screening for Preeclampsia and Fetal Growth Restriction in the First Trimester in Women without Chronic Hypertension
 , , , , , ,
Abstract
:1. Introduction
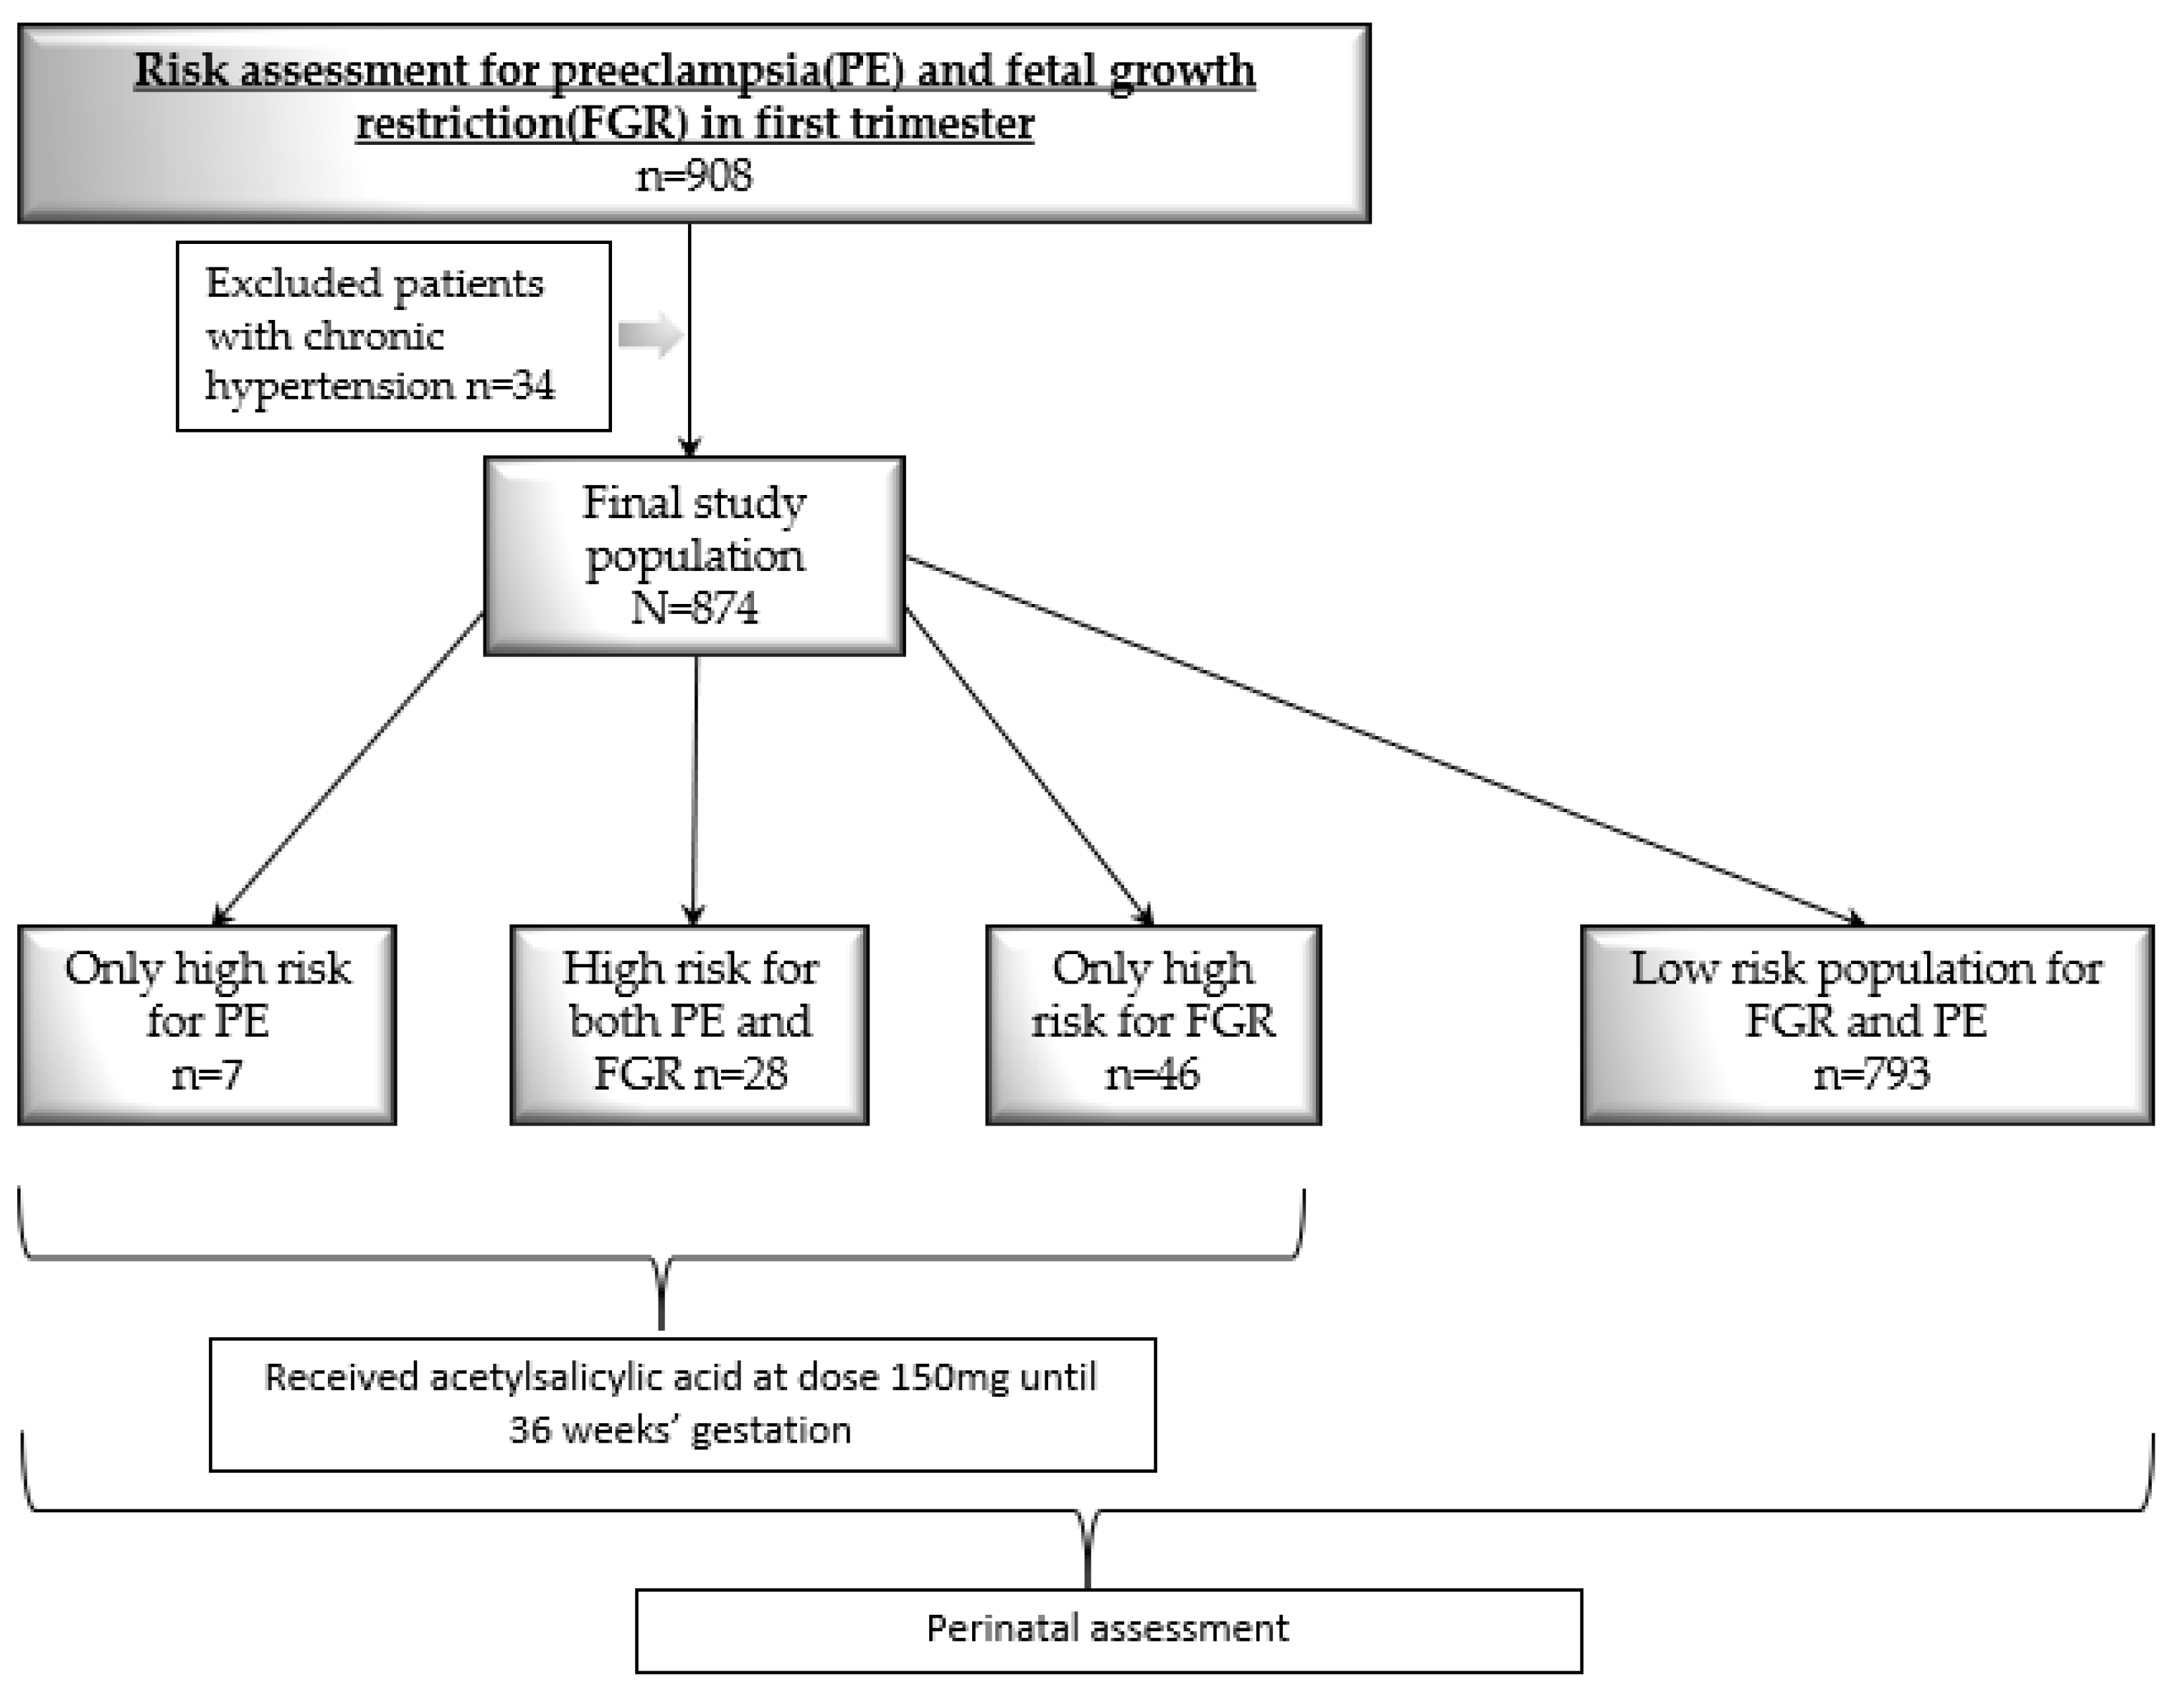
2. Patients and Methods
- Hematological disorders (thrombocytopenia, DIC, hemolysis).
- Serum creatinine content > 1.1 mg/dL or a 2-fold increase in its baseline level where no other kidney disease is observed.
- Increased serum liver enzymes ≥ 2 times the upper limit of the standard or severe right upper quadrant or epigastric pain.
- Neurological signs or visual impairment.
- Pulmonary edema.
- Intrauterine growth restriction [16].
3. Statistical Analysis
4. Results
5. Discussion
6. Strength and Limitations
7. Conclusions
Supplementary Materials
Author Contributions
Funding
Institutional Review Board Statement
Informed Consent Statement
Data Availability Statement
Conflicts of Interest
References
- Kuklina, E.V.; Ayala, C.; Callaghan, W.M. Hypertensive disorders and severe obstetric morbidity in the United States. Obstet. Gynecol. 2009, 113, 1299–1306. [Google Scholar] [CrossRef]
- Duley, L.; Meher, S.; Hunter, K.E.; Seidler, A.L.; Askie, L.M. Antiplatelet agents for preventing pre-eclampsia and its complications. Cochrane Database Syst. Rev. 2019, 2019, CD004659. [Google Scholar] [CrossRef] [PubMed]
- Hypertension in Pregnancy: Diagnosis and Management NICE Guideline. 2019. Available online: www.nice.org.uk/guidance/ng133 (accessed on 17 July 2023).
- Low-Dose Aspirin Use for the Prevention of Preeclampsia and Related Morbidity and Mortality. ACOG. Available online: https://www.acog.org/clinical/clinical-guidance/practice-advisory/articles/2021/12/low-dose-aspirin-use-for-the-prevention-of-preeclampsia-and-related-morbidity-and-mortality (accessed on 17 July 2023).
- Tan, M.Y.; Syngelaki, A.; Poon, L.C.; Rolnik, D.L.; O’Gorman, N.; Delgado, J.L.; Akolekar, R.; Konstantinidou, L.; Tsavdaridou, M.; Galeva, S.; et al. Screening for pre-eclampsia by maternal factors and biomarkers at 11–13 weeks’ gestation. Ultrasound Obstet. Gynecol. 2018, 52, 186–195. [Google Scholar] [CrossRef] [PubMed]
- O’Gorman, N.; Wright, D.; Syngelaki, A.; Akolekar, R.; Wright, A.; Poon, L.C.; Nicolaides, K.H. Competing risks model in screening for preeclampsia by maternal factors and biomarkers at 11–13 weeks gestation. Am. J. Obstet. Gynecol. 2016, 214, 103.e1–103.e12. [Google Scholar] [CrossRef] [PubMed]
- O’Gorman, N.N.; Wright, D.; Poon, L.C.; Rolnik, D.L.; Syngelaki, A.; Wright, A.; Akolekar, R.; Cicero, S.; Janga, D.; Jani, J.; et al. Accuracy of competing-risks model in screening for pre-eclampsia by maternal factors and biomarkers at 11–13 weeks’ gestation. Ultrasound Obstet. Gynecol. 2017, 49, 751–755. [Google Scholar] [CrossRef]
- Akolekar, R.; Syngelaki, A.; Poon, L.; Wright, D.; Nicolaides, K.H. Competing Risks Model in Early Screening for Preeclampsia by Biophysical and Biochemical Markers. Fetal Diagn. Ther. 2013, 33, 8–15. [Google Scholar] [CrossRef] [PubMed]
- Poon, L.C.Y.; Akolekar, R.; Lachmann, R.; Beta, J.; Nicolaides, K.H. Hypertensive disorders in pregnancy: Screening by biophysical and biochemical markers at 11–13 weeks. Ultrasound Obstet. Gynecol. 2010, 35, 662–670. [Google Scholar] [CrossRef]
- Poon, L.C.; Syngelaki, A.; Akolekar, R.; Lai, J.; Nicolaides, K.H. Combined Screening for Preeclampsia and Small for Gestational Age at 11–13 Weeks. Fetal Diagn. Ther. 2012, 33, 16–27. [Google Scholar] [CrossRef]
- Karagiannis, G.; Akolekar, R.; Sarquis, R.; Wright, D.; Nicolaides, K.H. Prediction of Small-for-Gestation Neonates from Biophysical and Biochemical Markers at 11–13 Weeks. Fetal Diagn. Ther. 2010, 29, 148–154. [Google Scholar] [CrossRef]
- Rolnik, D.L.; Wright, D.; Poon, L.C.; O’Gorman, N.; Syngelaki, A.; de Paco Matallana, C.; Akolekar, R.; Cicero, S.; Janga, D.; Singh, M.; et al. Aspirin versus Placebo in Pregnancies at High Risk for Preterm Preeclampsia. N. Engl. J. Med. 2017, 377, 613–622. [Google Scholar] [CrossRef]
- Poon, L.C.; Wright, D.; Rolnik, D.L.; Syngelaki, A.; Delgado, J.L.; Tsokaki, T.; Leipold, G.; Akolekar, R.; Shearing, S.; De Stefani, L.; et al. Aspirin for Evidence-Based Preeclampsia Prevention trial: Effect of aspirin in prevention of preterm preeclampsia in subgroups of women according to their characteristics and medical and obstetrical history. Am. J. Obstet. Gynecol. 2017, 217, 585.e1–585.e5. [Google Scholar] [CrossRef]
- Tan, M.Y.; Poon, L.C.; Rolnik, D.L.; Syngelaki, A.; de Paco Matallana, C.; Akolekar, R.; Cicero, S.; Janga, D.; Singh, M.; Molina, F.S.; et al. Prediction and prevention of small-for-gestational-age neonates: Evidence from SPREE and ASPRE. Ultrasound Obstet. Gynecol. 2018, 52, 52–59. [Google Scholar] [CrossRef]
- Poon, L.C.; Shennan, A.; Hyett, J.A.; Kapur, A.; Hadar, E.; Divakar, H.; McAuliffe, F.; da Silva Costa, F.; von Dadelszen, P.; McIntyre, H.D.; et al. The International Federation of Gynecology and Obstetrics (FIGO) initiative on pre-eclampsia: A pragmatic guide for first-trimester screening and prevention. Int. J. Gynaecol. Obstet. Off. Organ Int. Fed. Gynaecol. Obstet. 2019, 145 (Suppl. S1), 1–33. [Google Scholar] [CrossRef] [PubMed]
- Brown, M.A.; Magee, L.A.; Kenny, L.C.; Karumanchi, S.A.; McCarthy, F.P.; Saito, S.; Hall, D.R.; Warren, C.E.; Adoyi, G.; Ishaku, S.; et al. Hypertensive Disorders of Pregnancy: ISSHP Classification, Diagnosis, and Management Recommendations for International Practice. Hypertension 2018, 72, 24–43. [Google Scholar] [CrossRef] [PubMed]
- Gordijn, S.J.; Beune, I.M.; Thilaganathan, B.; Papageorghiou, A.; Baschat, A.A.; Baker, P.N.; Silver, R.M.; Wynia, K.; Ganzevoort, W. Consensus definition of fetal growth restriction: A Delphi procedure. Ultrasound Obstet. Gynecol. 2016, 48, 333–339. [Google Scholar] [CrossRef]
- Wright, D.; Poon, L.C.; Rolnik, D.L.; Syngelaki, A.; Delgado, J.L.; Vojtassakova, D.; de Alvarado, M.; Kapeti, E.; Rehal, A.; Pazos, A.; et al. Aspirin for Evidence-Based Preeclampsia Prevention trial: Influence of compliance on beneficial effect of aspirin in prevention of preterm preeclampsia. Am. J. Obstet. Gynecol. 2017, 217, 685.e1–685.e5. [Google Scholar] [CrossRef] [PubMed]
- Phipps, E.A.; Thadhani, R.; Benzing, T.; Karumanchi, S.A. Pre-eclampsia: Pathogenesis, novel diagnostics and therapies. Nat. Rev. Nephrol. 2019, 15, 275–289. [Google Scholar] [CrossRef]
- Brosens, I.; Puttemans, P.; Benagiano, G. Placental bed research: I. The placental bed: From spiral arteries remodeling to the great obstetrical syndromes. Am. J. Obstet. Gynecol. 2019, 221, 437–456. [Google Scholar] [CrossRef]
- Aouache, R.; Biquard, L.; Vaiman, D.; Miralles, F. Oxidative Stress in Preeclampsia and Placental Diseases. Int. J. Mol. Sci. 2018, 19, 1496. [Google Scholar] [CrossRef]
- Roberge, S.; Villa, P.; Nicolaides, K.; Giguère, Y.; Vainio, M.; Bakthi, A.; Ebrashy, A.; Bujold, E. Early administration of low-dose aspirin for the pre-vention of preterm and term preeclampsia: A systematic review and meta-analysis. Fetal. Diagn. Ther. 2012, 31, 141–146. [Google Scholar] [CrossRef] [PubMed]
- Roberge, S.; Nicolaides, K.; Demers, S.; Hyett, J.; Chaillet, N.; Bujold, E. The role of aspirin dose on the prevention of preeclampsia and fetal growth restriction: Systematic review and meta-analysis. Am. J. Obstet. Gynecol. 2017, 216, 110–120.e6. [Google Scholar] [CrossRef]
- Battarbee, A.N.; Sinkey, R.G.; Harper, L.M.; Oparil, S.; Tita, A.T.N. Chronic hypertension in pregnancy. Am. J. Obstet. Gynecol. 2020, 222, 532–541. [Google Scholar] [CrossRef] [PubMed]
- Zwertbroek, E.F.; Groen, H.; Fontanella, F.; Maggio, L.; Marchi, L.; Bilardo, C.M. Performance of the FMF First-Trimester Preeclampsia-Screening Algorithm in a High-Risk Population in The Netherlands. Fetal Diagn. Ther. 2021, 48, 103–111. [Google Scholar] [CrossRef]
- Boutin, A.; Guerby, P.; Gasse, C.; Tapp, S.; Bujold, E. Pregnancy outcomes in nulliparous women with positive first-trimester preterm preeclampsia screening test: The Great Obstetrical Syndromes cohort study. Am. J. Obstet. Gynecol. 2020, 224, 204.e1–204.e7. [Google Scholar] [CrossRef]
- Lobo, G.A.R.; Nowak, P.M.; Panigassi, A.P.; Lima, A.I.F.; Araujo Júnior, E.; Nardozza, L.M.M.; Pares, D.B.S. Validation of Fetal Medicine Foun-dation algorithm for prediction of pre-eclampsia in the first trimester in an unselected Brazilian population. J. Matern.-Fetal Neonatal Med. 2019, 32, 286–292. [Google Scholar] [CrossRef]
- Cordisco, A.; Periti, E.; Antoniolli, N.; Lozza, V.; Conticini, S.; Vannucci, G.; Masini, G.; Pasquini, L. Clinical implementation of pre-eclampsia screening in the first trimester of pregnancy. Pregnancy Hypertens. 2021, 25, 34–38. [Google Scholar] [CrossRef] [PubMed]
- Tousty, P.; Fraszczyk-Tousty, M.; Dzidek, S.; Jasiak-Jóźwik, H.; Michalczyk, K.; Kwiatkowska, E.; Cymbaluk-Płoska, A.; Torbé, A.; Kwiatkowski, S. Low-Dose Aspirin after ASPRE—More Questions Than Answers? Current International Approach after PE Screening in the First Trimester. Biomedicines 2023, 11, 1495. [Google Scholar] [CrossRef] [PubMed]
- O’Gorman, N.; Wright, D.; Poon, L.C.; Rolnik, D.L.; Syngelaki, A.; De Alvarado, M.; Carbone, I.F.; Dutemeyer, V.; Fiolna, M.; Frick, A.; et al. Multicenter screening for pre-eclampsia by maternal factors and biomarkers at 11–13 weeks’ gestation: Comparison with NICE guidelines and ACOG recommendations. Ultrasound Obstet. Gynecol. 2017, 49, 756–760. [Google Scholar] [CrossRef]
- Tan, M.Y.; Wright, D.; Syngelaki, A.; Akolekar, R.; Cicero, S.; Janga, D.; Singh, M.; Greco, E.; Wright, A.; Maclagan, K.; et al. Comparison of diagnostic accuracy of early screening for pre-eclampsia by NICE guidelines and a method combining maternal factors and biomarkers: Results of SPREE. Ultrasound Obstet. Gynecol. 2018, 51, 743–750. [Google Scholar] [CrossRef]
- Green, M.; Shennan, A. Aspirin should be targeted to those who need it. BJOG Int. J. Obstet. Gynaecology. 2021, 128, 157. [Google Scholar] [CrossRef]
- Mosimann, B.; Pfiffner, C.; Amylidi-Mohr, S.; Risch, L.; Surbek, D.; Raio, L. First trimester combined screening for preeclampsia and small for gestational age—A single centre experience and validation of the FMF screening algorithm. Swiss. Med. Wkly. 2017, 147, w14498. [Google Scholar] [CrossRef] [PubMed]
- Bujold, E.; Roberge, S.; Lacasse, Y.; Bureau, M.; Audibert, F.; Marcoux, S.; Forest, J.-C.; Giguère, Y. Prevention of preeclampsia and intrauterine growth restriction with aspirin started in early pregnancy: A meta-analysis. Obstet. Gynecol. 2010, 116, 402–414. [Google Scholar] [CrossRef] [PubMed]


| Early FGR: GA < 32 weeks, in the absence of congenital anomalies | Late FGR: GA ≥ 32 weeks, in the absence of congenital anomalies |
| AC/EFW < 3rd centile or UA-AEDF | AC/EFW < 3rd centile |
| Or | Or at least two out of three of the following: |
|
|
| Feature | n (%) |
|---|---|
| Maternal age and weight | |
| Age > 35 yo | 311 (35.6%) |
| Age > 40 yo | 48 (5.5%) |
| BMI | |
| Underweight (<18.5) | 31 (3.5%) |
| Normal weight (18.5–24.9) | 550 (62.9%) |
| Overweight (≥25) | 199 (22.8%) |
| Obesity (≥30) | 93 (10.6%) |
| Comorbidities and addictions | |
| SLE | 6 (0.7%) |
| APS | 9 (1%) |
| Diabetes mellitus type 1 | 4 (0.5%) |
| Smoking | 39 (4.5%) |
| Obstetrical history | |
| Parous previous PE | 11 (1.3%) |
| Previous FGR or SGA fetuses | 16 (1.8%) |
| Family history of PE | 5 (0.6%) |
| Nulliparous | 390 (44.6%) |
| IVF | 12 (1.4%) |
| High Risk for PE n (%) | Low Risk for PE n (%) | p | OR (95%CI) | High Risk for FGR n (%) | Low Risk for FGR n (%) | p | OR (95%CI) | |
|---|---|---|---|---|---|---|---|---|
| n = 35 | n = 839 | - | n = 74 | n = 800 | ||||
| Maternal characteristics, comorbidities and obstetric history | ||||||||
| Age > 35 | 12 (34.3%) | 299 (35.7%) | 0.87 | - | 31 (41.9%) | 280 (35%) | 0.24 | - |
| Age > 40 | 1 (2.9%) | 47 (5.6%) | 0.48 | - | 3 (4.1%) | 45 (5.6%) | 0.76 | - |
| Underweight (BMI < 18.5) | 1 (2.9%) | 30 (3.6%) | 0.81 | - | 3 (4.1%) | 28 (3.5%) | 0.93 | - |
| Normal weight (BMI 18.5–24.9) | 21 (60%) | 529 (63.1%) | 0.71 | - | 51 (68.9%) | 499 (62.5%) | 0.27 | - |
| Overweight (BMI ≥ 25) | 6 (17.1%) | 193 (23%) | 0.42 | - | 10 (13.5%) | 189 (23.7%) | 0.08 | - |
| Obesity (BMI ≥ 30) | 7 (20%) | 86 (10.3%) | 0.07 | - | 10 (13.5%) | 83 (10.4%) | 0.41 | - |
| Nulliparous | 23 (65.7%) | 367 (43.7%) | 0.01 | 2.4 (1.2–5) | 45 (60.8%) | 345 (43.1%) | 0.003 | 2 (1.3–3.3) |
| Smoking | 0 | 39 (5.5%) | 0.31 | - | 11 (16.2%) | 28 (4.2%) | <0.001 | 4.4 (2.1–9.3) |
| PGDM | 1 (2.9%) | 3 (0.4%) | 0.39 | - | 1 (1.4%) | 3 (0.4%) | 0.77 | - |
| Maternal and perinatal outcome | ||||||||
| GDM1 | 9 (25.7%) | 106 (12.6%) | 0.03 | - | 19 (25.7%) | 96 (12%) | <0.001 | 3.1 (1.8–5.2) |
| GDM2 | 2 (5.7%) | 93 (11.1%) | 0.47 | - | 7 (9.5%) | 88 (11%) | 0.68 | - |
| PIH | 7 (20%) | 52 (6.2%) | 0.001 | 3.8 (1.6–9.1) | 15 (20.3%) | 44 (5.5%) | <0.001 | 4.4 (2.3–8.3) |
| All PE | 4 (11.4%) | 15 (1.8%) | <0.001 | 7.1 (2.2–22.6) | 8 (10.8%) | 11 (1.4%) | <0.001 | 8.7 (3.4–22.4) |
| eo-PE | 0 | 1 (0.12%) | - | - | 0 | 1 (0.13%) | - | - |
| lo-PE | 4 (11.4%) | 14 (1.7%) | <0.001 | 7.6 (2.4–24.4) | 8 (10.8%) | 10 (1.3%) | <0.001 | 9.6 (3.7–25.1) |
| Cesarean delivery | 25 (71.4%) | 458 (54.8%) | 0.05 | 2.1 (0.98–4.4) | 50 (67.6%) | 433 (54.3%) | 0.03 | 1.8 (1.1–2.9) |
| Preterm birth | 2 (5.7%) | 62 (7.4%) | 0.71 | - | 6 (8.1%) | 58 (7.3%) | 0.79 | - |
| Newborn outcome | ||||||||
| FGR or SGA | 6 (17.1%) | 45 (5.4%) | 0.003 | 3.7 (1.4–9.2) | 15 (20.3%) | 36 (4.5%) | <0.001 | 5.4 (2.8–10.4) |
| Stillbirth | 0 | 3 (0.4%) | 0.26 | - | 1 (1.4%) | 2 (0.25%) | 0.61 | - |
| Newborn sex (male) | 20 (57.1%) | 454 (54.1%) | 0.72 | - | 42 (56.8%) | 432 (54%) | 0.65 | - |
| Apgar score < 7 at 5 min | 1 (2.9%) | 15 (1.9%) | 0.82 | - | 2 (2.7%) | 15 (1.9%) | 0.96 | - |
| Birth weight < 10 pc | 3 (8.6%) | 29 (3.5%) | 0.26 | - | 7 (9.5%) | 25 (3.1%) | 0.005 | 3.2 (1.3–7.7) |
| Birth weight < 3 pc | 1 (2.9%) | 7 (0.8%) | 0.75 | - | 4 (5.4%) | 4 (0.5%) | <0.001 | 11.3 (2.8–46.3) |
| PE Diagnosis n (%) | without PE Diagnosis n (%) | p | OR (95%CI) | FGR or SGA Diagnosis n (%) | without FGR or SGA Diagnosis n (%) | p | OR (95%CI) | |
|---|---|---|---|---|---|---|---|---|
| n= 19 | n= 855 | n= 51 | n= 823 | |||||
| Maternal characteristics, comorbidities and obstetric history | ||||||||
| Age > 35 | 7 (36.8%) | 304 (35.6%) | 0.91 | - | 17 (33.3%) | 304 (37%) | 0.75 | - |
| Age > 40 | 2 (10.5%) | 46 (5.4%) | 0.33 | - | 1 (2%) | 47 (5.7%) | 0.25 | - |
| Underweight (BMI < 18.5) | 1 (5.3%) | 30 (3.5%) | 0.82 | - | 5 (9.8%) | 26 (3.2%) | 0.04 | 3.3 (1.2–9.1) |
| Normal weight (BMI 18.5–24.9) | 13 (68.4%) | 537 (62.9%) | 0.61 | - | 35 (68.6%) | 515 (62.6%) | 0.4 | |
| Overweight (BMI ≥ 25) | 2 (10.5%) | 197 (23.1%) | 0.31 | - | 9 (17.7%) | 190 (23.1%) | 0.32 | |
| Obesity (BMI ≥ 30) | 3 (15.8%) | 90 (10.5%) | 0.72 | - | 2 (3.9%) | 92 (11.2%) | 0.14 | |
| Nulliparous | 12 (63.2%) | 378 (44.2%) | 0.1 | - | 35 (68.6%) | 355 (43.1%) | <0.001 | 2.9 (1.6–5.3) |
| Smoking | 0 | 39 (5.4%) | 0.66 | - | 4 (8%) | 35 (5.1%) | 0.58 | - |
| PGDM | 0 | 4 (0.5%) | 0.16 | - | 0 | 4 | - | - |
| Maternal and perinatal outcome | ||||||||
| GDM1 | 2 (10.5%) | 113 (13.2%) | 0.73 | - | 9 (17.7%) | 106 (12.9%) | 0.43 | - |
| GDM2 | 0 | 95 (11.1%) | 0.24 | - | 3 (5.9%) | 92 (11.2%) | 0.28 | - |
| PIH | - | - | - | - | 7 (13.7%) | 50 (6.1%) | 0.06 | - |
| All PE | - | - | - | - | 6 (11.8%) | 13 (1.6%) | <0.001 | 8.3 (3–22.9) |
| eo-PE | - | - | - | - | 0 | 1 (0.1%) | - | - |
| lo-PE | - | - | - | - | 6 (11.8%) | 12 (1.5%) | <0.001 | 9 (3.2–25.1) |
| Cesarean delivery | 15 (79%) | 469 (55%) | 0.04 | 3.1 (1.01–9.3) | 30 (58.8%) | 453 (55.2%) | 0.62 | - |
| Preterm birth | 3 (15.8%) | 61 (7.1%) | 0.15 | - | 8 (15.7%) | 56 (6.8%) | 0.04 | 2.5 (1.1–5.7) |
| Newborn outcome | ||||||||
| FGR or SGA | 6 (31.6%) | 45 (5.3%) | <0.001 | 8.3 (3–22.9) | - | - | - | - |
| Stillbirth | 0 | 3 (0.4%) | 0.8 | - | 2 (3.9%) | 1 (0.1%) | - | - |
| Newborn sex (male) | 6 (31.6%) | 468 (54.7%) | 0.05 | 2.6 (0.98–7) | 23 (45.1%) | 451 (54.8%) | 0.18 | - |
| Apgar score <7 at 5 min | 0 | 17 (2%) | 0.82 | - | 2 (3.9%) | 15 (1.8%) | 0.6 | - |
| Birth weight < 10 pc | 2 (10.5%) | 30 (3.5%) | 0.11 | - | 21 (41.2%) | 11 (1.3%) | <0.001 | 51.4 (22.8–116) |
| Birth weight < 3 pc | 2 (10.5%) | 6 (0.7%) | <0.001 | 16.6 (3.1–88.3) | 4 (7.8%) | 4 (0.5%) | <0.001 | 17.4 (4.2–71.7) |
| First trimester biochemical or biophysical measurement | ||||||||
| Median (min-max) | Median (min-max) | p | OR (95%CI) | Median (min-max) | Median (min-max) | p | OR (95%CI) | |
| MoM UtPI | 1.26 (0.6–1.8) | 0.98 (0.4–2.3) | <0.001 | 8.5 (2.4–30.5) | 1.06 (0.7–1.7) | 0.98 (0.4–2.3) | 0.03 | 2.6 (1.1–6.4) |
| UtPI | 2.1 (0.9–2.86) | 1.5 (0.6–3.8) | 0.002 | 3.5 (1.6–7.8) | 1.8 (1.1–2.6) | 1.5 (0.6–3.8) | 0.01 | 2 (1.2–3.5) |
| MoM PAPP-A | 0.87 (0.2–3.1) | 0.96 (0.2–4.8) | 0.32 | - | 0.79 (0.2–2.8) | 0.96 (0.2–4.8) | 0.12 | - |
| PAPP-A (IU/I) | 2.8 (0.5–12.4) | 3.4 (0.5–21.4) | 0.53 | - | 3.3 (0.5–14) | 3.4 (0.5–21.4) | 0.49 | - |
| MoM PLGF | 0.78 (0.2–1.63) | 0.9 (0.1–3.2) | 0.04 | 0.2 (0.03–0.9) | 0.82 (0.2–1.9) | 0.9 (0.1–3.2) | 0.005 | 0.24 (0.1–0.7) |
| PLGF (ng/mL) | 39.4 (12.6–98) | 50.4 (11–357) | 0.04 | 0.97 (0.94–0.99) | 46 (11–100) | 50.5 (60–357) | 0.01 | 0.98 (0.96–0.99) |
| MoM MAP | 1.12 (0.9–1.4) | 1.03 (0.7–1.4) | <0.001 | 32.4 (14–55.3) | 1.03 (0.8–1.3) | 1.03 (0.7–1.4) | 0.88 | - |
| MAP (mm Hg) | 95 (78.3–113) | 87 (60–123) | <0.001 | 1.09 (1.04–1.14) | 85 (72–112) | 88 (60–123) | 0.27 | - |
| High Risk for PE or/and FGR n (%) | Low Risk for PE and FGR n (%) | p | OR (95%CI) | |
|---|---|---|---|---|
| n = 81 | n = 793 | - | ||
| Maternal characteristics, comorbidities, and obstetrical history | ||||
| Age > 35 | 35 (43.2%) | 276 (34.8) | 0.13 | - |
| Age > 40 | 3 (3.7%) | 45 (5.7%) | 0.45 | - |
| Underweight (BMI < 18.5) | 3 (3.7%) | 28 (3.5%) | 0.93 | - |
| Normal weight (BMI 18.5–24.9) | 53 (65.4%) | 497 (62.8%) | 0.63 | - |
| Overweight (BMI ≥ 25) | 13 (16.1%) | 186 (23.5%) | 0.12 | - |
| Obesity (BMI ≥ 30) | 12 (14.8) | 81 (10.2%) | 0.2 | - |
| Nulliparous | 48 (59.3%) | 342 (43.1%) | <0.01 | 1.9 (1.2–3) |
| Smoking | 11 (14.7%) | 28 (4.2%) | <0.001 | 3.9 (1.9–8.2) |
| PGDM | 1 (1.2%) | 3 (0.4%) | 0.82 | - |
| Maternal and perinatal outcomes | ||||
| GDM1 | 20 (24.7%) | 95 (12%) | <0.01 | 2.4 (1.4–4.2) |
| GDM2 | 7 (8.6%) | 88 (11.1%) | 0.49 | - |
| PIH | 14 (17.3%) | 43 (5.43%) | 0.001 | 3.6 (1.9–7) |
| All PE | 8 (9.9%) | 11 (1.4%) | <0.001 | 7.8 (3–20) |
| eo-PE | 0 | 1 (0.13%) | 0.15 | - |
| lo-PE | 8 (9.8%) | 10 (1.3%) | <0.001 | 8.5 (3.3–22.4) |
| Cesarean delivery | 56 (69.1%) | 427 (54%) | 0.009 | 1.9 (1.2–3.1) |
| Preterm birth | 6 (7.4%) | 58 (7.3%) | 0.97 | - |
| Newborn outcome | ||||
| FGR or SGA | 15 (18.5%) | 36 (4.5%) | <0.001 | 4.8 (2.5–9.2) |
| Stillbirth | 1 (1.2%) | 2 (0.25%) | 0.15 | - |
| Newborn sex (male) | 45 (55.5%) | 429 (54.1%) | 0.8 | - |
| Apgar score < 7 at 5 min | 2 (2.5%) | 15 (1.9%) | 0.71 | - |
| Birth weight < 10 pc | 7 (8.6%) | 25 (3.1%) | 0.01 | 2.9 (1.2–6.9) |
| Birth weight < 3 pc | 4 (4.9%) | 4 (0.5%) | <0.001 | 10.2 (2.5–41.7) |
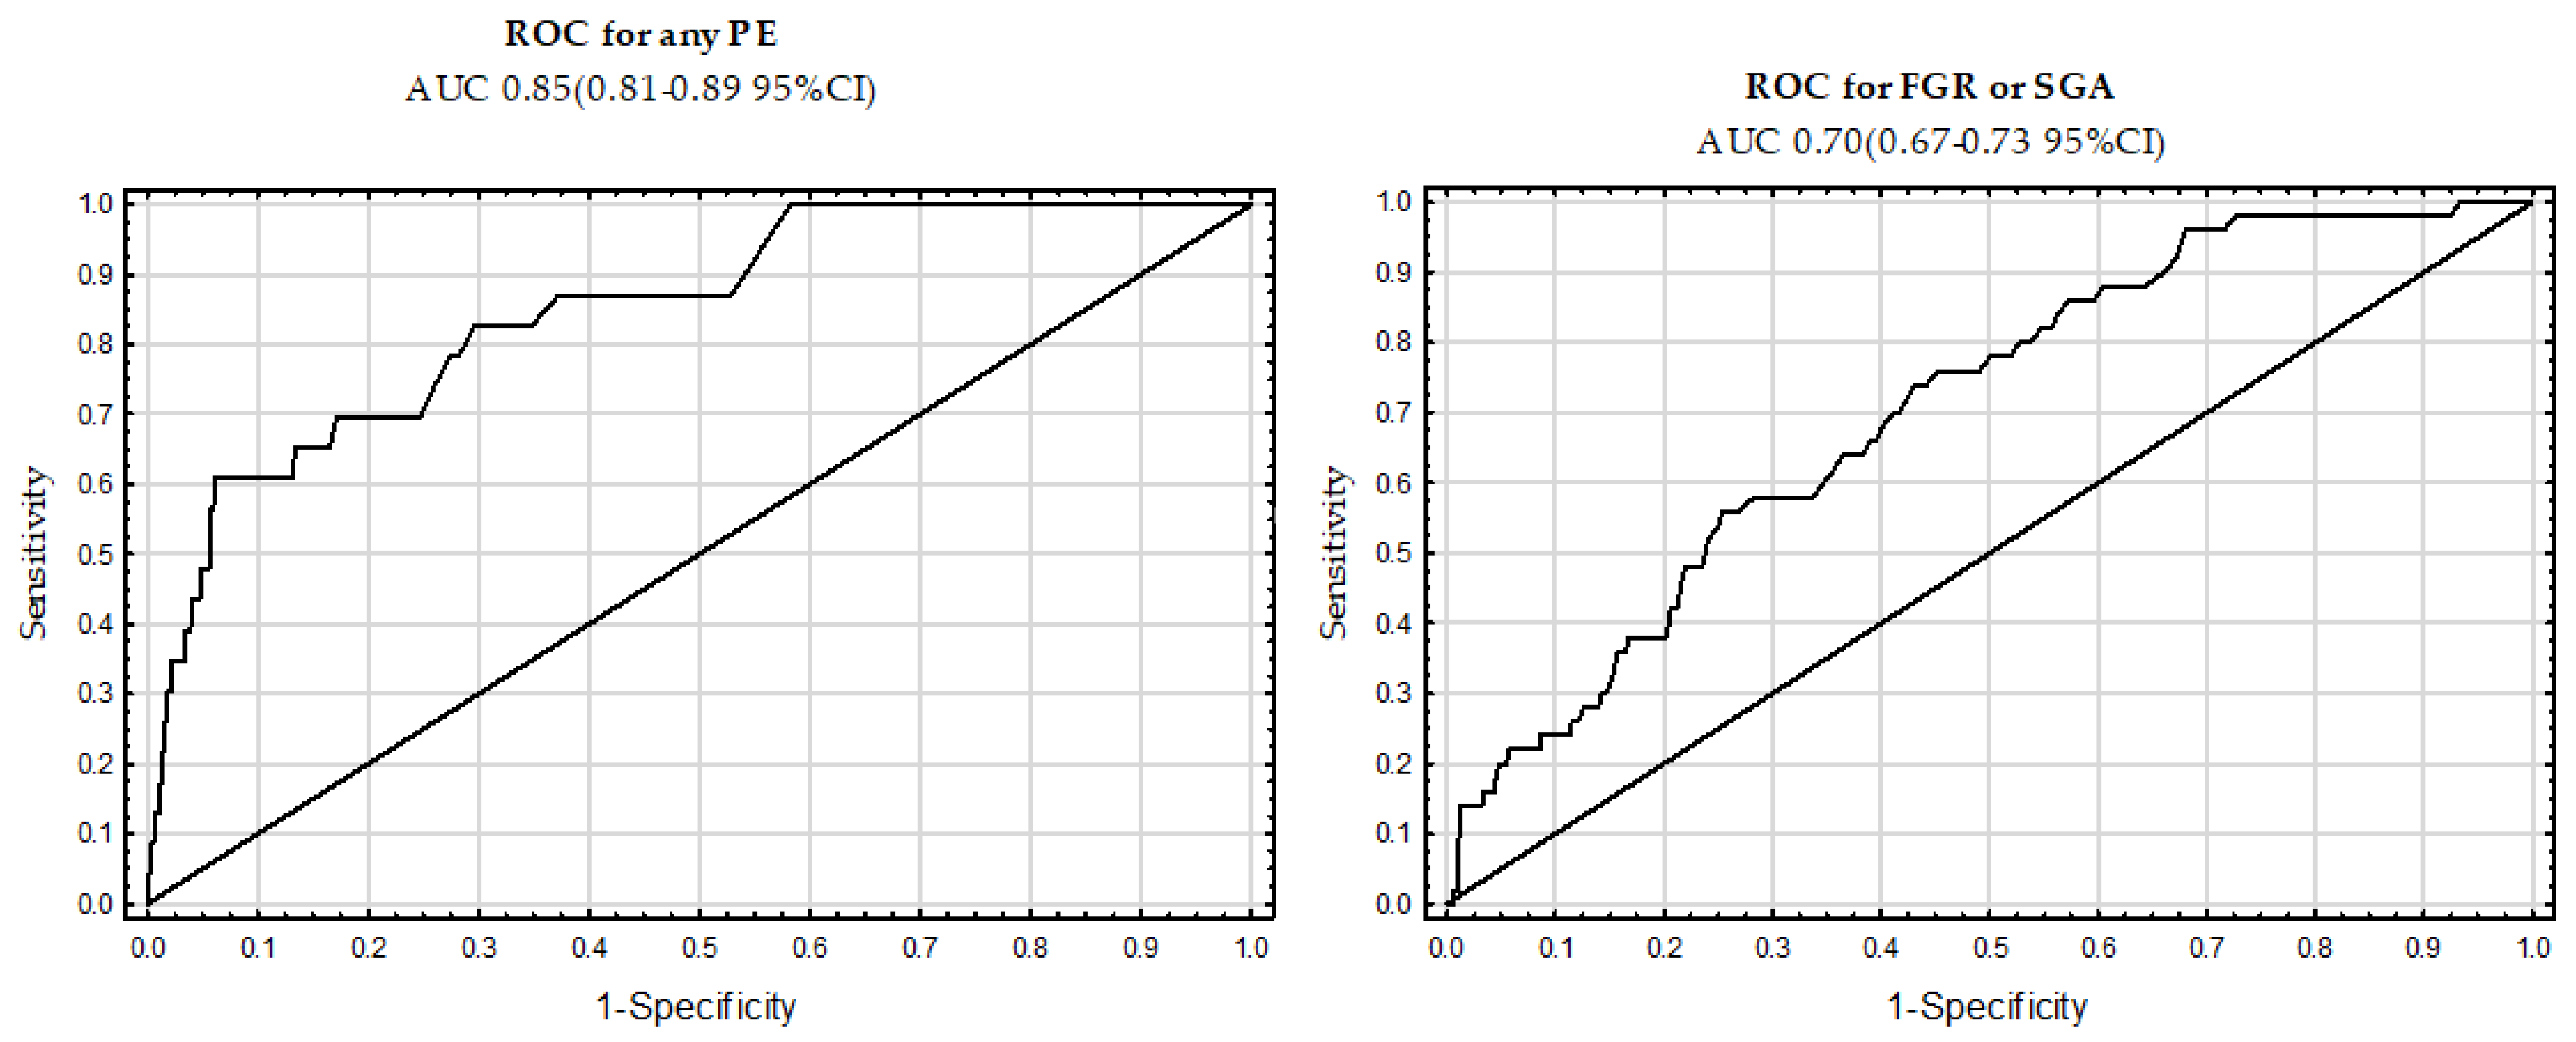
| AUC | CI (95%) | Sensitivity for the FPR | ||
|---|---|---|---|---|
| Variables | 5% | 10% | ||
| Any PE | 0.85 | (0.81–0.89) | 48 | 61 |
| FGR or SGA | 0.71 | (0.67–0.75) | 20 | 24 |
Disclaimer/Publisher’s Note: The statements, opinions and data contained in all publications are solely those of the individual author(s) and contributor(s) and not of MDPI and/or the editor(s). MDPI and/or the editor(s) disclaim responsibility for any injury to people or property resulting from any ideas, methods, instructions or products referred to in the content. |
© 2023 by the authors. Licensee MDPI, Basel, Switzerland. This article is an open access article distributed under the terms and conditions of the Creative Commons Attribution (CC BY) license (https://creativecommons.org/licenses/by/4.0/).
Share and Cite
Tousty, P.; Fraszczyk-Tousty, M.; Golara, A.; Zahorowska, A.; Sławiński, M.; Dzidek, S.; Jasiak-Jóźwik, H.; Nawceniak-Balczerska, M.; Kordek, A.; Kwiatkowska, E.; et al. Screening for Preeclampsia and Fetal Growth Restriction in the First Trimester in Women without Chronic Hypertension. J. Clin. Med. 2023, 12, 5582. https://doi.org/10.3390/jcm12175582
Tousty P, Fraszczyk-Tousty M, Golara A, Zahorowska A, Sławiński M, Dzidek S, Jasiak-Jóźwik H, Nawceniak-Balczerska M, Kordek A, Kwiatkowska E, et al. Screening for Preeclampsia and Fetal Growth Restriction in the First Trimester in Women without Chronic Hypertension. Journal of Clinical Medicine. 2023; 12(17):5582. https://doi.org/10.3390/jcm12175582
Chicago/Turabian StyleTousty, Piotr, Magda Fraszczyk-Tousty, Anna Golara, Adrianna Zahorowska, Michał Sławiński, Sylwia Dzidek, Hanna Jasiak-Jóźwik, Magda Nawceniak-Balczerska, Agnieszka Kordek, Ewa Kwiatkowska, and et al. 2023. "Screening for Preeclampsia and Fetal Growth Restriction in the First Trimester in Women without Chronic Hypertension" Journal of Clinical Medicine 12, no. 17: 5582. https://doi.org/10.3390/jcm12175582
APA StyleTousty, P., Fraszczyk-Tousty, M., Golara, A., Zahorowska, A., Sławiński, M., Dzidek, S., Jasiak-Jóźwik, H., Nawceniak-Balczerska, M., Kordek, A., Kwiatkowska, E., Cymbaluk-Płoska, A., Torbé, A., & Kwiatkowski, S. (2023). Screening for Preeclampsia and Fetal Growth Restriction in the First Trimester in Women without Chronic Hypertension. Journal of Clinical Medicine, 12(17), 5582. https://doi.org/10.3390/jcm12175582