
Lactate to Albumin Ratio for Predicting Clinical Outcomes after In-Hospital Cardiac Arrest
 , , , ,
Abstract
1. Introduction
2. Materials and Methods
2.1. Study Design
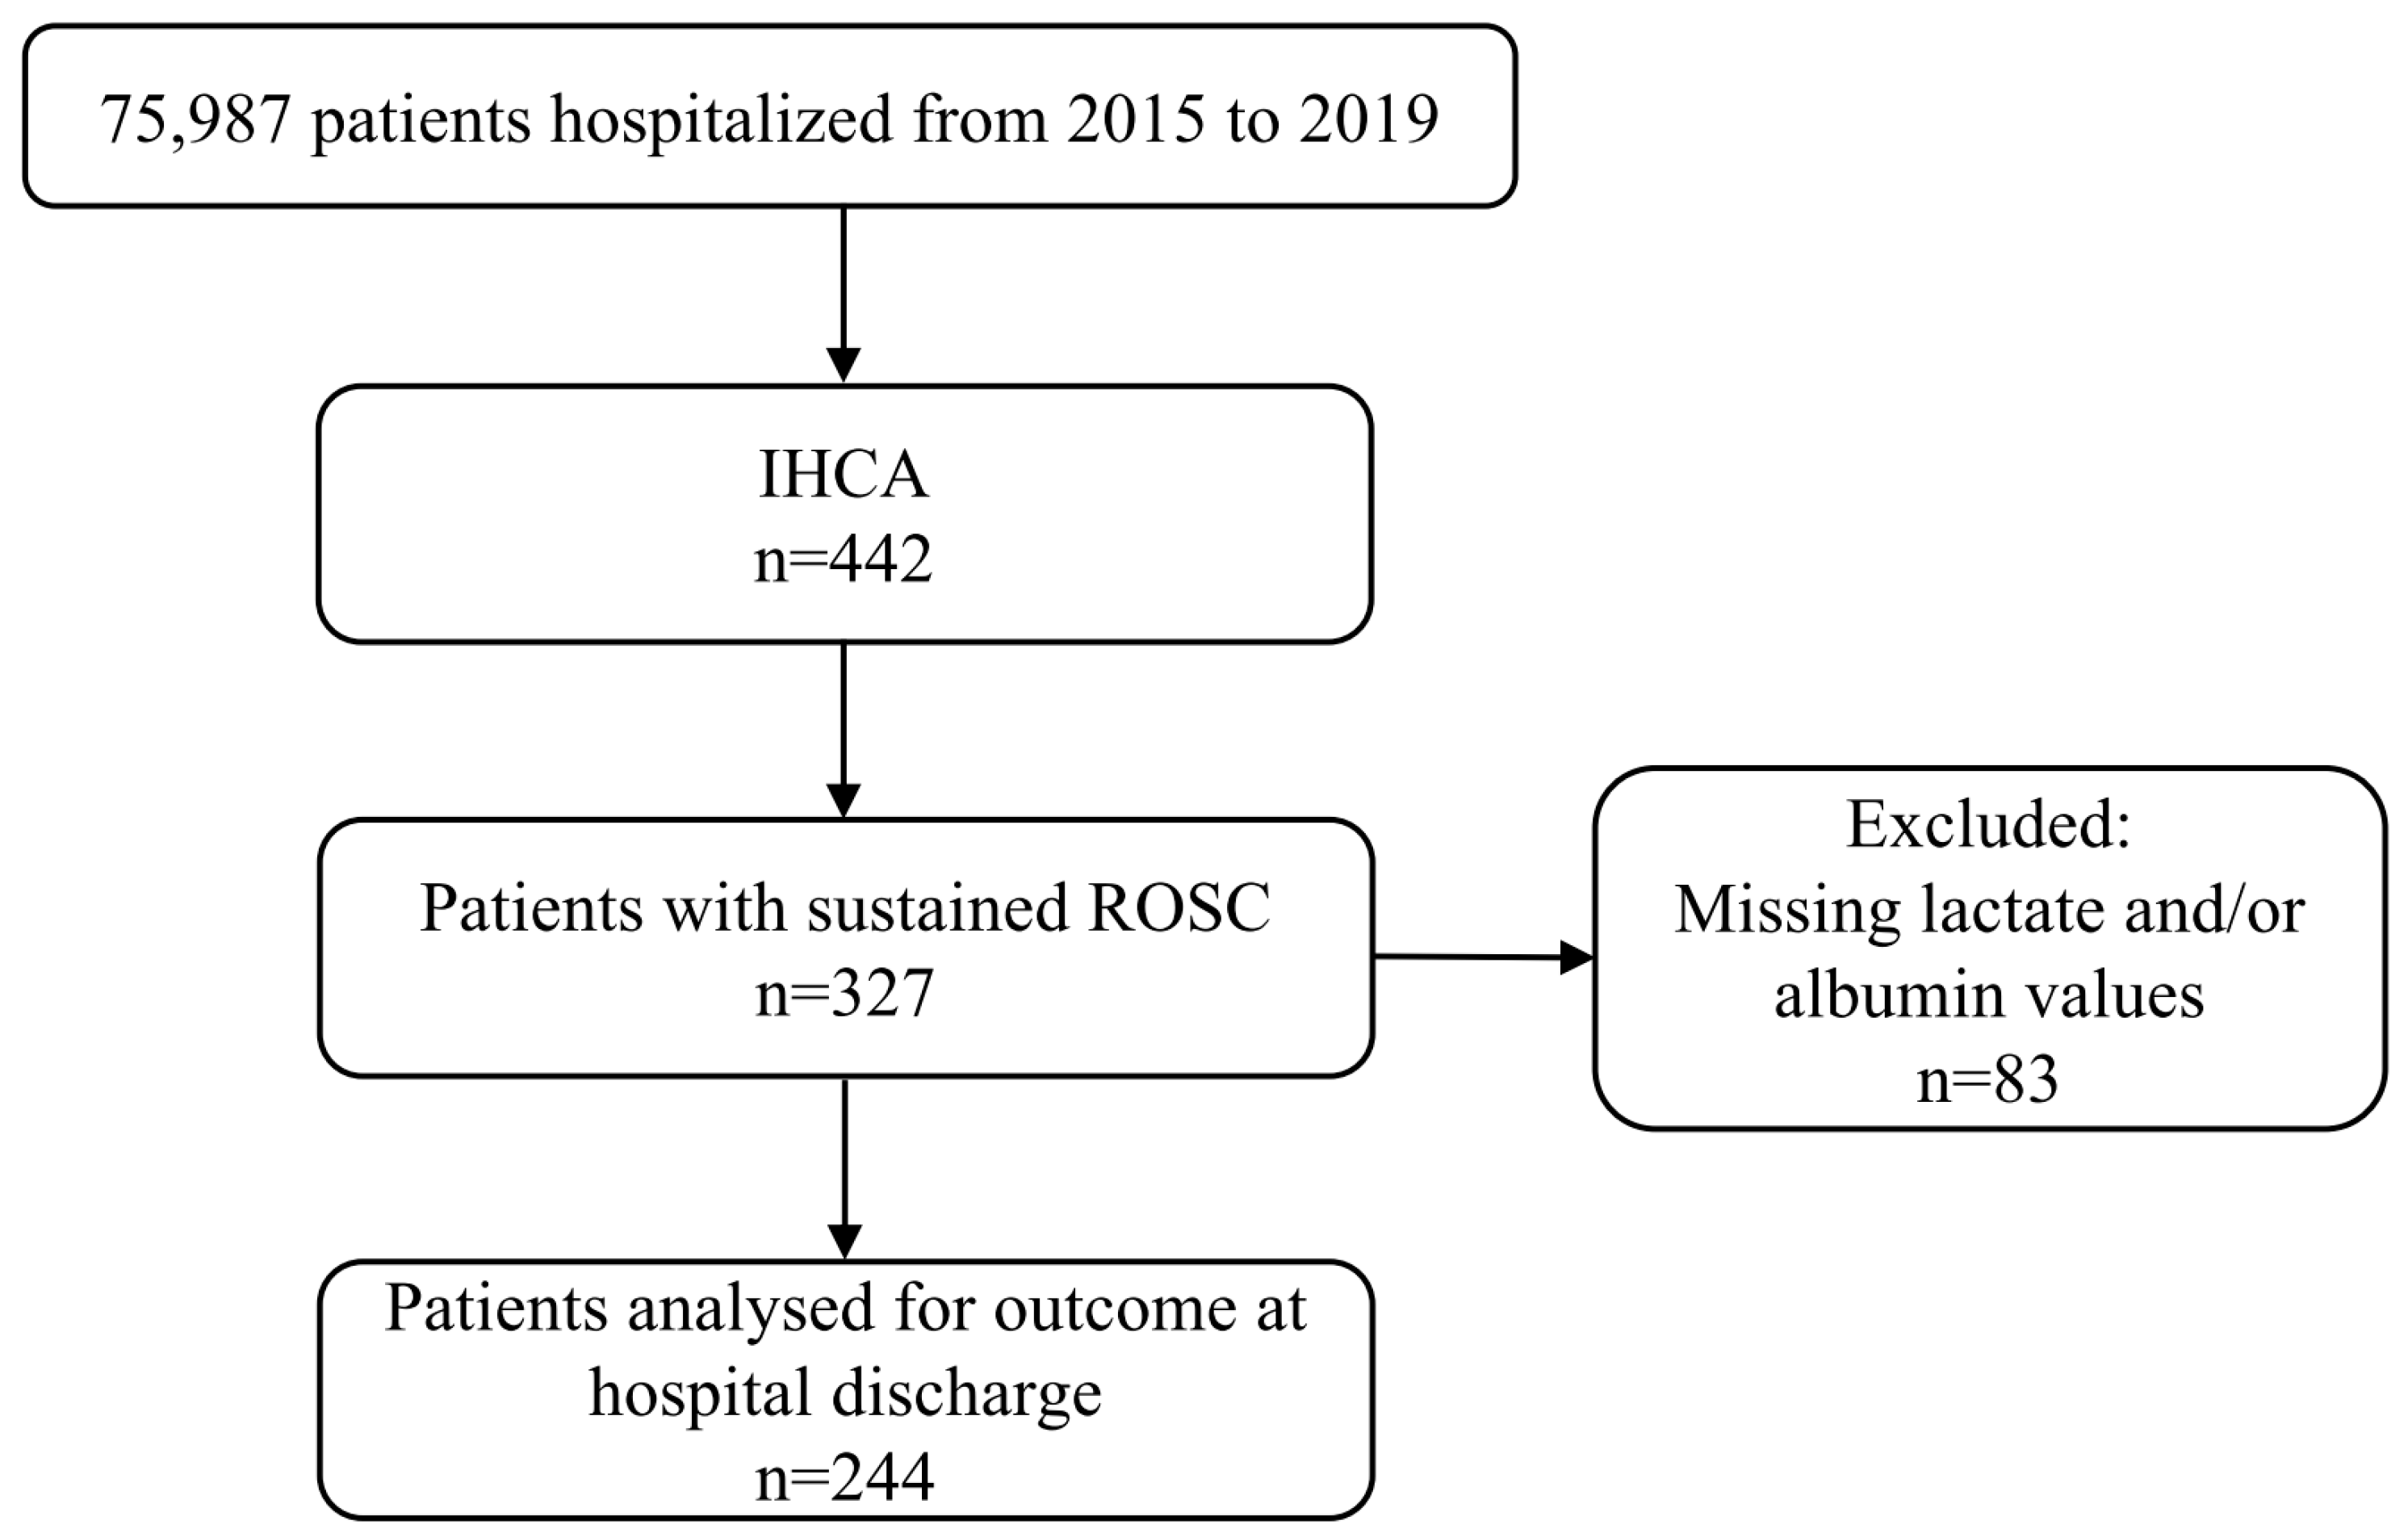
2.2. Population
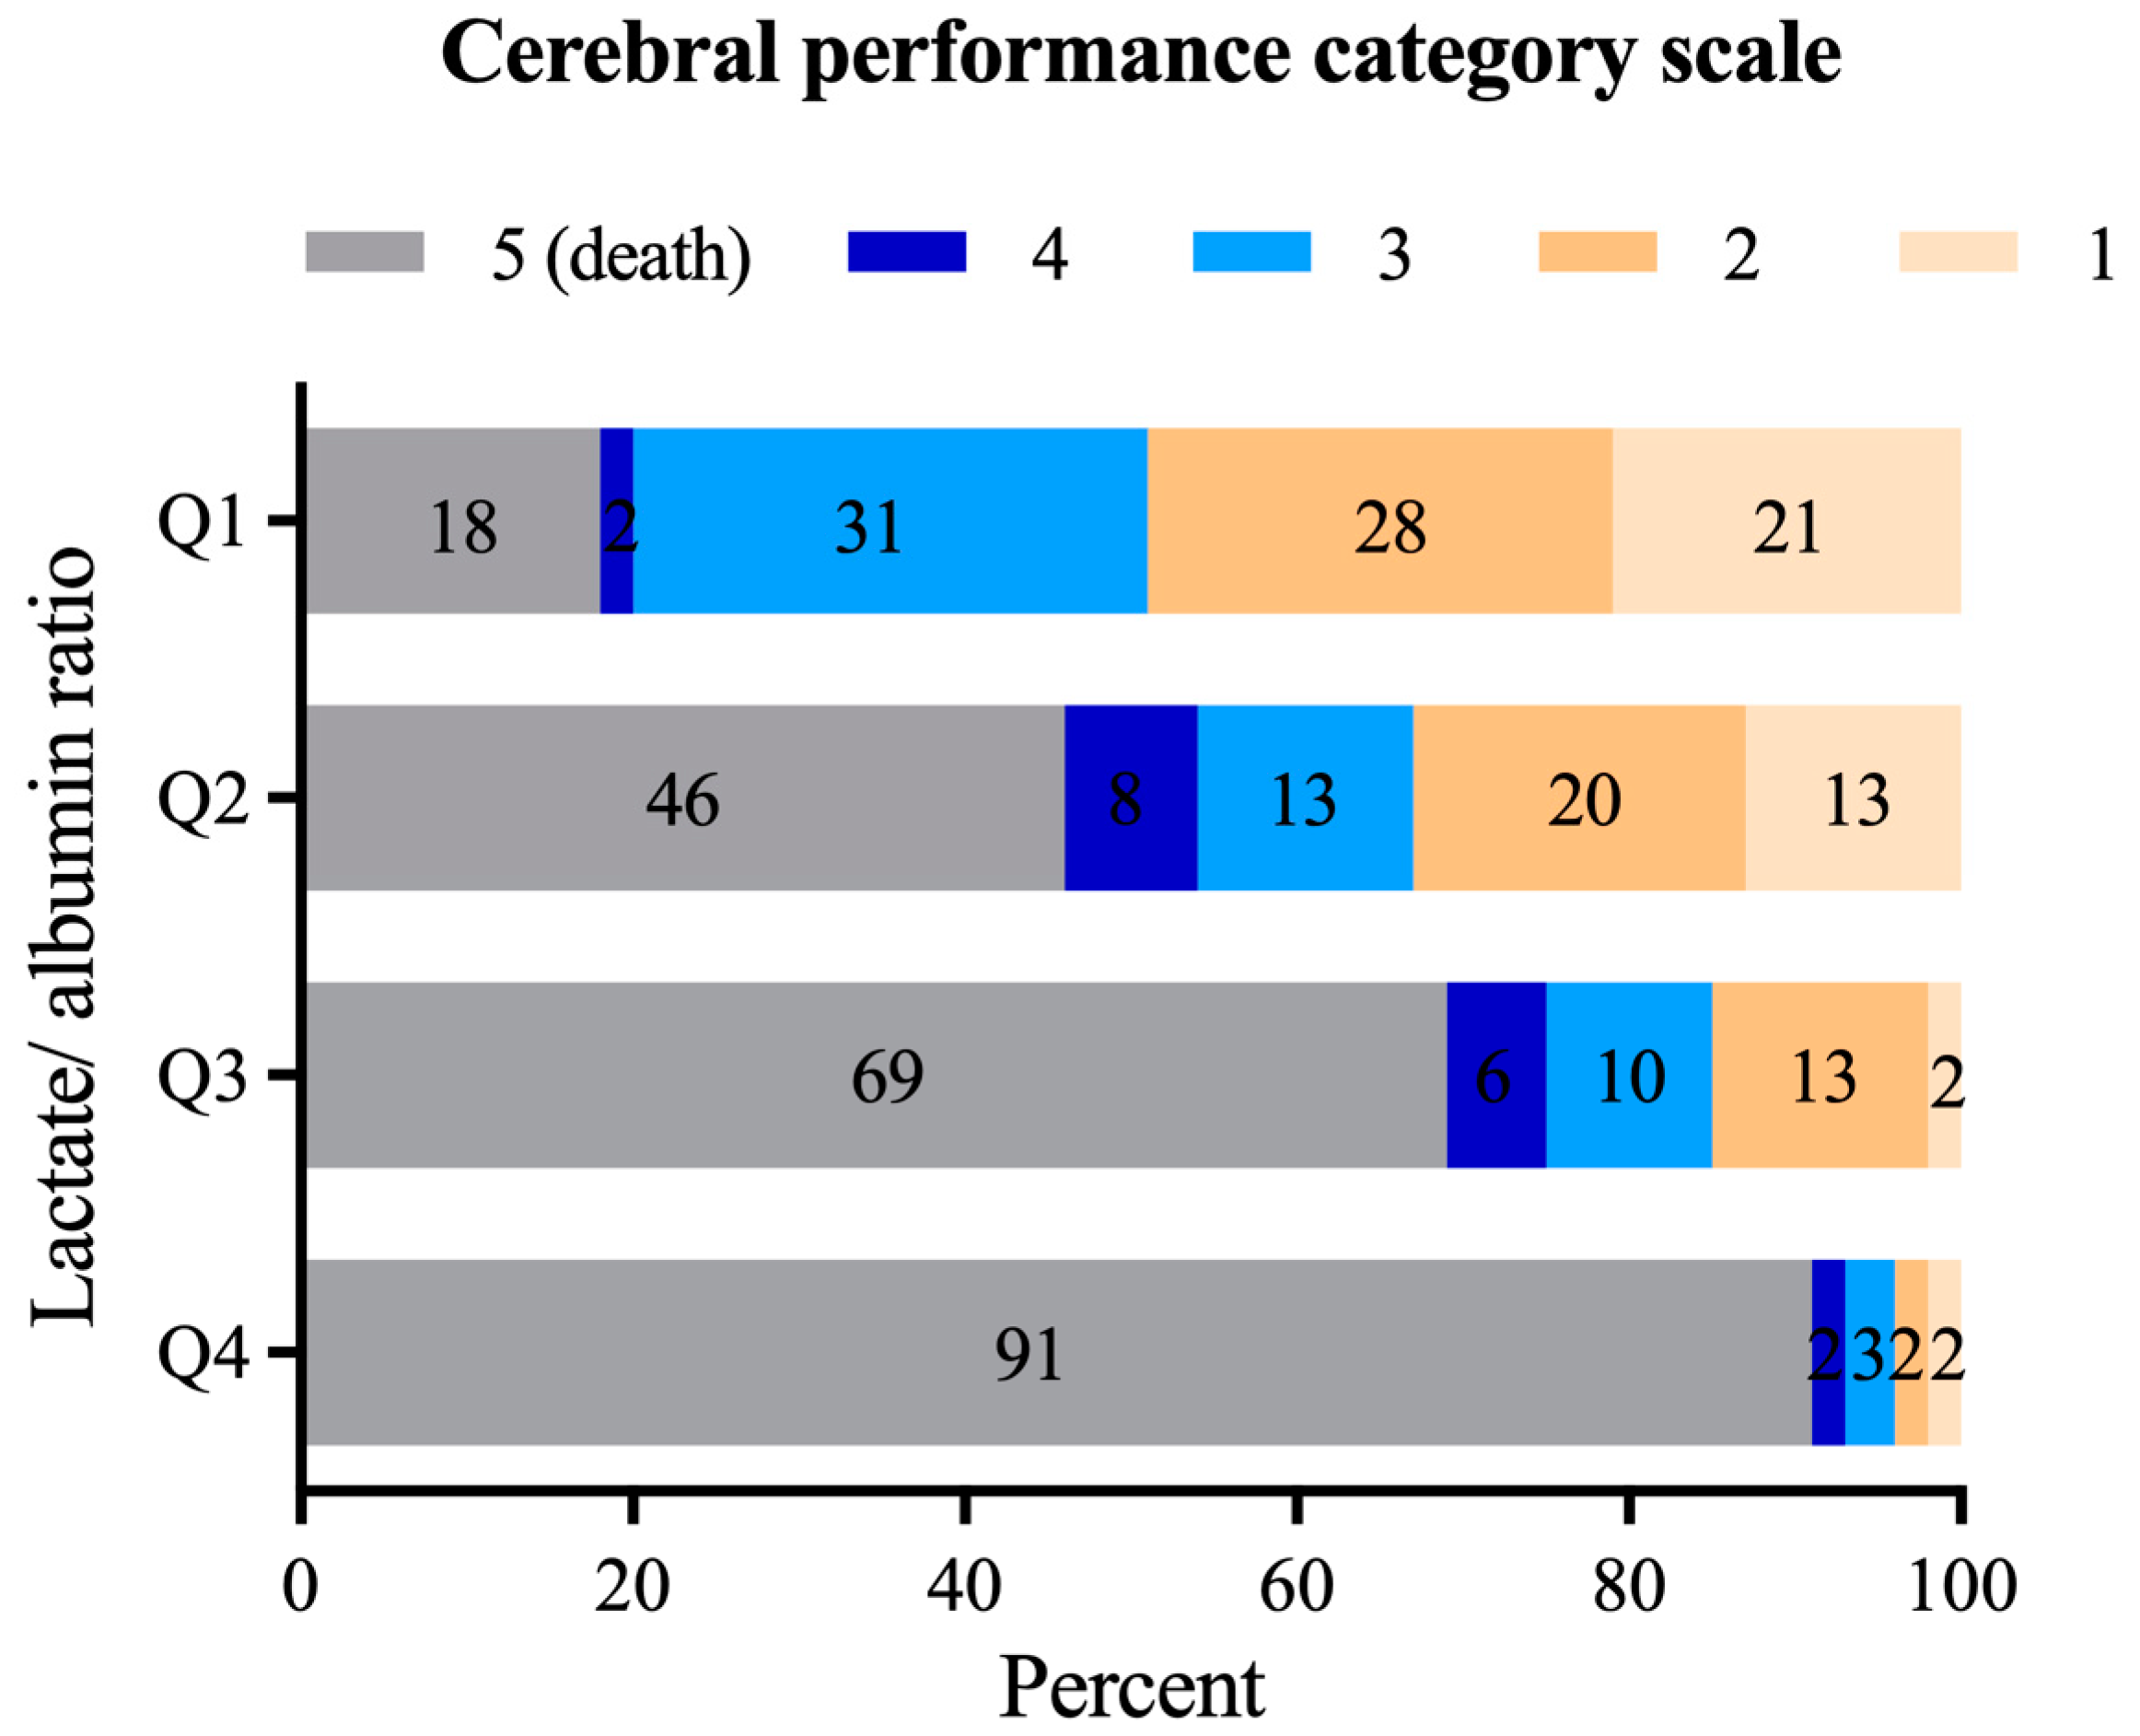
2.3. Cerebral Performance Category
2.4. Statistical Analysis
3. Results
3.1. Patients’ Characteristics
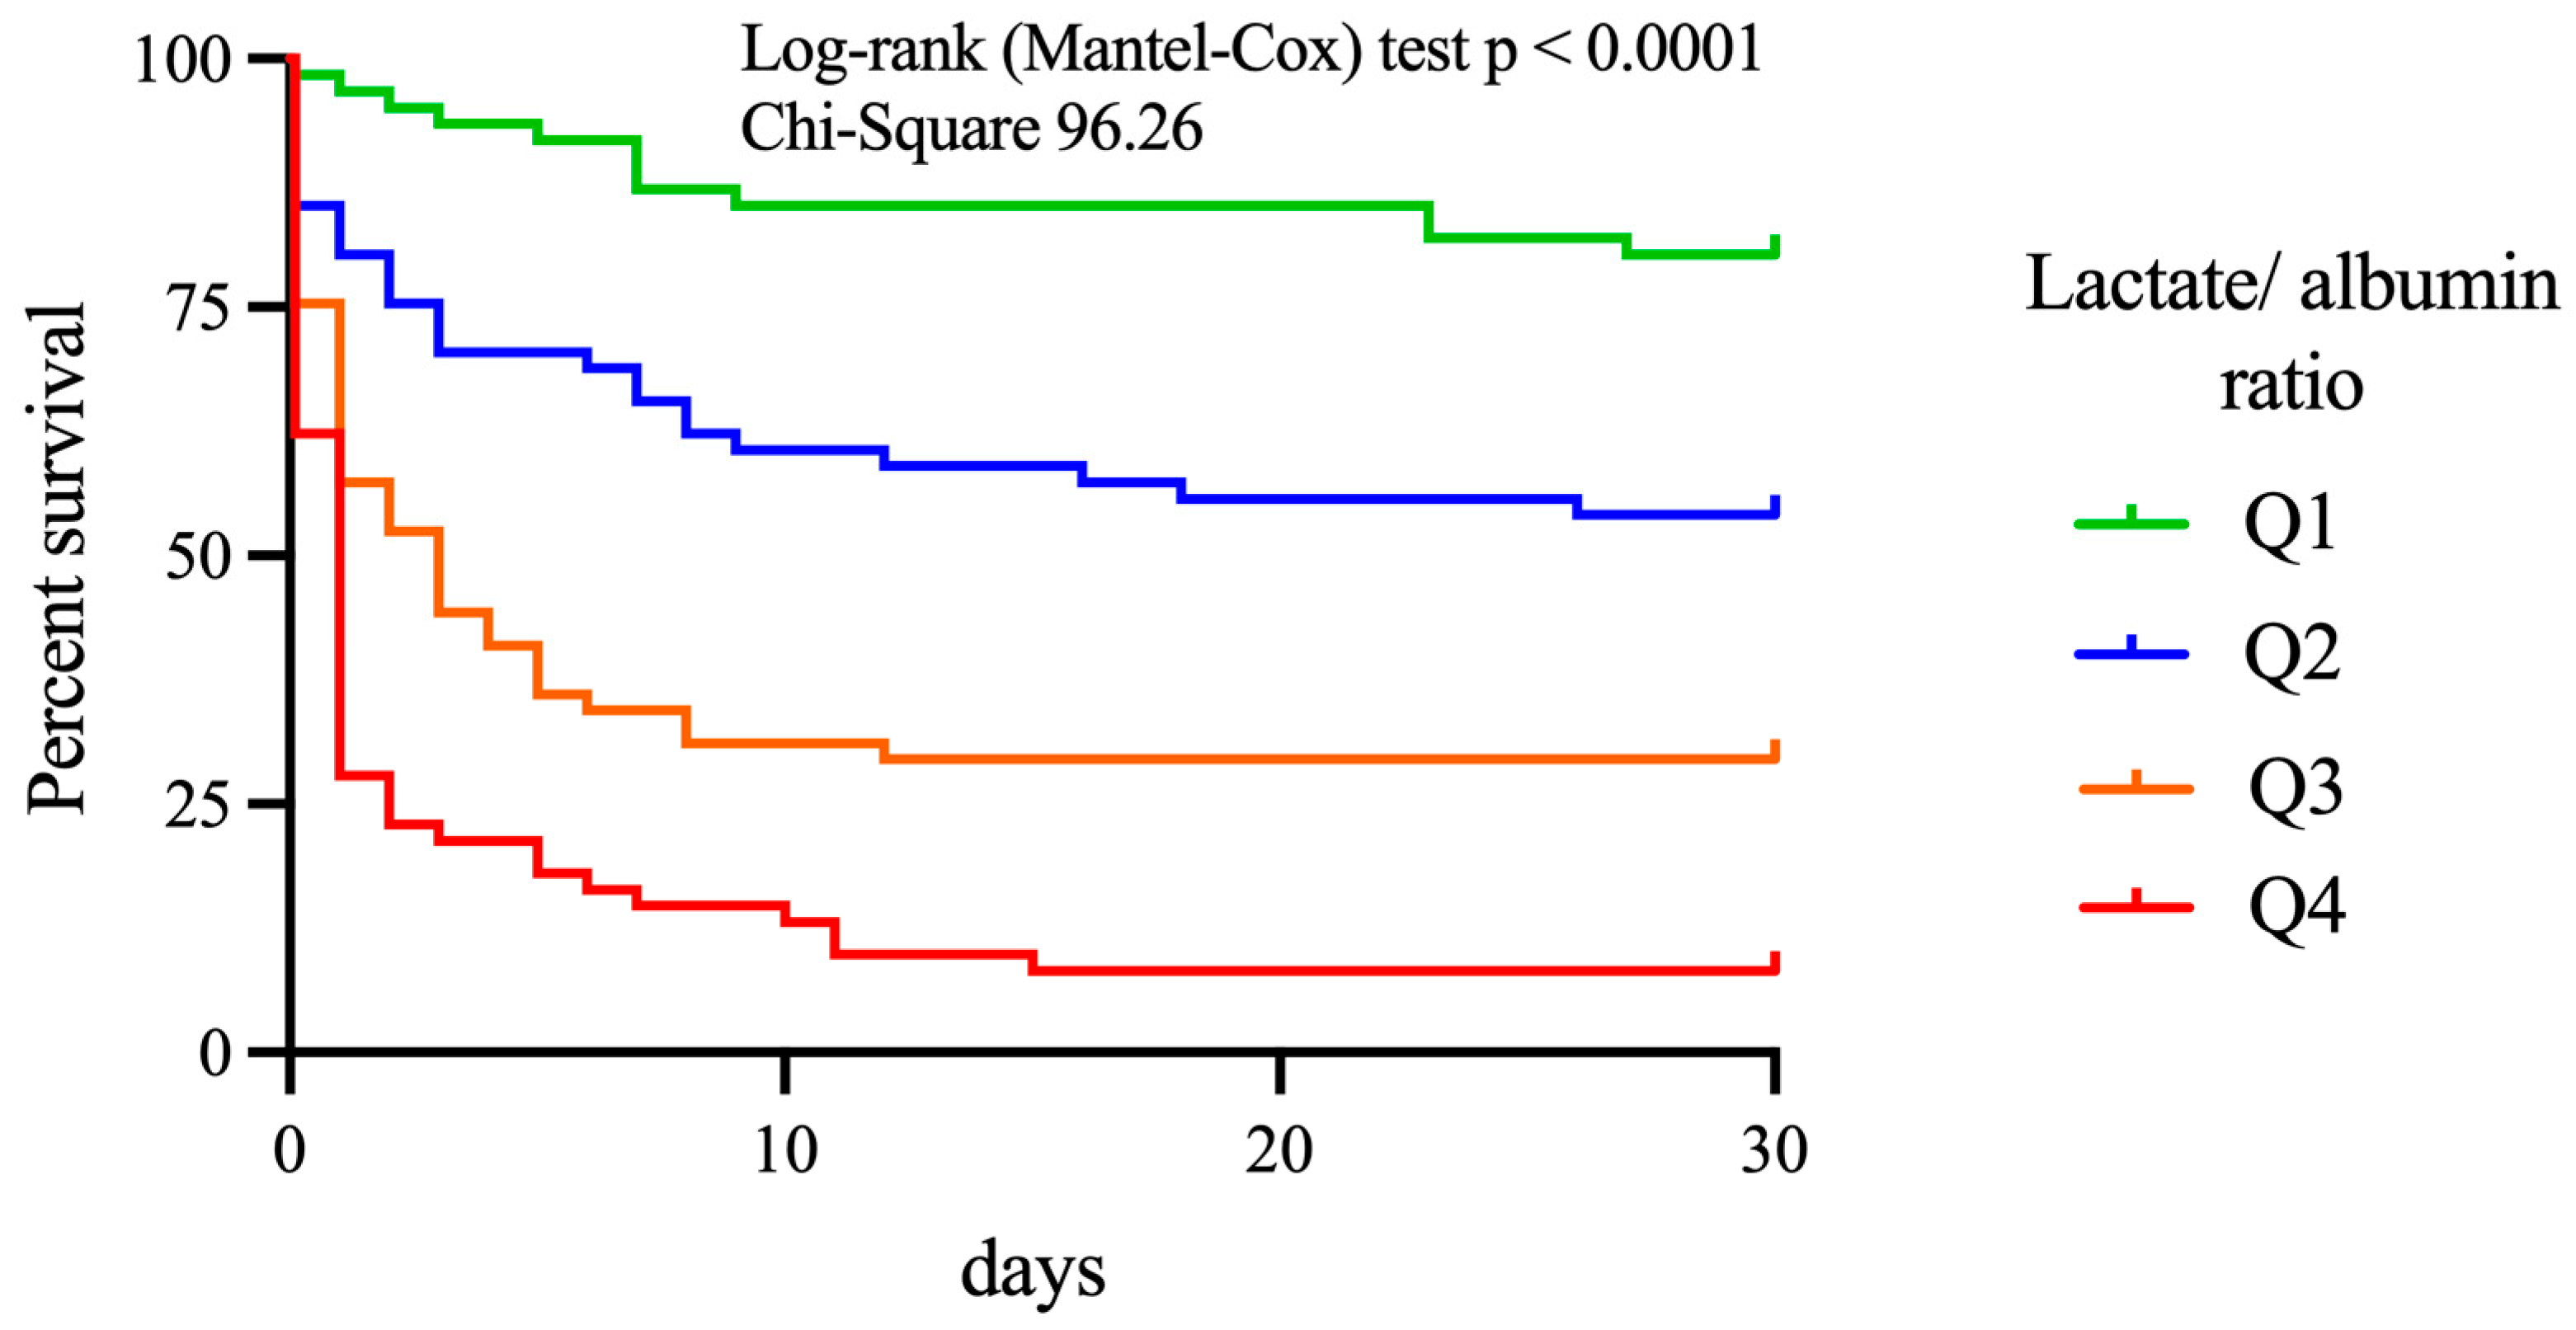
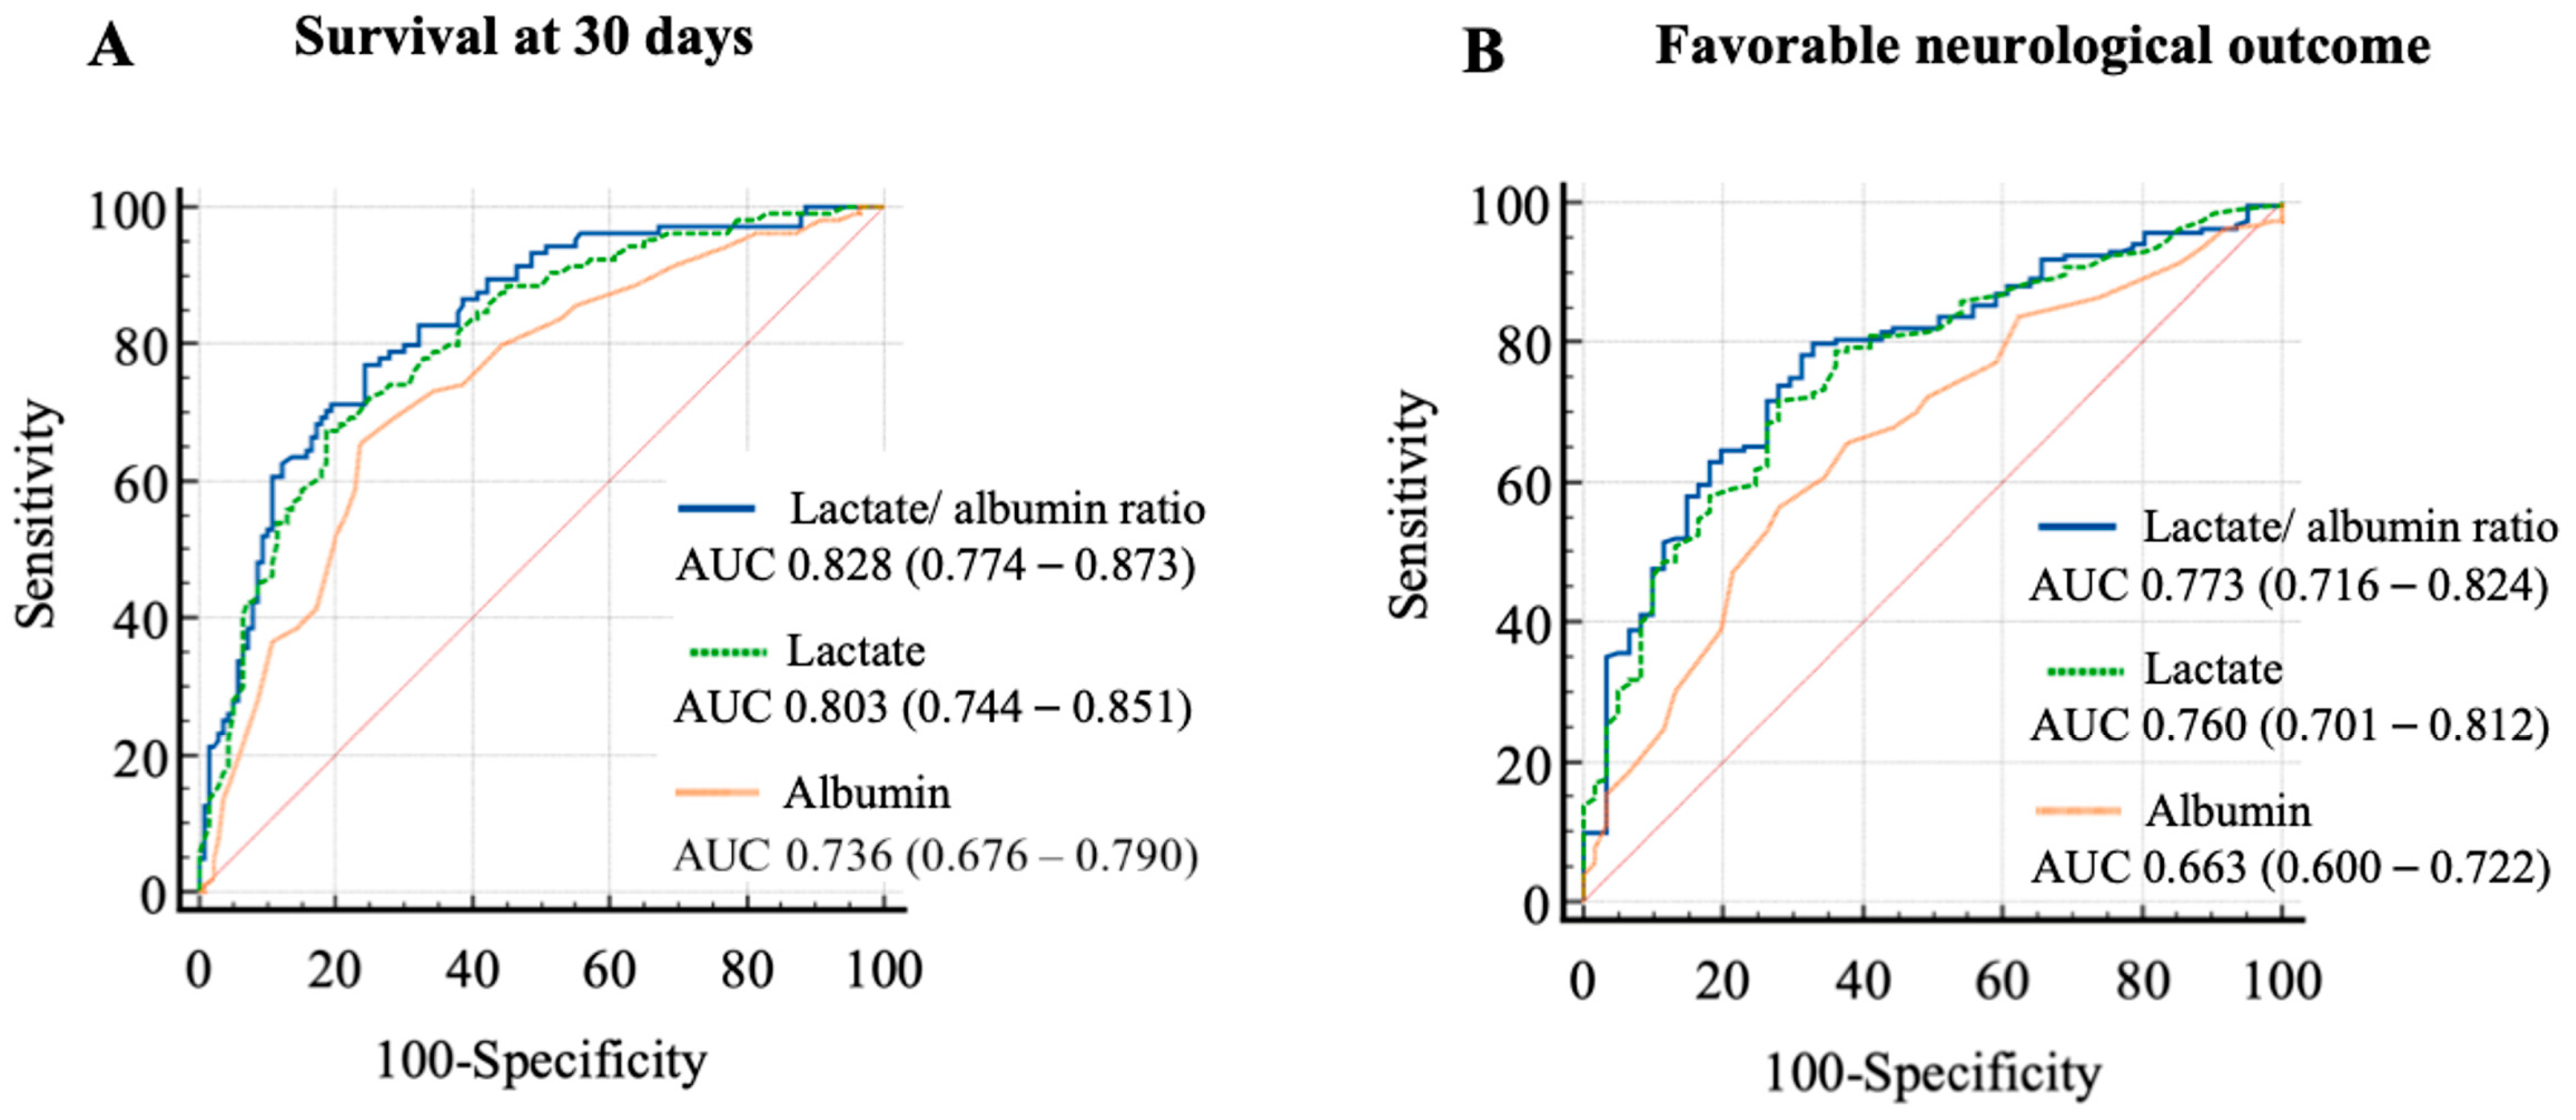
3.2. The Outcome of Patients after IHCA
4. Discussion
Author Contributions
Funding
Institutional Review Board Statement
Informed Consent Statement
Data Availability Statement
Conflicts of Interest
Appendix A

| Patient Characteristics | Univariate | Multivariate | ||||
|---|---|---|---|---|---|---|
| OR | 95% CI | p-Value | OR | 95% CI | p-Value | |
| Age, years | 0.971 | 0.949–0.992 | 0.008 * | 0.976 | 0.935–1.009 | 0.267 |
| Sex (female) | 0.864 | 0.512–1.457 | 0.583 | |||
| Diabetes mellitus | 0.908 | 0.512–1.611 | 0.742 | |||
| Hypertension | 0.750 | 0.409–1.376 | 0.353 | |||
| CAD | 2.158 | 1.249–3.727 | 0.006 * | |||
| PAD | 0.791 | 0.386–1.624 | 0.523 | |||
| Chronic kidney disease | 0.739 | 0.572–0.954 | 0.020 * | |||
| Charlson Comorbidity Index | 0.897 | 0.804–1.001 | 0.053 * | |||
| GFR, mL/min | 1.018 | 1.008–1.028 | 0.001 * | 1.007 | 0.987–1.027 | 0.497 |
| Haemoglobin, g/dL | 1.259 | 1.133–1.399 | 0.001 * | 1.246 | 1.008–1.541 | 0.042 * |
| elective admission | 1.759 | 0.824–3.754 | 0.145 | |||
| cardiac origin of IHCA | 2.262 | 1.346–3.800 | 0.002 * | 0.483 | 0.134–1.733 | 0.264 |
| Arrest time on-hours, min | 1.614 | 0.948–2.746 | 0.078 | 2.374 | 0.711–7.926 | 0.160 |
| Primary shockable rhythm | 4.425 | 2.545–7.695 | 0.001 * | 3.906 | 1.039–14.689 | 0.044 * |
| Defibrillation, n (%) | 4.049 | 2.341–7.002 | 0.001 * | |||
| Number of epinephrine applications, n | 0.569 | 0.472–0.686 | 0.001 * | |||
| Time to ROSC | 0.928 | 0.903–0.953 | 0.001 * | 0.442 | 0.953–1.021 | 0.442 |
| ECLS | 1.717 | 0.450–6.558 | 0.429 | |||
| PCI after ROSC | 2.550 | 1.430–4.549 | 0.002 * | |||
| Lactate after ROSC | 0.776 | 0.720–0.835 | 0.001 * | |||
| Albumin after ROSC | 2.213 | 1.535–3.190 | 0.001 * | |||
| LAR after ROSC | 0.498 | 0.407–0.610 | 0.001 * | 0.616 | 0.422–0.899 | 0.012 * |
| Troponin after ROSC | 1.000 | 1.000–1.000 | 0.113 | |||
| NSE peak level | 0.983 | 0.974–0.993 | 0.001 * | 0.991 | 0.980–1.012 | 0.119 |
Appendix B
| Patient Characteristics | Univariate | Multivariate | ||||
|---|---|---|---|---|---|---|
| OR | 95% CI | p-Value | OR | 95% CI | p-Value | |
| Age, years | 0.963 | 0.940–0.987 | 0.002 * | 0.964 | 0.920–1.011 | 0.136 |
| Sex (female) | 0.882 | 0.483–1.609 | 0.682 | |||
| Diabetes mellitus | 0.677 | 0.339–1.353 | 0.269 | |||
| Hypertension | 0.660 | 0.339–1.286 | 0.222 | |||
| CAD | 1.281 | 0.695–2.364 | 0.269 | |||
| PAD | 0.657 | 0.273–1.582 | 0.349 | |||
| Chronic kidney disease | 0.662 | 0.484–0.904 | 0.010 * | |||
| Charlson Comorbidity Index | 0.836 | 0.734–0.952 | 0.007 * | 0.939 | 0.731–1.207 | 0.625 |
| GFR, mL/min | 1.017 | 1.006–1.029 | 0.002 * | 0.998 | 0.977–1.020 | 0.857 |
| Haemoglobin, g/dL | 1.188 | 1.061–1.331 | 0.003 * | 1.186 | 0.969–1.453 | 0.098 |
| elective admission | 1.503 | 0.665–3.400 | 0.328 | |||
| cardiac origin of IHCA | 2.162 | 1.188–3.934 | 0.012 * | 1.987 | 0.636–6.155 | 0.239 |
| Arrest time on-hours | 1.373 | 0.745–2.530 | 0.309 | 2.159 | 0.682–6.831 | 0.190 |
| Primary shockable rhythm | 1.603 | 0.889–2.888 | 0.116 | 0.698 | 0.218–2.230 | 0.544 |
| Defibrillation, n (%) | 1.514 | 0.841–2.726 | 0.167 | |||
| Number of epinephrine applications, n | 0.631 | 0.512–0.776 | 0.001 * | |||
| Time to ROSC | 0.951 | 0.925–0.978 | 0.001 * | 1.016 | 0.983–1.050 | 0.351 |
| ECLS | 0.839 | 0.171–4.193 | 0.429 | |||
| Lactate after ROSC | 0.800 | 0.736–0.870 | 0.001 * | |||
| Albumin after ROSC | 2.133 | 1.412–3.224 | 0.001 * | |||
| LAR after ROSC | 0.577 | 0.444–0.698 | 0.001 * | 0 | 0.540–0.997 | 0.048 * |
| Troponine after ROSC | 1.000 | 1.000–1.000 | 0.304 | |||
| NSE peak level | 0.989 | 0.979–0.999 | 0.034 * | 0.992 | 0.981–1.003 | 0.170 |
References
- Schluep, M.; Gravesteijn, B.Y.; Stolker, R.J.; Endeman, H.; Hoeks, S.E. One-year survival after in-hospital cardiac arrest: A systematic review and meta-analysis. Resuscitation 2018, 132, 90–100. [Google Scholar] [CrossRef]
- Jeon, S.B.; Lee, H.; Park, B.; Choi, S.H.; Hong, Y.H.; Kim, W.Y.; Hong, S.B.; Kim, Y.H. Neurological and clinical status from early time point to long-term follow-up after in-hospital cardiac arrest. Resuscitation 2021, 162, 334–342. [Google Scholar] [CrossRef]
- Andersen, L.W.; Holmberg, M.J.; Berg, K.M.; Donnino, M.W.; Granfeldt, A. In-Hospital Cardiac Arrest: A Review. JAMA 2019, 321, 1200–1210. [Google Scholar] [CrossRef] [PubMed]
- Gräsner, J.-T.; Herlitz, J.; Tjelmeland, I.B.M.; Wnent, J.; Masterson, S.; Lilja, G.; Bein, B.; Böttiger, B.W.; Rosell-Ortiz, F.; Nolan, J.P.; et al. European Resuscitation Council Guidelines 2021: Epidemiology of cardiac arrest in Europe. Resuscitation 2021, 161, 61–79. [Google Scholar] [CrossRef] [PubMed]
- Girotra, S.; Chan, P.S.; Bradley, S.M. Post-resuscitation care following out-of-hospital and in-hospital cardiac arrest. Heart 2015, 101, 1943–1949. [Google Scholar] [CrossRef] [PubMed]
- Nolan, J.P.; Sandroni, C.; Bottiger, B.W.; Cariou, A.; Cronberg, T.; Friberg, H.; Genbrugge, C.; Haywood, K.; Lilja, G.; Moulaert, V.R.M.; et al. European Resuscitation Council and European Society of Intensive Care Medicine guidelines 2021: Post-resuscitation care. Intensive Care Med. 2021, 47, 369–421. [Google Scholar] [CrossRef] [PubMed]
- Sandroni, C.; Nolan, J.; Cavallaro, F.; Antonelli, M. In-hospital cardiac arrest: Incidence, prognosis and possible measures to improve survival. Intensive Care Med. 2007, 33, 237–245. [Google Scholar] [CrossRef]
- Lazzarin, T.; Tonon, C.R.; Martins, D.; Favero, E.L.; Baumgratz, T.D., Jr.; Pereira, F.W.L.; Pinheiro, V.R.; Ballarin, R.S.; Queiroz, D.A.R.; Azevedo, P.S.; et al. Post-Cardiac Arrest: Mechanisms, Management, and Future Perspectives. J. Clin. Med. 2022, 12, 259. [Google Scholar] [CrossRef] [PubMed]
- Sandroni, C.; D’Arrigo, S.; Cacciola, S.; Hoedemaekers, C.W.E.; Westhall, E.; Kamps, M.J.A.; Taccone, F.S.; Poole, D.; Meijer, F.J.A.; Antonelli, M.; et al. Prediction of good neurological outcome in comatose survivors of cardiac arrest: A systematic review. Intensive Care Med. 2022, 48, 389–413. [Google Scholar] [CrossRef] [PubMed]
- Ekmektzoglou, K.A.; Xanthos, T.; Papadimitriou, L. Biochemical markers (NSE, S-100, IL-8) as predictors of neurological outcome in patients after cardiac arrest and return of spontaneous circulation. Resuscitation 2007, 75, 219–228. [Google Scholar] [CrossRef]
- Mussack, T.; Biberthaler, P.; Kanz, K.G.; Wiedemann, E.; Gippner-Steppert, C.; Mutschler, W.; Jochum, M. Serum S-100B and interleukin-8 as predictive markers for comparative neurologic outcome analysis of patients after cardiac arrest and severe traumatic brain injury. Crit. Care Med. 2002, 30, 2669–2674. [Google Scholar] [CrossRef]
- Issa, M.S.; Grossestreuer, A.V.; Patel, H.; Ntshinga, L.; Coker, A.; Yankama, T.; Donnino, M.W.; Berg, K.M. Lactate and hypotension as predictors of mortality after in-hospital cardiac arrest. Resuscitation 2021, 158, 208–214. [Google Scholar] [CrossRef]
- Arques, S. Human serum albumin in cardiovascular diseases. Eur. J. Intern. Med. 2018, 52, 8–12. [Google Scholar] [CrossRef]
- Belinskaia, D.A.; Voronina, P.A.; Shmurak, V.I.; Jenkins, R.O.; Goncharov, N.V. Serum Albumin in Health and Disease: Esterase, Antioxidant, Transporting and Signaling Properties. Int. J. Mol. Sci. 2021, 22, 10318. [Google Scholar] [CrossRef] [PubMed]
- Hong, S.I.; Kim, Y.J.; Cho, Y.J.; Huh, J.W.; Hong, S.B.; Kim, W.Y. Predictive value of pre-arrest albumin level with GO-FAR score in patients with in-hospital cardiac arrest. Sci. Rep. 2021, 11, 10631. [Google Scholar] [CrossRef] [PubMed]
- Kong, T.; Chung, S.P.; Lee, H.S.; Kim, S.; Lee, J.; Hwang, S.O.; Shin, S.D.; Song, K.J.; Cha, K.C.; You, J.S. The Prognostic Usefulness of the Lactate/Albumin Ratio for Predicting Clinical Outcomes in Out-of-Hospital Cardiac Arrest: A Prospective, Multicenter Observational Study (koCARC) Study. Shock 2020, 53, 442–451. [Google Scholar] [CrossRef] [PubMed]
- Witten, L.; Gardner, R.; Holmberg, M.J.; Wiberg, S.; Moskowitz, A.; Mehta, S.; Grossestreuer, A.V.; Yankama, T.; Donnino, M.W.; Berg, K.M. Reasons for death in patients successfully resuscitated from out-of-hospital and in-hospital cardiac arrest. Resuscitation 2019, 136, 93–99. [Google Scholar] [CrossRef]
- Andersson, A.; Arctaedius, I.; Cronberg, T.; Levin, H.; Nielsen, N.; Friberg, H.; Lybeck, A. In-hospital versus out-of-hospital cardiac arrest: Characteristics and outcomes in patients admitted to intensive care after return of spontaneous circulation. Resuscitation 2022, 176, 1–8. [Google Scholar] [CrossRef]
- Grossestreuer, A.V.; Abella, B.S.; Sheak, K.R.; Cinousis, M.J.; Perman, S.M.; Leary, M.; Wiebe, D.J.; Gaieski, D.F. Inter-rater reliability of post-arrest cerebral performance category (CPC) scores. Resuscitation 2016, 109, 21–24. [Google Scholar] [CrossRef]
- Chan, P.S.; Spertus, J.A.; Krumholz, H.M.; Berg, R.A.; Li, Y.; Sasson, C.; Nallamothu, B.K.; Get With the Guidelines-Resuscitation Registry, I. A validated prediction tool for initial survivors of in-hospital cardiac arrest. Arch. Intern. Med. 2012, 172, 947–953. [Google Scholar] [CrossRef]
- Wiberg, S.; Holmberg, M.J.; Donnino, M.W.; Kjaergaard, J.; Hassager, C.; Witten, L.; Berg, K.M.; Moskowitz, A.; Andersen, L.W.; American Heart Association’s Get With The Guidelines-Resuscitation, I. Age-dependent trends in survival after adult in-hospital cardiac arrest. Resuscitation 2020, 151, 189–196. [Google Scholar] [CrossRef]
- Piscator, E.; Goransson, K.; Forsberg, S.; Bottai, M.; Ebell, M.; Herlitz, J.; Djarv, T. Prearrest prediction of favourable neurological survival following in-hospital cardiac arrest: The Prediction of outcome for In-Hospital Cardiac Arrest (PIHCA) score. Resuscitation 2019, 143, 92–99. [Google Scholar] [CrossRef]
- Kang, J.Y.; Kim, Y.J.; Shin, Y.J.; Huh, J.W.; Hong, S.B.; Kim, W.Y. Association Between Time to Defibrillation and Neurologic Outcome in Patients With In-Hospital Cardiac Arrest. Am. J. Med. Sci. 2019, 358, 143–148. [Google Scholar] [CrossRef]
- Brady, W.J.; Gurka, K.K.; Mehring, B.; Peberdy, M.A.; O’Connor, R.E.; American Heart Association’s Get with the Guidelines Investigators. In-hospital cardiac arrest: Impact of monitoring and witnessed event on patient survival and neurologic status at hospital discharge. Resuscitation 2011, 82, 845–852. [Google Scholar] [CrossRef]
- Rohlin, O.; Taeri, T.; Netzereab, S.; Ullemark, E.; Djarv, T. Duration of CPR and impact on 30-day survival after ROSC for in-hospital cardiac arrest-A Swedish cohort study. Resuscitation 2018, 132, 1–5. [Google Scholar] [CrossRef]
- Pound, G.; Jones, D.; Eastwood, G.M.; Paul, E.; Hodgson, C.L.; Investigators, A.-C. Survival and functional outcome at hospital discharge following in-hospital cardiac arrest (IHCA): A prospective multicentre observational study. Resuscitation 2020, 155, 48–54. [Google Scholar] [CrossRef]
- Wang, C.H.; Huang, C.H.; Chang, W.T.; Tsai, M.S.; Yu, P.H.; Wang, A.Y.; Chen, N.C.; Chen, W.J. Association between hemoglobin levels and clinical outcomes in adult patients after in-hospital cardiac arrest: A retrospective cohort study. Intern. Emerg. Med. 2016, 11, 727–736. [Google Scholar] [CrossRef]
- Zama Cavicchi, F.; Iesu, E.; Franchi, F.; Nobile, L.; Annoni, F.; Vincent, J.L.; Scolletta, S.; Creteur, J.; Taccone, F.S. Low hemoglobin and venous saturation levels are associated with poor neurological outcomes after cardiac arrest. Resuscitation 2020, 153, 202–208. [Google Scholar] [CrossRef] [PubMed]
- Oddo, M.; Levine, J.M.; Kumar, M.; Iglesias, K.; Frangos, S.; Maloney-Wilensky, E.; Le Roux, P.D. Anemia and brain oxygen after severe traumatic brain injury. Intensive Care Med. 2012, 38, 1497–1504. [Google Scholar] [CrossRef] [PubMed]
- La Via, L.; Astuto, M.; Bignami, E.G.; Busalacchi, D.; Dezio, V.; Girardis, M.; Lanzafame, B.; Ristagno, G.; Pelosi, P.; Sanfilippo, F. The effects of exposure to severe hyperoxemia on neurological outcome and mortality after cardiac arrest. Minerva Anestesiol. 2022, 88, 853–863. [Google Scholar]
- Robba, C.; Badenes, R.; Battaglini, D.; Ball, L.; Sanfilippo, F.; Brunetti, I.; Jakobsen, J.C.; Lilja, G.; Friberg, H.; Wendel-Garcia, P.D.; et al. Oxygen targets and 6-month outcome after out of hospital cardiac arrest: A pre-planned sub-analysis of the targeted hypothermia versus targeted normothermia after Out-of-Hospital Cardiac Arrest (TTM2) trial. Crit. Care 2022, 26, 323. [Google Scholar] [CrossRef]
- La Via, L.; Sanfilippo, F.; Continella, C.; Triolo, T.; Messina, A.; Robba, C.; Astuto, M.; Hernandez, G.; Noto, A. Agreement between Capillary Refill Time measured at Finger and Earlobe sites in different positions: A pilot prospective study on healthy volunteers. BMC Anesthesiol. 2023, 23, 30. [Google Scholar] [CrossRef]
- Hernandez, G.; Ospina-Tascon, G.A.; Damiani, L.P.; Estenssoro, E.; Dubin, A.; Hurtado, J.; Friedman, G.; Castro, R.; Alegria, L.; Teboul, J.L.; et al. Effect of a Resuscitation Strategy Targeting Peripheral Perfusion Status vs Serum Lactate Levels on 28-Day Mortality Among Patients With Septic Shock: The ANDROMEDA-SHOCK Randomized Clinical Trial. JAMA 2019, 321, 654–664. [Google Scholar] [CrossRef]
- George, N.; Thai, T.N.; Chan, P.S.; Ebell, M.H. Predicting the probability of survival with mild or moderate neurological dysfunction after in-hospital cardiopulmonary arrest: The GO-FAR 2 score. Resuscitation 2020, 146, 162–169. [Google Scholar] [CrossRef]
- Ebell, M.H.; Jang, W.; Shen, Y.; Geocadin, R.G. Development and Validation of the Good Outcome Following Attempted Resuscitation (GO-FAR) Score to Predict Neurologically Intact Survival After In-Hospital Cardiopulmonary Resuscitation. JAMA Intern. Med. 2013, 173, 1872. [Google Scholar] [CrossRef]
- Rubins, J.B.; Kinzie, S.D.; Rubins, D.M. Predicting Outcomes of In-Hospital Cardiac Arrest: Retrospective US Validation of the Good Outcome Following Attempted Resuscitation Score. J. Gen. Intern. Med. 2019, 34, 2530–2535. [Google Scholar] [CrossRef] [PubMed]
- Evans, L.; Rhodes, A.; Alhazzani, W.; Antonelli, M.; Coopersmith, C.M.; French, C.; Machado, F.R.; McIntyre, L.; Ostermann, M.; Prescott, H.C.; et al. Surviving Sepsis Campaign: International Guidelines for Management of Sepsis and Septic Shock 2021. Crit. Care Med. 2021, 49, e1063–e1143. [Google Scholar] [CrossRef] [PubMed]
- Donnino, M.W.; Andersen, L.W.; Giberson, T.; Gaieski, D.F.; Abella, B.S.; Peberdy, M.A.; Rittenberger, J.C.; Callaway, C.W.; Ornato, J.; Clore, J.; et al. Initial lactate and lactate change in post-cardiac arrest: A multicenter validation study. Crit. Care Med. 2014, 42, 1804–1811. [Google Scholar] [CrossRef] [PubMed]
- Shin, T.G.; Jo, I.J.; Hwang, S.Y.; Jeon, K.; Suh, G.Y.; Choe, E.; Lee, Y.K.; Lee, T.R.; Cha, W.C.; Sim, M.S. Comprehensive Interpretation of Central Venous Oxygen Saturation and Blood Lactate Levels During Resuscitation of Patients With Severe Sepsis and Septic Shock in the Emergency Department. Shock 2016, 45, 4–9. [Google Scholar] [CrossRef] [PubMed]
- Park, J.; Hwang, S.Y.; Jo, I.J.; Jeon, K.; Suh, G.Y.; Lee, T.R.; Yoon, H.; Cha, W.C.; Sim, M.S.; Carriere, K.C.; et al. Impact of Metformin Use on Lactate Kinetics in Patients with Severe Sepsis and Septic Shock. Shock 2017, 47, 582–587. [Google Scholar] [CrossRef]
- Haas, S.A.; Lange, T.; Saugel, B.; Petzoldt, M.; Fuhrmann, V.; Metschke, M.; Kluge, S. Severe hyperlactatemia, lactate clearance and mortality in unselected critically ill patients. Intensive Care Med. 2016, 42, 202–210. [Google Scholar] [CrossRef]
- Nicholson, J.P.; Wolmarans, M.R.; Park, G.R. The role of albumin in critical illness. Br. J. Anaesth. 2000, 85, 599–610. [Google Scholar] [CrossRef]
- Jin, X.; Li, J.; Sun, L.; Zhang, J.; Gao, Y.; Li, R.; Ren, J.; Hou, Y.; Su, D.; Liu, J.; et al. Prognostic Value of Serum Albumin Level in Critically Ill Patients: Observational Data From Large Intensive Care Unit Databases. Front. Nutr. 2022, 9, 770674. [Google Scholar] [CrossRef] [PubMed]
- Jou, C.; Shah, R.; Figueroa, A.; Patel, J.K. The Role of Inflammatory Cytokines in Cardiac Arrest. J. Intensive Care Med. 2020, 35, 219–224. [Google Scholar] [CrossRef] [PubMed]
- Patel, J.K.; Sinha, N.; Hou, W.; Shah, R.; Qadeer, A.; Tran, L.; Parikh, P.B.; Parnia, S. Association of post-resuscitation inflammatory response with favorable neurologic outcomes in adults with in-hospital cardiac arrest. Resuscitation 2021, 159, 54–59. [Google Scholar] [CrossRef] [PubMed]
- Bihari, S.; Bannard-Smith, J.; Bellomo, R. Albumin as a drug: Its biological effects beyond volume expansion. Crit. Care Resusc. 2020, 22, 257–265. [Google Scholar] [PubMed]
- Nasif, W.A.; Mukhtar, M.H.; El-Emshaty, H.M.; Alwazna, A.H. Redox State of Human Serum Albumin and Inflammatory Biomarkers in Hemodialysis Patients with Secondary Hyperparathyroidism During Oral Calcitriol Supplementation for Vitamin D. Open Med. Chem. J. 2018, 12, 98–110. [Google Scholar] [CrossRef] [PubMed]
- Eckart, A.; Struja, T.; Kutz, A.; Baumgartner, A.; Baumgartner, T.; Zurfluh, S.; Neeser, O.; Huber, A.; Stanga, Z.; Mueller, B.; et al. Relationship of Nutritional Status, Inflammation, and Serum Albumin Levels During Acute Illness: A Prospective Study. Am. J. Med. 2020, 133, 713–722.e7. [Google Scholar] [CrossRef]
- Redelmeier, D.A. New thinking about postoperative hypoalbuminemia: A hypothesis of occult protein-losing enteropathy. Open Med. 2009, 3, e215–e219. [Google Scholar]
- Fleck, A.; Raines, G.; Hawker, F.; Trotter, J.; Wallace, P.I.; Ledingham, I.M.; Calman, K.C. Increased vascular permeability: A major cause of hypoalbuminaemia in disease and injury. Lancet 1985, 1, 781–784. [Google Scholar] [CrossRef]
- Almasaudi, A.S.; Dolan, R.D.; Edwards, C.A.; McMillan, D.C. Hypoalbuminemia Reflects Nutritional Risk, Body Composition and Systemic Inflammation and Is Independently Associated with Survival in Patients with Colorectal Cancer. Cancers 2020, 12, 1986. [Google Scholar] [CrossRef] [PubMed]
- Shin, J.; Hwang, S.Y.; Jo, I.J.; Kim, W.Y.; Ryoo, S.M.; Kang, G.H.; Kim, K.; Jo, Y.H.; Chung, S.P.; Joo, Y.S.; et al. Prognostic Value of The Lactate/Albumin Ratio for Predicting 28-Day Mortality in Critically ILL Sepsis Patients. Shock 2018, 50, 545–550. [Google Scholar] [CrossRef] [PubMed]


| Patient Characteristics | Complete Cohort (n = 244) | Q1 Group (n = 61) | Q2 Group (n = 61) | Q3 Group (n = 61) | Q4 Group (n = 61) | p-Value |
|---|---|---|---|---|---|---|
| LAR, median | 2.47 (0.96, 4.17) | 0.54 (0.38, 0.70) | 1.64 (1.22, 2.12) | 3.39 (2.71, 3.78) | 5.93 (5.16, 8.19) | <0.001 |
| Lactate after ROSC, median in mmol/L | 7.0 (3.3, 11.3) | 1.7 (1.2, 2.4) | 5.0 (4.2, 6.5) * | 9.3 (7.7, 10.9) *# | 14.0 (12.3, 19.3) *#° | <0.001 |
| Albumin, median in g/dL | 3.0 (2.4, 3.6) | 3.7 (3.0, 3.9) | 3.3 (2.9, 3.7) | 2.8 (2.5, 3.5) *# | 2.3 (1.8, 2.8) *#° | <0.001 |
| Age, median, years | 73 (63, 80) | 73 (65, 81) | 75 (60, 81) | 71 (64, 80) | 71 (60, 81) | 0.856 |
| Women/male, n/n (%/%) | 94/150 (39/61) | 23/38 (38/62) | 20/41 (33/67) | 22/39 (36/64) | 29/32 (48/52) | 0.374 |
| CAD, n (%) | 150 (61) | 37 (61) | 47 (77) | 37 (61) | 33 (54) | 0.057 |
| PAD, n (%) | 37 (15) | 7 (11) | 9 (15) | 13 (21) | 8 (13) | 0.450 |
| Arterial hypertension, n (%) | 190 (78) | 46 (75) | 51 (84) | 46 (75) | 47 (77) | 0.656 |
| Diabetes mellitus, n (%) | 66 (27) | 16 (26) | 16 (26) | 16 (26) | 18 (30) | 0.969 |
| Liver cirrhosis, n (%) | 9 (4) | 1 (2) | 4 (7) | 3 (5) | 1 (2) | 0.374 |
| Hepatis B or C, n (%) | 4 (2) | 0 (0) | 1 (2) | 2 (3) | 1 (2) | |
| GFR, median, mL/min | 45 (27, 70) | 44 (32, 74) | 49 (23, 79) | 47 (34, 77) | 40 (24, 54) | 0.205 |
| Charlson Comorbidity Index | 5 (4, 7) | 5 (4, 6) | 5 (4, 7) | 6 (4, 8) | 5 (4, 7) | 0.236 |
| Hemoglobin, median, g/dL | 10.9 (9.1, 13.0) | 12.2 (9.8, 13.9) | 11.4 (9.9, 13.9) | 10.4 (8.7, 12.6) * | 9.7 (7.9, 11.1) *# | <0.001 |
| C-reactive protein, median, mg/dL | 3.2 (0.8, 8.9) | 1.8 (0.6, 5.4) | 2.2 (0.6, 8.9) | 4.1 (1.2, 9.3) * | 5.1 (1.4, 11.6) * | 0.005 |
| Elective admission, n (%) | 31 (13) | 11 (18) | 6 (10) | 11 (18) | 3 (5) | 0.075 |
| Admission diagnosis | ||||||
| Pneumonia, n (%) | 25 (10) | 5 (8) | 3 (5) | 13 (21) | 4 (7) | |
| Acute heart failure, n (%) | 21 (9) | 4 (7) | 5 (8) | 5 (8) | 7 (11) | |
| Acute coronary syndrome, n (%) | 52 (21) | 12 (20) | 20 (33) | 10 (16) | 10 (16) | |
| Acute kidney failure, n (%) | 14 (6) | 5 (8) | 2 (3) | 2 (3) | 5 (8) | |
| Cardiac arrhythmia, n (%) | 19 (8) | 3 (5) | 3 (5) | 4 (7) | 9 (15) | |
| Gastrointestinal, n (%) | 15 (6) | 4 (7) | 3 (5) | 4 (7) | 4 (7) | |
| Sepsis, n (%) | 8 (3) | 4 (7) | 2 (3) | 2 (3) | 0 (0) | |
| Malignancy, n (%) | 25 (10) | 10 (16) | 6 (10) | 3 (5) | 6 (10) | |
| Neurology, n (%) | 21 (9) | 3 (5) | 3 (5) | 8 (13) | 7 (11) | |
| Peripheral artery disease, n (%) | 2 (1) | 1 (2) | 1 (2) | 0 (0) | 0 (0) | |
| Pulmonary embolism, n (%) | 3 (1) | 1 (2) | 2 (3) | 0 (0) | 0 (0) | |
| Other, n (%) | 40 (16) | 9 (15) | 11 (18) | 10 (16) | 10 (16) | |
| Cardiac arrest characteristics | ||||||
| Non-cardiac origin of IHCA, n (%) | 122 (50) | 26 (43) | 26 (43) | 34 (56) | 36 (59) | 0.142 |
| Arrest time off-hours, n (%) | 93 (38) | 20 (33) | 25 (41) | 20 (33) | 28 (46) | 0.355 |
| Patient Characteristics | Complete Cohort (n = 244) | Q1 Group (n = 61) | Q2 Group (n = 61) | Q3 Group (n = 61) | Q4 Group (n = 61) | p-Value |
|---|---|---|---|---|---|---|
| Primary shockable rhythm, n (%) | 91 (37) | 32 (52) | 28 (46) | 19 (31) | 12 (29) *# | 0.007 |
| Defibrillation, n (%) | 93 (38.1) | 32 (52) | 28 (46) | 19 (31) | 14 (30) * | 0.003 |
| Number of shocks performed in case of defibrillation, n | 1 (1, 1) | (1, 1) | 1 (1, 1) | 1 (1, 2) | 1 (1, 2) | 0.257 |
| Number of epinephrine applications, n | 2 (1, 4) | 0 (0, 1) | 1 (0, 3) * | 2 (1, 4) * | 3 (2, 4) *# | 0.001 |
| Time to ROSC, median, min | 11 (4, 25) | 4 (1, 10) | 10 (3, 20) * | 15 (6, 30) * | 25 (20, 30) *#° | 0.001 |
| Phosphate, median, mmol/L | 1.7 (1.2, 2.5) | 1.2 (0.9, 1.6) | 1.5 (1.2, 2.2) | 1.7 (1.1, 2.3) * | 2.4 (1.8, 3.1) *#° | 0.001 |
| TroponinT, median, ng/L | 135 (52, 431) | 69 (37, 207) | 100 (52, 672) | 136 (65, 720) * | 215 (108, 1020) * | 0.001 |
| NSE peak, median, µg/L | 45 (30, 88) | 37 (35, 142) | 37 (21, 153) | 39 (33, 293) | 115 (63, 268) *# | 0.003 |
| D-Dimere, median, I/U | 8.7 (3.1, 30.0) | 4.0 (1.7, 9.0) | 5.0 (2.6, 16.2) | 11.0 (3.6, 30) * | 20.0 (10.6, 30.0) *# | 0.001 |
| pH after ROSC, median | 7.2 (7.1, 7.3) | 7.4 (7.3, 7.4) | 7.3 (7.2, 7.3) * | 7.2 (7.0, 7.3) *# | 7.1 (7.0, 7.2) *# | 0.001 |
| PaO2, median, mmHg | 89 (77, 110) | 88 (78, 104) | 87 (77, 107) | 91 (77, 111) | 92 (78, 120) | 0.657 |
| Target temperature management, n (%) | 240 (98.4%) | 60 (98.4) | 59 (96.7) | 61 (100) | 60 (98.4) | 1 |
| PCI after ROSC, n (%) | 66 (27) | 17 (68) | 19 (31) | 16 (26) | 14 (23) | 0.782 |
| ECLS, n (%) | 9 (4) | 3 (5) | 4 (7) | 1 (2) | 1 (2) | 0.374 |
Disclaimer/Publisher’s Note: The statements, opinions and data contained in all publications are solely those of the individual author(s) and contributor(s) and not of MDPI and/or the editor(s). MDPI and/or the editor(s) disclaim responsibility for any injury to people or property resulting from any ideas, methods, instructions or products referred to in the content. |
© 2023 by the authors. Licensee MDPI, Basel, Switzerland. This article is an open access article distributed under the terms and conditions of the Creative Commons Attribution (CC BY) license (https://creativecommons.org/licenses/by/4.0/).
Share and Cite
Haschemi, J.; Müller, C.T.; Haurand, J.M.; Oehler, D.; Spieker, M.; Polzin, A.; Kelm, M.; Horn, P. Lactate to Albumin Ratio for Predicting Clinical Outcomes after In-Hospital Cardiac Arrest. J. Clin. Med. 2023, 12, 4136. https://doi.org/10.3390/jcm12124136
Haschemi J, Müller CT, Haurand JM, Oehler D, Spieker M, Polzin A, Kelm M, Horn P. Lactate to Albumin Ratio for Predicting Clinical Outcomes after In-Hospital Cardiac Arrest. Journal of Clinical Medicine. 2023; 12(12):4136. https://doi.org/10.3390/jcm12124136
Chicago/Turabian StyleHaschemi, Jafer, Charlotte Theresia Müller, Jean Marc Haurand, Daniel Oehler, Maximilian Spieker, Amin Polzin, Malte Kelm, and Patrick Horn. 2023. "Lactate to Albumin Ratio for Predicting Clinical Outcomes after In-Hospital Cardiac Arrest" Journal of Clinical Medicine 12, no. 12: 4136. https://doi.org/10.3390/jcm12124136
APA StyleHaschemi, J., Müller, C. T., Haurand, J. M., Oehler, D., Spieker, M., Polzin, A., Kelm, M., & Horn, P. (2023). Lactate to Albumin Ratio for Predicting Clinical Outcomes after In-Hospital Cardiac Arrest. Journal of Clinical Medicine, 12(12), 4136. https://doi.org/10.3390/jcm12124136