
Intravascular Ultrasound Guided Intervention in Calcified Coronary Lesions Showed Good Clinical Outcomes during One Year Follow-Up

 , , , , ,
Abstract
:1. Introduction
2. Materials and Methods
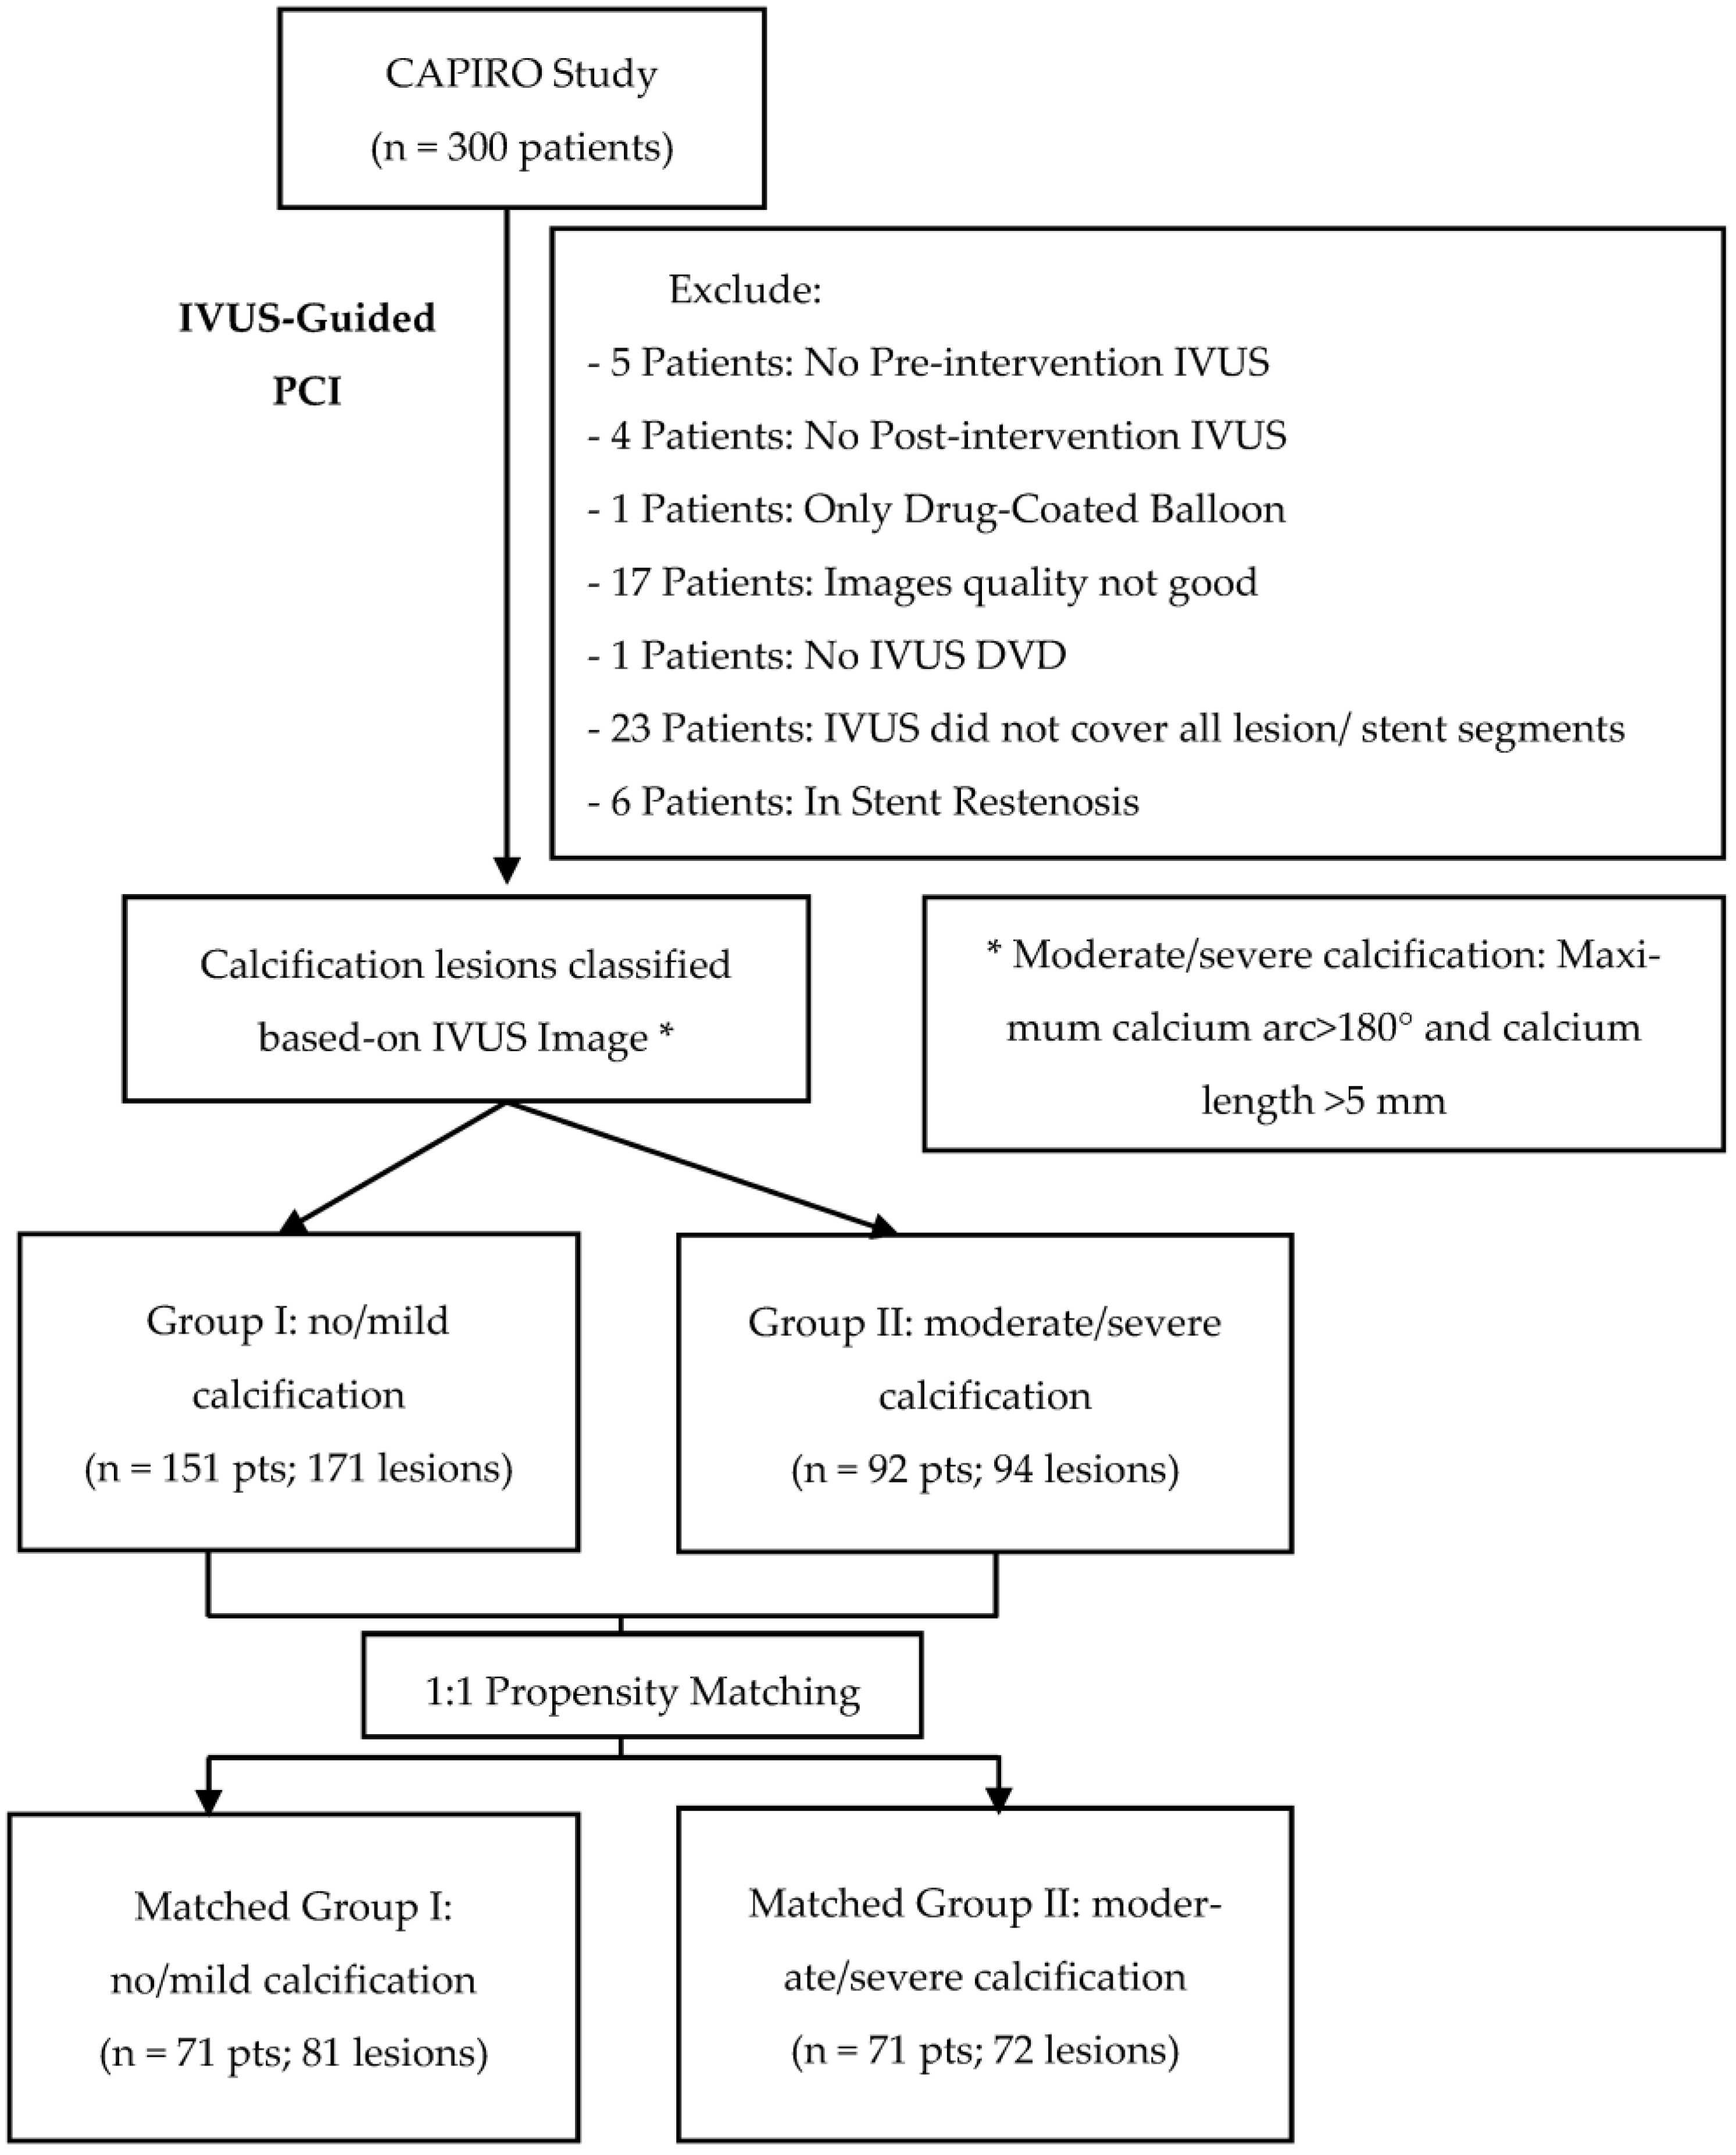
2.1. Study Designs
2.2. Study Criteria
- 18 years old or older.
- Patients consented to participate and signed informed consent forms.
- Exclusion Criteria:
- Cardiogenic shock.
- Contraindications for dual antiplatelet therapy for 12 months.
- Major bleeding within three months or major surgery within two months.
- Life expectancy is less than one year.
- In-stent restenosis lesion.
- IVUS image-related exclusions: lack of pre- or post-intervention IVUS, lack of coverage of all lesion or stent segments, and insufficient image quality for analysis.
2.3. IVUS-Guided PCI Procedure
2.4. IVUS Images Analysis
2.5. Quantitative Coronary Angiography (QCA)
2.6. Follow-Up and Endpoints
2.7. Statistical Analysis
3. Results
3.1. Baseline Clinical Characteristics
3.2. Coronary Angiography Analysis
3.3. Percutaneous Coronary Intervention-Related Findings
3.4. IVUS Images Analysis
3.5. Clinical Endpoints
4. Discussion
5. Conclusions
Author Contributions
Funding
Institutional Review Board Statement
Informed Consent Statement
Data Availability Statement
Conflicts of Interest
References
- Madhavan, M.V.; Kirtane, A.J.; Redfors, B.; Généreux, P.; Ben-Yehuda, O.; Palmerini, T.; Benedetto, U.; Biondi-Zoccai, G.; Smits, P.C.; von Birgelen, C.; et al. Stent-Related Adverse Events >1 Year After Percutaneous Coronary Intervention. J. Am. Coll. Cardiol. 2020, 75, 590–604. [Google Scholar] [CrossRef]
- De Maria, G.L.; Scarsini, R.; Banning, A.P. Management of Calcific Coronary Artery Lesions: Is it Time to Change Our Interventional Therapeutic Approach? JACC Cardiovasc. Interv. 2019, 12, 1465–1478. [Google Scholar] [CrossRef]
- Lee, M.S.; Yang, T.; Lasala, J.; Cox, D. Impact of coronary artery calcification in percutaneous coronary intervention with paclitaxel-eluting stents: Two-year clinical outcomes of paclitaxel-eluting stents in patients from the ARRIVE program. Catheter. Cardiovasc. Interv. 2016, 88, 891–897. [Google Scholar] [CrossRef] [PubMed]
- Kim, M.C.; Ahn, Y.; Sim, D.S.; Hong, Y.J.; Kim, J.H.; Jeong, M.H.; Gwon, H.C.; Kim, H.S.; Rha, S.W.; Yoon, J.H.; et al. Impact of calcified bifurcation lesions in patients undergoing percutaneous coronary intervention using drug-eluting stents: Results from the COronary BIfurcation Stent (COBIS) II registry. EuroIntervention 2017, 13, 338–344. [Google Scholar] [CrossRef]
- Guedeney, P.; Claessen, B.E.; Mehran, R.; Mintz, G.S.; Liu, M.; Sorrentino, S.; Giustino, G.; Farhan, S.; Leon, M.B.; Serruys, P.W.; et al. Coronary Calcification and Long-Term Outcomes According to Drug-Eluting Stent Generation. JACC Cardiovasc. Interv. 2020, 13, 1417–1428. [Google Scholar] [CrossRef] [PubMed]
- Sharma, S.K.; Bolduan, R.W.; Patel, M.R.; Martinsen, B.J.; Azemi, T.; Giugliano, G.; Resar, J.R.; Mehran, R.; Cohen, D.J.; Popma, J.J.; et al. Impact of calcification on percutaneous coronary intervention: MACE-Trial 1-year results. Catheter. Cardiovasc. Interv. 2019, 94, 187–194. [Google Scholar] [CrossRef] [PubMed]
- Copeland-Halperin, R.S.; Baber, U.; Aquino, M.; Rajamanickam, A.; Roy, S.; Hasan, C.; Barman, N.; Kovacic, J.C.; Moreno, P.; Krishnan, P.; et al. Prevalence, correlates, and impact of coronary calcification on adverse events following PCI with newer-generation DES: Findings from a large multiethnic registry. Catheter. Cardiovasc. Interv. 2018, 91, 859–866. [Google Scholar] [CrossRef]
- Généreux, P.; Madhavan, M.V.; Mintz, G.S.; Maehara, A.; Palmerini, T.; Lasalle, L.; Xu, K.; McAndrew, T.; Kirtane, A.; Lansky, A.J.; et al. Ischemic outcomes after coronary intervention of calcified vessels in acute coronary syndromes: Pooled analysis from the HORIZONS-AMI (Harmonizing Outcomes with Revascularization and Stents in Acute Myocardial Infarction) and ACUITY (Acute Catheterization and Urgent Intervention Triage Strategy) trials. J. Am. Coll. Cardiol. 2014, 63, 1845–1854. [Google Scholar] [CrossRef] [Green Version]
- Wang, X.; Matsumura, M.; Mintz, G.S.; Lee, T.; Zhang, W.; Cao, Y.; Fujino, A.; Lin, Y.; Usui, E.; Kanaji, Y.; et al. In Vivo Calcium Detection by Comparing Optical Coherence Tomography, Intravascular Ultrasound, and Angiography. JACC Cardiovasc. Imaging 2017, 10, 869–879. [Google Scholar] [CrossRef]
- Zhou, J.; Liew, D.; Duffy, S.J.; Shaw, J.; Walton, A.; Chan, W.; Gerber, R.; Stub, D. Intravascular Ultrasound Versus Angiography-Guided Drug-Eluting Stent Implantation: A Health Economic Analysis. Circ. Cardiovasc. Qual. Outcomes 2021, 14, E006789. [Google Scholar] [CrossRef]
- Mehanna, E.; Dawn Abbott, J.; Bezerra, H.G. Optimizing percutaneous coronary intervention in calcified lesions: Insights from optical coherence tomography of atherectomy. Circ. Cardiovasc. Interv. 2018, 11, e006813. [Google Scholar] [CrossRef] [PubMed]
- Mintz, G.S. Intravascular Imaging of Coronary Calcification and its Clinical Implications. JACC Cardiovasc. Imaging 2015, 8, 461–471. [Google Scholar] [CrossRef] [PubMed]
- Fujino, A.; Mintz, G.S.; Matsumura, M.; Lee, T.; Kim, S.Y.; Hoshino, M.; Usui, E.; Yonetsu, T.; Haag, E.S.; Shlofmitz, R.A.; et al. A new optical coherence tomography-based calcium scoring system to predict stent underexpansion. EuroIntervention 2018, 13, e2182–e2189. [Google Scholar] [CrossRef]
- Zhang, M.; Matsumura, M.; Usui, E.; Noguchi, M.; Fujimura, T.; Fall, K.N.; Zhang, Z.; Nazif, T.M.; Parikh, S.A.; Rabbani, L.R.E.; et al. Intravascular Ultrasound-Derived Calcium Score to Predict Stent Expansion in Severely Calcified Lesions. Circ. Cardiovasc. Interv. 2021, 14, e010296. [Google Scholar] [CrossRef] [PubMed]
- Kereiakes, D.J.; Hill, J.M.; Shlofmitz, R.A.; Klein, A.J.; Riley, R.F.; Price, M.J.; Herrmann, H.C.; Bachinsky, W.; Waksman, R.; Stone, G.W. Intravascular Lithotripsy for Treatment of Severely Calcified Coronary Lesions: 1-Year Results from the Disrupt CAD III Study. J. Soc. Cardiovasc. Angiogr. Interv. 2022, 1, 100001. [Google Scholar] [CrossRef]
- Aksoy, A.; Salazar, C.; Becher, M.U.; Tiyerili, V.; Weber, M.; Jansen, F.; Sedaghat, A.; Zimmer, S.; Leick, J.; Grube, E.; et al. Intravascular Lithotripsy in Calcified Coronary Lesions: A Prospective, Observational, Multicenter Registry. Circ. Cardiovasc. Interv. 2019, 12, e008154. [Google Scholar] [CrossRef]
- Galougahi, K.; Shlofmitz, E.; Jeremias, A.; Gogia, S.; Kirtane, A.; Hill, J.; Karmpaliotis, D.; Mintz, G.; Meahara, A.; Stone, G.; et al. Therapeutic Approach to Calcified Coronary Lesions: Disruptive Technologies. Curr. Cardiol. Rep. 2021, 23, 33. [Google Scholar] [CrossRef]
- Choi, K.H.; Song, Y.B.; Lee, J.M.; Lee, S.Y.; Park, T.K.; Yang, J.H.; Choi, J.H.; Choi, S.H.; Gwon, H.C.; Hahn, J.Y. Impact of Intravascular Ultrasound-Guided Percutaneous Coronary Intervention on Long-Term Clinical Outcomes in Patients Undergoing Complex Procedures. JACC Cardiovasc. Interv. 2019, 12, 607–620. [Google Scholar] [CrossRef]
- Kwon, O.; Lee, P.H.; Lee, S.W.; Brilakis, E.S.; Lee, J.Y.; Yoon, Y.H.; Lee, K.; Park, H.; Kang, S.J.; Kim, Y.H.; et al. Clinical outcomes of post-stent intravascular ultrasound examination for chronic total occlusion intervention with drug-eluting stents. EuroIntervention 2021, 17, E639–E646. [Google Scholar] [CrossRef]
- Ahn, J.; Kang, S.; Yoon, S.; Park, H.; Kang, S.; Lee, Y.; Lee, S.; Kim, Y.; Lee, C.; Park, S.; et al. Meta-analysis of outcomes after intravascular ultrasound-guided versus angiography-guided drug-eluting stent implantation in 26,503 patients enrolled in three randomized trials and 14 observational studies. Am. J. Cardiol. 2014, 113, 1338–1347. [Google Scholar] [CrossRef]
- Gao, X.F.; Ge, Z.; Kong, X.Q.; Kan, J.; Han, L.; Lu, S.; Tian, N.L.; Lin, S.; Lu, Q.H.; Wang, X.Y.; et al. 3-Year Outcomes of the ULTIMATE Trial Comparing Intravascular Ultrasound Versus Angiography-Guided Drug-Eluting Stent Implantation. JACC Cardiovasc. Interv. 2021, 14, 247–257. [Google Scholar] [CrossRef]
- Zhang, J.; Gao, X.; Kan, J.; Ge, Z.; Han, L.; Lu, S.; Tian, N.; Lin, S.; Lu, Q.; Wu, X.; et al. Intravascular Ultrasound Versus Angiography-Guided Drug-Eluting Stent Implantation: The ULTIMATE Trial. J. Am. Coll. Cardiol. 2018, 72, 3126–3137. [Google Scholar] [CrossRef]
- Hong, S.J.; Kim, B.K.; Shin, D.H.; Nam, C.M.; Kim, J.S.; Ko, Y.G.; Choi, D.; Kang, T.S.; Kang, W.C.; Her, A.Y.; et al. Effect of intravascular ultrasound-guided vs angiography-guided everolimus-eluting stent implantation: The IVUS-XPL randomized clinical trial. JAMA J. Am. Med. Assoc. 2015, 314, 2155–2163. [Google Scholar] [CrossRef]
- Lee, Y.J.; Zhang, J.J.; Mintz, G.S.; Hong, S.J.; Ahn, C.M.; Kim, J.S.; Kim, B.K.; Ko, Y.G.; Choi, D.; Jang, Y.; et al. Impact of Intravascular Ultrasound-Guided Optimal Stent Expansion on 3-Year Hard Clinical Outcomes. Circ. Cardiovasc. Interv. 2021, 14, e011124. [Google Scholar] [CrossRef]
- Fujimura, T.; Matsumura, M.; Witzenbichler, B.; Metzger, D.C.; Rinaldi, M.J.; Duffy, P.L.; Weisz, G.; Stuckey, T.D.; Ali, Z.A.; Zhou, Z.; et al. Stent Expansion Indexes to Predict Clinical Outcomes: An IVUS Substudy From ADAPT-DES. JACC Cardiovasc. Interv. 2021, 14, 1639–1650. [Google Scholar] [CrossRef]
- Neumann, F.J.; Sousa-Uva, M.; Ahlsson, A.; Alfonso, F.; Banning, A.P.; Benedetto, U.; Byrne, R.A.; Collet, J.P.; Falk, V.; Head, S.J.; et al. 2018 ESC/EACTS Guidelines on myocardial revascularization. Eur. Heart J. 2019, 40, 87–165. [Google Scholar] [CrossRef] [Green Version]
- Lawton, J.S.; Tamis-Holland, J.E.; Bangalore, S.; Bates, E.R.; Beckie, T.M.; Bischoff, J.M.; Bittl, J.A.; Cohen, M.G.; DiMaio, J.M.; Don, C.W.; et al. 2021 ACC/AHA/SCAI Guideline for Coronary Artery Revascularization: A Report of the American College of Cardiology/American Heart Association Joint Committee on Clinical Practice Guidelines. J. Am. Coll. Cardiol. 2022, 79, e21–e129. [Google Scholar] [CrossRef]
- Räber, L.; Mintz, G.S.; Koskinas, K.C.; Johnson, T.W.; Holm, N.R.; Onuma, Y.; Radu, M.D.; Joner, M.; Yu, B.; Jia, H.; et al. Clinical use of intracoronary imaging. Part 1: Guidance and optimization of coronary interventions. An expert consensus document of the European Association of Percutaneous Cardiovascular Interventions. EuroIntervention 2018, 14, 656–677. [Google Scholar] [CrossRef]
- Saito, Y.; Kobayashi, Y.; Fujii, K.; Sonoda, S.; Tsujita, K.; Hibi, K.; Morino, Y.; Okura, H.; Ikari, Y.; Honye, J. Clinical expert consensus document on standards for measurements and assessment of intravascular ultrasound from the Japanese Association of Cardiovascular Intervention and Therapeutics. Cardiovasc. Interv. Ther. 2020, 35, 1–12. [Google Scholar] [CrossRef]
- Mintz, G.S.; Nissen, S.E.; Co-Chairs, W.D.; Anderson, S.R.; Bailey, R.; Erbel, F.; Fitzgerald, P.J.; Pinto, F.J.; Rosenfield, K.; Siegel, R.J.; et al. American College of Cardiology Clinical Expert Consensus Document on Standards for Acquisition, Measurement and Reporting of Intravascular Ultrasound Studies (IVUS) A Report of the American College of Cardiology Task Force on Clinical Expert Consensus Documents Developed in Collaboration with the European Society of Cardiology Endorsed by the Society of Cardiac Angiography and Interventions Writing Committee Members Task Force Members. J. Am. Coll. Cardiol. 2001, 37, 1478–1492. [Google Scholar]
- Suzuki, N.; Asano, T.; Nakazawa, G.; Aoki, J.; Tanabe, K.; Hibi, K.; Ikari, Y.; Kozuma, K. Clinical expert consensus document on quantitative coronary angiography from the Japanese Association of Cardiovascular Intervention and Therapeutics. Cardiovasc. Interv. Ther. 2020, 35, 105–116. [Google Scholar] [CrossRef] [PubMed] [Green Version]
- Thygesen, K.; Alpert, J.S.; Jaffe, A.S.; Chaitman, B.R.; Bax, J.J.; Morrow, D.A.; White, H.D.; Mickley, H.; Crea, F.; Van De Werf, F.; et al. Fourth universal definition of myocardial infarction (2018). Eur. Heart J. 2019, 40, 237–269. [Google Scholar] [CrossRef] [PubMed] [Green Version]
- Sonoda, S.; Hibi, K.; Okura, H.; Fujii, K.; Honda, Y.; Kobayashi, Y. Current clinical use of intravascular ultrasound imaging to guide percutaneous coronary interventions. Cardiovasc. Interv. Ther. 2020, 35, 30–36. [Google Scholar] [CrossRef] [PubMed]
- Hannan, E.L.; Zhong, Y.; Reddy, P.; Jacobs, A.K.; Ling, F.S.K.; King, S.B.; Berger, P.B.; Venditti, F.J.; Walford, G.; Tamis-Holland, J. Percutaneous Coronary Intervention with and Without Intravascular Ultrasound for Patients with Complex Lesions: Utilization, Mortality, and Target Vessel Revascularization. Circ. Cardiovasc. Interv. 2022, 15, E011687. [Google Scholar] [CrossRef]
- Lee, J.M.; Choi, K.H.; Song, Y.B.; Lee, J.-Y.; Lee, S.-J.; Lee, S.Y.; Kim, S.M.; Yun, K.H.; Cho, J.Y.; Kim, C.J.; et al. Intravascular Imaging–Guided or Angiography-Guided Complex PCI. N. Engl. J. Med. 2023, 388, 1668–1679. [Google Scholar] [CrossRef]
- Hemetsberger, R.; Abdelghani, M.; Toelg, R.; Mankerious, N.; Allali, A.; Garcia-Garcia, H.M.; Windecker, S.; Lefèvre, T.; Saito, S.; Slagboom, T.; et al. Impact of coronary calcification on clinical outcomes after implantation of newer-generation drug-eluting stents. J. Am. Heart Assoc. 2021, 10, e019815. [Google Scholar] [CrossRef]


| Non/Mild Calcification (n = 151) | Moderate/Severe Calcification (n = 92) | p | Matched Non/Mild Calcification (n = 71) | Matched Moderate/Severe Calcification (n = 71) | p | |
|---|---|---|---|---|---|---|
| Baseline Characteristics | ||||||
| Age (years) | 63.60 ± 9.75 | 67.71 ± 9.77 | 0.002 | 66.48 ± 10.14 | 66.96 ± 9.05 | 0.767 |
| Age > 65 years old | 40.40% (61) | 61.96% (57) | 0.001 | 49.30% (35) | 59.15% (42) | 0.238 |
| Male | 82.12% (124) | 65.22% (60) | 0.003 | 76.06% (54) | 73.24% (52) | 0.700 |
| BMI (g/m2) | 24.96 ± 3.19 | 25.25 ± 3.11 | 0.498 | 24.78 ± 3.44 | 25.23 ± 2.87 | 0.393 |
| Hypertension | 69.54% (105) | 80.43% (74) | 0.061 | 76.06% (54) | 76.06% (54) | 1 |
| Diabetes Mellitus | 24.50% (37) | 53.26% (49) | 0.001 | 29.58% (21) | 45.07% (32) | 0.056 |
| Current Smoking | 29.14% (44) | 14.13% (13) | 0.035 | 18.31% (13) | 16.90% (12) | 0.714 |
| Chronic Kidney Disease | 1.32% (2) | 8.70% (8) | 0.005 | 2.82% (2) | 4.23% (3) | 0.649 |
| Clinical Presentation | 0.176 | 0.647 | ||||
| STEMI NSTEMI UAP Non-ACS | 1.99% (3) 11.92% (18) 54.30% (82) 31.79% (48) | 2.17% (2) 20.65% (19) 55.43% (51) 21.74% (20) | 0.921 0.066 0.864 0.091 | 4.23% (3) 14.08% (10) 50.70% (36) 30.99% (22) | 2.82% (2) 15.49% (11) 59.15% (42) 22.54% (16) | 0.649 0.813 0.312 0.255 |
| Multi-lesions PCI | 7.28% (11) | 10.87% (10) | 0.335 | 5.63% (4) | 8.45% (6) | 0.512 |
| Family history of CAD | 5.96% (9) | 2.17% (2) | 0.221 | 2.82% (2) | 2.82% (2) | 0.508 |
| Previous PCI | 5.96% (9) | 13.04% (12) | 0.057 | 4.23% (3) | 8.45% (6) | 0.301 |
| TIA | 8.61% (13) | 9.78% (9) | 0.757 | 7.04% (5) | 8.45% (6) | 0.754 |
| Laboratory Findings | ||||||
| Hemoglobin (103/μL) | 14.10 (13.10,15.00) | 13.15 (12.00,14.60) | <0.001 | 13.80 (12.70,14.70) | 13.30 (12.00,14.60) | 0.257 |
| Creatinine (mg/dL) | 0.88 (0.74,1.01) | 0.88 (0.73,1.17) | 0.295 | 0.87 (0.71,1.06) | 0.87 (0.73,1.17) | 0.485 |
| EGFR (mL/min/m2) | 85.80 ± 22.55 | 76.66 ± 31.38 | 0.016 | 82.95 ± 25.68 | 79.35 ± 28.86 | 0.434 |
| EGFR < 60 (mL/min/m2) | 7.95% (12) | 25.00% (23) | <0.001 | 11.27% (8) | 22.54% (16) | 0.073 |
| Dyslipidemia * | 58.28% (88) | 71.74% (66) | 0.035 | 66.20% (47) | 71.83% (51) | 0.468 |
| LVEF (%) | 61.00 (58.00,66.00) | 58.00 (55.00,62.00) | 0.001 | 60.00 (57.00,64.00) | 58.00 (56.00,63.00) | 0.108 |
| HbA1C (%) | 5.80 (5.40,6.40) | 6.30 (5.78,7.50) | <0.001 | 5.80 (5.50,6.30) | 6.15 (5.70,7.43) | 0.011 |
| Pre-PCI Medications | ||||||
| Aspirin Betablocker RAS Statin P2Y12 | 22.52% (34) 19.21% (29) 36.42% (55) 38.41% (58) 84.11% (127) | 29.35% (27) 26.09% (24) 52.17% (48) 59.78% (55) 69.57% (64) | 0.234 0.187 0.020 0.001 0.007 | 26.76% (19) 22.54% (16) 38.03% (27) 49.30% (35) 81.69% (58) | 30.99% (22) 19.72% (14) 52.11% (37) 59.15% (42) 74.65% (53) | 0.579 0.565 0.127 0.238 0.310 |
| Non/Mild Calcification (n = 171) | Moderate/Severe Calcification (n = 94) | p | Matched Non/Mild Calcification (n = 81) | Matched Moderate/Severe Calcification (n = 72) | p | |
|---|---|---|---|---|---|---|
| Artery | 0.879 | 0.616 | ||||
| LAD | 68.42% (117) | 70.21% (66) | 0.763 | 67.90% (55) | 75.00% (54) | 0.333 |
| LCX | 11.11% (19) | 11.70% (11) | 0.884 | 9.88% (8) | 8.33% (6) | 0.741 |
| RCA | 19.30% (33) | 18.09% (17) | 0.809 | 22.22% (18) | 16.67% (12) | 0.388 |
| Left Main | 0.58% (1) | 0% (0) | 0.458 | 0% (0) | 0% (0) | N/A |
| Ramus | 0.58% (1) | 0% (0) | 0.458 | 0% (0) | 0% (0) | N/A |
| AHA/ACC Classification | 0.010 | 0.374 | ||||
| A | 1.17% (2) | 0% (0) | 0.293 | 1.23% (1) | 0% (0) | 0.344 |
| B1 | 14.04% (24) | 5.32% (5) | 0.030 | 12.35% (10) | 5.56% (4) | 0.146 |
| B2 | 49.12% (84) | 40.43% (38) | 0.174 | 41.98% (34) | 44.44% (32) | 0.758 |
| C | 35.67% (61) | 54.26% (51) | 0.003 | 44.44% (36) | 50.0% (36) | 0.492 |
| TIMI Grade | 0.091 | 0.398 | ||||
| TIMI-0 | 4.68% (8) | 2.13% (2) | 0.297 | 4.94% (4) | 2.78% (2) | 0.492 |
| TIMI-1 | 11.11% (19) | 10.64% (10) | 0.906 | 7.41% (6) | 12.50% (9) | 0.290 |
| TIMI-2 | 21.05% (36) | 10.64% (10) | 0.032 | 18.52% (15) | 11.11% (8) | 0.201 |
| TIMI-3 | 63.16% (108) | 76.60% (72) | 0.025 | 69.14% (56) | 73.61% (53) | 0.542 |
| Total Occlusion | 4.09% (7) | 6.38% (6) | 0.409 | 4.94% (4) | 8.33% (6) | 0.396 |
| Chronic total occlusion | 3.51% (6) | 5.32% (5) | 0.480 | 3.70% (3) | 6.94% (5) | 0.369 |
| Ostium Lesion | 1.75% (3) | 2.13% (2) | 0.831 | 2.47% (2) | 2.78% (2) | 0.905 |
| QCA Analysis | ||||||
| Lesion Diameter (mm) | 1.03 ± 0.38 | 0.95 ± 0.37 | 0.094 | 0.97 ± 0.37 | 0.94 ± 0.38 | 0.611 |
| Lesion Reference Diameter (mm) | 2.94 ± 0.59 | 2.67 ± 0.63 | 0.001 | 2.91 ± 0.58 | 2.70 ± 0.63 | 0.049 |
| Diameter Stenosis (%) | 66.23 ± 12.76 | 66.85 ± 14.02 | 0.718 | 67.66 ± 13.96 | 68.17 ± 14.86 | 0.828 |
| Lesion Area (mm2) | 0.82 (0.43,1.24) | 0.70 (0.35,1.13) | 0.157 | 0.74 (0.38,1.11) | 0.62 (0.32,1.16) | 0.603 |
| Lesion Reference Area (mm2) | 6.45 (5.20,8.49) | 5.50 (3.98,7.23) | 0.001 | 6.27 (5.20,7.37) | 5.70 (3.88,7.26) | 0.077 |
| Area Stenosis (%) | 87.98 ± 7.76 | 87.07 ± 7.97 | 0.931 | 87.61 ± 8.20 | 87.69 ± 8.28 | 0.956 |
| Lesion Length (mm) | 23.95 ± 8.56 | 27.30 ± 9.94 | 0.005 | 24.83 ± 9.12 | 27.16 ± 9.18 | 0.132 |
| Proximal Mean Diameter (mm) | 3.28 ± 0.56 | 3.04 ± 0.60 | 0.002 | 3.25 ± 0.54 | 3.08 ± 0.61 | 0.072 |
| Lesion Mean Diameter (mm) | 2.30 ± 0.47 | 2.10 ± 0.44 | 0.001 | 2.24 ± 0.43 | 2.14 ± 0.44 | 0.160 |
| Distal Mean Diameter (mm) | 2.92 ± 0.64 | 2.75 ± 0.69 | 0.047 | 2.89 ± 0.64 | 2.76 ± 0.72 | 0.257 |
| Proximal Mean Area (mm2) | 3.27 ± 0.65 | 3.10 ± 0.64 | 0.049 | 3.28 ± 0.58 | 3.15 ± 0.66 | 0.212 |
| Lesion Mean Area (mm2) | 2.31 ± 0.49 | 2.12 ± 0.45 | 0.003 | 2.27 ± 0.45 | 2.16 ± 0.45 | 0.178 |
| Distal Mean Area (mm2) | 2.95 ± 0.77 | 2.84 ± 0.84 | 0.288 | 2.99 ± 0.89 | 2.89 ± 0.90 | 0.503 |
| Plaque Symmetry | 0.70 (0.49,0.87) | 0.67 (0.56,0.82) | 0.856 | 0.76 (0.50,0.87) | 0.65 (0.56,0.81) | 0.211 |
| Plaque Area (mm2) | 13.44 (9.95,18.75) | 13.53 (10.25,18.65) | 0.766 | 13.79 (9.77,20.15) | 12.97 (10.35,18.14) | 0.592 |
| Non/Mild Calcification (n = 171) | Moderate/ Severe Calcification (n = 94) | p | Matched Non/Mild Calcification (n = 81) | Matched Moderate/Severe Calcification (n = 72) | p | |
|---|---|---|---|---|---|---|
| Vascular Access | 0.002 | 0.019 | ||||
| Radial | 85.38% (146) | 69.15% (65) | 85.19% (69) | 69.44% (50) | ||
| Femoral | 14.62% (25) | 30.85% (29) | 14.81% (12) | 30.56% (22) | ||
| Pre-dilation | 97.08% (166) | 97.87% (92) | 0.699 | 98.77% (80) | 98.61% (71) | 0.933 |
| Pre-Stent-Balloon type | 0.103 | 0.269 | ||||
| Semi-compliant balloon | 94.74% (162) | 90.43% (85) | 0.182 | 97.53% (79) | 90.28% (65) | 0.057 |
| Non-compliant balloon | 2.34% (4) | 3.19% (3) | 0.679 | 1.23% (1) | 2.78% (2) | 0.492 |
| Stent-balloon | 0% (0) | 1.06% (1) | 0.177 | 0% (0) | 1.39% (1) | 0.287 |
| Scoring balloon | 0% (0) | 3.19% (3) | 0.019 | 0% (0) | 4.17% (3) | 0.064 |
| Pre-dilation balloon diameter size (mm) | 2.57 ± 0.37 | 2.64 ± 0.38 | 0.208 | 2.58 ± 0.35 | 2.62 ± 0.39 | 0.457 |
| Pre-dilation balloon length (mm) | 17.51 ± 2.53 | 16.61 ± 2.68 | 0.008 | 17.24 ± 2.52 | 17.01 ± 2.88 | 0.612 |
| Pre-dilation balloon maximum pressure (atm) | 11.62 ± 3.03 | 12.48 ± 2.93 | 0.029 | 11.96 ± 3.12 | 12.28 ± 3.11 | 0.531 |
| Pre-dilation balloon maximum diameter (mm) | 2.68 ± 0.37 | 2.76 ± 0.38 | 0.101 | 2.69 ± 0.32 | 2.74 ± 0.39 | 0.420 |
| Plaque modification | 0% (0) | 4.26% (4) | 0.007 | 0% (0) | 4.17% (3) | 0.064 |
| Rotablator | 0% (0) | 1.06% (1) | 0.177 | 0% (0) | 0% (0) | N/A |
| Scoring balloon | 0% (0) | 3.19% (3) | 0.019 | 0% (0) | 4.17% (3) | 0.064 |
| Stent diameter size (mm) * | 3.35 ± 0.51 | 3.21 ± 0.50 | 0.034 | 3.28 ± 0.47 | 3.25 ± 0.53 | 0.673 |
| Stent length size (mm) * | 26.00 (22.00,34.00) | 30.00 (22.00,34.00) | 0.062 | 26.00 (22.00,34.00) | 30.00 (26.00,37.00) | 0.113 |
| Number of stents per lesion | 1.07 ± 0.26 | 1.16 ± 0.37 | 0.038 | 1.09 ± 0.28 | 1.14 ± 0.35 | 0.306 |
| Total stent length (mm) | 26.00 (22.00,34.00) | 30.00 (22.00,38.00) | 0.010 | 26.00 (22.00,34.00) | 30.00 (26.00,38.00) | 0.062 |
| Stent-balloon maximum pressure at deployment (atm) * | 13.99 ± 2.84 | 13.18 ± 2.58 | 0.022 | 13.62 ± 2.85 | 13.35 ± 2.77 | 0.554 |
| Stent maximum diameter at deployment (mm) * | 3.42 ± 0.52 | 3.24 ± 0.52 | 0.008 | 3.34 ± 0.47 | 3.28 ± 0.56 | 0.487 |
| Post-dilation | 62.57% (107) | 77.66% (73) | 0.012 | 65.43% (53) | 80.56% (58) | 0.036 |
| Post-dilation balloon type | 0.072 | 0.151 | ||||
| Semi-compliant balloon | 1.75% (3) | 3.19% (3) | 0.452 | 1.23% (1) | 1.39% (1) | 0.933 |
| Non-compliant balloon | 57.89% (99) | 72.34% (68) | 0.020 | 64.20% (52) | 77.78% (56) | 0.066 |
| Stent-balloon | 2.92% (5) | 2.13% (2) | 0.699 | 0% (0) | 1.39% (1) | 0.287 |
| Post-dilation balloon diameter size (mm) | 3.61 ± 0.53 | 3.39 ± 0.44 | 0.005 | 3.58 ± 0.51 | 3.43 ± 0.44 | 0.100 |
| Post-dilation balloon length (mm) | 12.32 ± 3.92 | 12.84 ± 3.76 | 0.377 | 11.42 ± 3.55 | 12.83 ± 3.82 | 0.047 |
| Post-dilation balloon maximum pressure (atm) | 16.70 ± 3.67 | 16.38 ± 3.31 | 0.554 | 16.72 ± 4.00 | 16.34 ± 2.93 | 0.575 |
| Post-dilation balloon maximum diameter (mm) | 3.71 ± 0.52 | 3.48 ± 0.44 | 0.003 | 3.69 ± 0.50 | 3.52 ± 0.45 | 0.072 |
| Non/Mild Calcification (n = 171) | Moderate/Severe Calcification (n = 94) | p | Matched Non/Mild Calcification (n = 81) | Matched Moderate/Severe Calcification (n = 72) | p | |
|---|---|---|---|---|---|---|
| Pre-PCI IVUS | ||||||
| Minimum luminal area site | ||||||
| Luminal Area (mm2) | 2.67 ± 0.90 | 2.44 ± 0.67 | 0.019 | 2.69 ± 0.91 | 2.49 ± 0.69 | 0.120 |
| Vessel Area (mm2) | 13.56 ± 4.92 | 13.74 ± 4.59 | 0.772 | 13.94 ± 4.65 | 14.23 ± 4.80 | 0.702 |
| Plaque Burden (%) | 79.83 (74.57,83.41) | 81.34 (78.45,85.29) | 0.006 | 80.27 (73.67,84.00) | 81.43 (78.40,85.59) | 0.041 |
| Remodeling Index | 0.86 ± 0.23 | 0.89 ± 0.21 | 0.294 | 0.88 ± 0.22 | 0.90 ± 0.21 | 0.565 |
| Lesion Length (mm) | 26.76 ± 9.73 | 30.88 ± 11.09 | 0.002 | 27.88 ± 9.44 | 31.56 ± 11.27 | 0.029 |
| Proximal reference site Luminal Area (mm2) Vessel Area (mm2) Plaque Burden (%) | 11.82 ± 4.53 18.75 ± 5.7 36.98 ± 12.40 | 10.41 ± 4.23 18.76 ± 5.35 44.78 ± 12.98 | 0.014 0.985 0.001 | 11.73 ± 4.68 19.23 ± 6.19 38.86 ± 12.82 | 10.85 ± 4.54 19.49 ± 5.29 45.15 ± 13.47 | 0.244 0.780 0.004 |
| Distal reference site Luminal Are (mm2) Vessel Area (mm2) Plaque burden (%) | 8.21 (6.27,11.03) 13.20 ± 5.70 30.46 ± 10.97 | 7.04 (5.33,10.18) 12.64 ± 5.43 35.05 ± 14.46 | 0.012 0.435 0.004 | 8.15 (6.41,10.62) 13.18 ± 5.42 30.45 ± 11.14 | 7.04 (5.18,10.38) 12.83 ± 5.70 35.89 ± 14.14 | 0.034 0.702 0.009 |
| Mean Reference Luminal Area (mm2) | 10.45 ± 3.88 | 9.19 ± 3.49 | 0.010 | 10.40 ± 3.92 | 9.43 ± 3.71 | 0.119 |
| Volumetric analysis | ||||||
| Mean luminal area (mm3/mm) | 5.89 (4.70,7.68) | 5.04 (4.00,5.96) | <0.001 | 5.82 (4.77,7.27) | 5.16 (4.04,6.26) | 0.028 |
| Mean vessel area (mm3/mm) | 14.98 ± 4.98 | 14.87 ± 4.35 | 0.856 | 14.97 ± 4.47 | 15.39 ± 4.48 | 0.567 |
| Plaque burden (%) | 56.80 ± 8.44 | 63.47 ± 7.28 | <0.001 | 57.56 ± 9.28 | 63.91 ± 7.25 | <0.001 |
| Maximum calcium arc (o) | 86.70 (43.90,139.20) | 266.80 (226.28,360.00) | <0.001 | 96.30 (67.20,148.05) | 263.95 (222.58,360.00) | <0.001 |
| Calcium length (mm) | 6.10 (2.10,13.10) | 20.30 (14.23,26.55) | <0.001 | 7.50 (3.30,12.75) | 21.65 (15.20,26.50) | <0.001 |
| Calcium Index * | 10.06 ± 11.22 | 56.63 ± 24.24 | <0.001 | 11.61 ± 12.23 | 55.90 ± 23.34 | <0.001 |
| Superficial Calcium | 80.12% (137) | 100.0% (94) | <0.001 | 88.89% (72) | 100.0% (72) | 0.004 |
| Deep Calcium | 7.60% (13) | 26.60% (25) | <0.001 | 7.41% (6) | 25.00% (18) | 0.003 |
| Calcium nodule | 6.43% (11) | 23.40% (22) | <0.001 | 9.88% (8) | 25.00% (18) | 0.013 |
| Plaque rupture | 15.20% (26) | 39.36% (37) | <0.001 | 18.52% (15) | 45.83% (33) | <0.001 |
| Attenuate Plaque | 71.35% (122) | 79.79% (75) | 0.132 | 74.07% (60) | 79.17% (57) | 0.459 |
| POST-PCI IVUS | ||||||
| Minimum stent area site | ||||||
| Minimum stent area (mm2) | 6.68 ± 2.34 | 5.71 ± 2.04 | 0.001 | 6.42 ± 2.10 | 5.89 ± 2.15 | 0.126 |
| Vessel area at MSA (mm2) | 15.02 ± 5.07 | 14.71 ± 5.06 | 0.643 | 14.83 ± 4.91 | 14.95 ± 5.30 | 0.891 |
| Maximum stent diameter (mm) | 3.17 ± 0.56 | 2.96 ± 0.54 | 0.04 | 3.11 ± 0.51 | 3.02 ± 0.56 | 0.286 |
| Minimum stent diameter (mm) | 2.58 ± 0.46 | 2.36 ± 0.44 | 0.001 | 2.54 ± 0.43 | 2.39 ± 0.44 | 0.028 |
| Stent asymmetry | 0.17 (0.12,0.23) | 0.17 (0.13,0.25) | 0.248 | 0.17 (0.12,0.22) | 0.19 (0.14,0.26) | 0.060 |
| Stent eccentricity | 0.83 (0.77,0.88) | 0.83 (0.75,0.87) | 0.248 | 0.83 (0.78,0.88) | 0.81 (0.74,0.86) | 0.060 |
| Mean stent area (mm2) | 8.16 (6.63,11.07) | 7.39 (5.87,9.85) | 0.055 | 7.70 (6.47,11.21) | 8.22 (5.94,10.33) | 0.642 |
| Conventional stent expansion | 65.91 ± 14.71 | 64.38 ± 13.86 | 0.127 | 63.94 ± 13.83 | 65.11 ± 14.19 | 0.607 |
| MSA/MVA at MSA site (%) | 45.42 ± 9.07 | 38.83 ± 8.89 | <0.001 | 44.56 ± 9.44 | 40.41 ± 8.67 | 0.006 |
| IVUS-XPL * trial stent expansion criteria | 11.70% (20) | 11.70% (11) | 0.999 | 6.17% (5) | 13.89% (10) | 0.109 |
| ULTIMATE * trial stent expansion criteria | 74.27% (127) | 57.45% (54) | 0.005 | 70.37% (57) | 63.89% (46) | 0.394 |
| MSA > 5.5 mm2 | 66.08% (113) | 41.49% (39) | 0.006 | 65.43% (53) | 45.83% (33) | 0.015 |
| MSA/Average reference lumen area > 80% | 17.54% (30) | 13.83% (13) | 0.433 | 13.58% (11) | 15.28% (11) | 0.765 |
| Stent malapposition | 24.56% (42) | 45.74% (43) | <0.001 | 24.69% (20) | 52.78% (38) | <0.001 |
| Major Stent Malapposition | 12.28% (21) | 18.09% (17) | 0.197 | 11.11% (9) | 22.22% (16) | 0.064 |
| Minor Stent Malapposition | 12.28% (21) | 27.66% (26) | 0.002 | 13.58% (11) | 30.56% (22) | 0.011 |
| Tissue protrusion | 1.75% (3) | 1.06% (1) | 0.659 | 2.47% (2) | 1.39% (1) | 0.630 |
| Stent Edge Dissection | 1.17% (2) | 1.06% (1) | 0.938 | 1.23% (1) | 1.39% (1) | 0.933 |
| Non/Mild Calcification (n = 151) | Moderate/Severe Calcification (n = 92) | p | Matched Non/Mild Calcification (n = 71) | Matched Moderate/Severe Calcification (n = 71) | p | |
|---|---|---|---|---|---|---|
| MACE | 1.99% (3) | 1.09% (1) | 0.594 | 0% (0) | 1.41% (1) | 0.317 |
| Cardiac Death | 0.66% (1) | 0% (0) | 0.435 | 0% (0) | 0% (0) | N/A |
| MI | 0% (0) | 0% (0) | N/A | 0% (0) | 0% (0) | N/A |
| TLR | 1.32% (2) | 1.09% (1) | 0.870 | 0% (0) | 1.41% (1) | 0.317 |
| POCE | 5.96% (9) | 3.26% (3) | 0.303 | 7.04% (5) | 2.82% (2) | 0.244 |
| All-cause Death | 4.64% (7) | 2.17% (2) | 0.276 | 7.04% (5) | 1.41% (1) | 0.092 |
| Stroke | 1.32% (2) | 0% (0) | 0.269 | 1.41% (1) | 0% (0) | 0.317 |
| TVR | 1.32% (2) | 0% (0) | 0.266 | 0% (0) | 0% (0) | N/A |
| OVR | 1.99% (3) | 4.35% (4) | 0.343 | 4.23% (3) | 4.23% (3) | 0.965 |
| CHF | 0.66% (1) | 1.09% (1) | 0.723 | 0% (0) | 1.41% (1) | 0.317 |
| Stent Thrombosis | 0% (0) | 0% (0) | N/A | 0% (0) | 0% (0) | N/A |
Disclaimer/Publisher’s Note: The statements, opinions and data contained in all publications are solely those of the individual author(s) and contributor(s) and not of MDPI and/or the editor(s). MDPI and/or the editor(s) disclaim responsibility for any injury to people or property resulting from any ideas, methods, instructions or products referred to in the content. |
© 2023 by the authors. Licensee MDPI, Basel, Switzerland. This article is an open access article distributed under the terms and conditions of the Creative Commons Attribution (CC BY) license (https://creativecommons.org/licenses/by/4.0/).
Share and Cite
Doan, K.-H.; Liu, T.-L.; Yun, W.-S.; Kim, Y.-S.; Yun, K.H.; Oh, S.K.; Park, J.-P.; Rhew, J.Y.; Lee, S.-R. Intravascular Ultrasound Guided Intervention in Calcified Coronary Lesions Showed Good Clinical Outcomes during One Year Follow-Up. J. Clin. Med. 2023, 12, 4073. https://doi.org/10.3390/jcm12124073
Doan K-H, Liu T-L, Yun W-S, Kim Y-S, Yun KH, Oh SK, Park J-P, Rhew JY, Lee S-R. Intravascular Ultrasound Guided Intervention in Calcified Coronary Lesions Showed Good Clinical Outcomes during One Year Follow-Up. Journal of Clinical Medicine. 2023; 12(12):4073. https://doi.org/10.3390/jcm12124073
Chicago/Turabian StyleDoan, Khanh-Hung, Tai-Li Liu, Won-Sik Yun, Yi-Sik Kim, Kyeong Ho Yun, Seok Kyu Oh, Jong-Pil Park, Jay Young Rhew, and Sang-Rok Lee. 2023. "Intravascular Ultrasound Guided Intervention in Calcified Coronary Lesions Showed Good Clinical Outcomes during One Year Follow-Up" Journal of Clinical Medicine 12, no. 12: 4073. https://doi.org/10.3390/jcm12124073
APA StyleDoan, K.-H., Liu, T.-L., Yun, W.-S., Kim, Y.-S., Yun, K. H., Oh, S. K., Park, J.-P., Rhew, J. Y., & Lee, S.-R. (2023). Intravascular Ultrasound Guided Intervention in Calcified Coronary Lesions Showed Good Clinical Outcomes during One Year Follow-Up. Journal of Clinical Medicine, 12(12), 4073. https://doi.org/10.3390/jcm12124073