
CA 19-9 but Not IGF-1/IGFBP-2 Is a Useful Biomarker for Pancreatic Ductal Adenocarcinoma (PDAC) and Chronic Pancreatitis (CP) Differentiation

 , ,
, ,  and
and 
Abstract
:1. Introduction
2. Material and Methods
3. Results
4. Discussion
Author Contributions
Funding
Institutional Review Board Statement
Informed Consent Statement
Data Availability Statement
Conflicts of Interest
References
- Allemani, C.; Matsuda, T.; Di Carlo, V.; Harewood, R.; Matz, M.; Nikšić, M.; Bonaventure, A.; Valkov, M.; Johnson, C.J.; Estève, J.; et al. Global surveillance of trends in cancer survival 2000–14 (CONCORD-3): Analysis of individual records for 37 513 025 patients diagnosed with one of 18 cancers from 322 population-based registries in 71 countries. Lancet 2018, 391, 1023–1075. [Google Scholar] [CrossRef] [PubMed] [Green Version]
- Liot, S.; Balas, J.; Aubert, A.; Prigent, L.; Mercier-Gouy, P.; Verrier, B.; Bertolino, P.; Hennino, A.; Valcourt, U.; Lambert, E. Stroma Involvement in Pancreatic Ductal Adenocarcinoma: An Overview Focusing on Extracellular Matrix Proteins. Front. Immunol. 2021, 12, 612271. [Google Scholar] [CrossRef] [PubMed]
- Pandol, S.; Edderkaoui, M.; Gukovsky, I.; Lugea, A.; Gukovskaya, A. Desmoplasia of Pancreatic Ductal Adenocarcinoma. Clin. Gastroenterol. Hepatol. 2009, 7, S44–S47. [Google Scholar] [CrossRef] [Green Version]
- Omary, M.B.; Lugea, A.; Lowe, A.W.; Pandol, S.J. The pancreatic stellate cell: A star on the rise in pancreatic diseases. J. Clin. Investig. 2007, 117, 50–59. [Google Scholar] [CrossRef] [PubMed] [Green Version]
- Korc, M. Pancreatic cancer–associated stroma production. Am. J. Surg. 2007, 194, S84–S86. [Google Scholar] [CrossRef] [PubMed] [Green Version]
- Chu, G.C.; Kimmelman, A.C.; Hezel, A.F.; DePinho, R.A. Stromal biology of pancreatic cancer. J. Cell. Biochem. 2007, 101, 887–907. [Google Scholar] [CrossRef]
- Cotterill, A.M.; Holly, J.M.P.; Wass, J.A.H. The regulation of insulin-like growth factor binding protein (IGFBP)-1 during prolonged fasting. Clin. Endocrinol. 1993, 39, 357–362. [Google Scholar] [CrossRef] [PubMed]
- Mullis, P.E.; Patel, M.S.; Brlckell, P.M.; Hindmarsh, P.C.; Brook, C.G.D. Growth characteristics and response to growth hormone therapy in patients with hypochondroplasia: Genetic linkage of the insulin-like growth factor I gene at chromosome 12q23 to the disease in a subgroup of these patients. Clin. Endocrinol. 1991, 34, 265–274. [Google Scholar] [CrossRef] [PubMed]
- Grimberg, A.; DiVall, S.A.; Polychronakos, C.; Allen, D.B.; Cohen, L.E.; Quintos, J.B.; Rossi, W.C.; Feudtner, C.; Murad, M.H.; Drug and Therapeutics Committee and Ethics Committee of the Pediatric Endocrine Society. Guidelines for Growth Hormone and Insulin-Like Growth Factor-I Treatment in Children and Adolescents: Growth Hormone Deficiency, Idiopathic Short Stature, and Primary Insulin-Like Growth Factor-I Deficiency. Horm. Res. Paediatr. 2016, 86, 361–397. [Google Scholar] [CrossRef] [Green Version]
- Gubbi, S.; Quipildor, G.F.; Barzilai, N.; Huffman, D.M.; Milman, S. IGF-1: The Jekyll & Hyde of the aging brain. J. Mol. Endocrinol. 2018, 61, T171. [Google Scholar]
- Pollak, M. Insulin and insulin-like growth factor signalling in neoplasia. Nat. Rev. Cancer 2008, 8, 915–928. [Google Scholar] [CrossRef]
- Clemmons, D.R. The relative roles of growth hormone and IGF-1 in controlling insulin sensitivity. J. Clin. Investig. 2004, 113, 25–27. [Google Scholar] [CrossRef] [PubMed] [Green Version]
- Yakar, S.; Sun, H.; Zhao, H.; Pennisi, P.; Toyoshima, Y.; Setser, J.; Stannard, B.; Scavo, L.; Leroith, D. Metabolic effects of IGF-I deficiency: Lessons from mouse models. Pediatr. Endocrinol. Rev. 2005, 3, 11–19. [Google Scholar] [PubMed]
- Yang, J.; Waldron, R.T.; Su, H.-Y.; Moro, A.; Chang, H.-H.; Eibl, G.; Ferreri, K.; Kandeel, F.R.; Lugea, A.; Li, L.; et al. Insulin promotes proliferation and fibrosing responses in activated pancreatic stellate cells. Am. J. Physiol. Liver Physiol. 2016, 311, G675–G687. [Google Scholar] [CrossRef] [Green Version]
- E Forbes, B. Two years in IGF research. Growth Horm. IGF Res. 2016, 30–31, 70–74. [Google Scholar] [CrossRef] [PubMed]
- Rajah, R.; Katz, L.; Nunn, S.; Solberg, P.; Beers, T.; Cohen, P. Insulin-like growth factor binding protein (IGFBP) proteases: Functional regulators of cell growth. Prog. Growth Factor Res. 1995, 6, 273–284. [Google Scholar] [CrossRef] [PubMed]
- Sun, L.; Zhang, X.; Song, Q.; Liu, L.; Forbes, E.; Tian, W.; Zhang, Z.; Kang, Y.; Wang, H.; Fleming, J.B.; et al. IGFBP2 promotes tumor progression by inducing alternative polarization of macrophages in pancreatic ductal adenocarcinoma through the STAT3 pathway. Cancer Lett. 2020, 500, 132–146. [Google Scholar] [CrossRef]
- Renehan, A.G.; Zwahlen, M.; Minder, C.; O’Dwyer, S.T.; Shalet, S.M.; Egger, M. Insulin-like growth factor (IGF)-I, IGF binding protein-3, and cancer risk: Systematic review and meta-regression analysis. Lancet 2004, 363, 1346–1353. [Google Scholar] [CrossRef]
- Yu, H.; Rohan, T. Role of the Insulin-Like Growth Factor Family in Cancer Development and Progression. Gynecol. Oncol. 2000, 92, 1472–1489. [Google Scholar] [CrossRef]
- Zang, G.; Sandberg, M.; Carlsson, P.O.; Welsh, N.; Jansson, L.; Barbu, A. Activated pancreatic stellate cells can impair pancreatic islet function in mice. Upsala J. Med. Sci. 2015, 120, 169–180. [Google Scholar] [CrossRef] [Green Version]
- Tommelein, J.; De Vlieghere, E.; Verset, L.; Melsens, E.; Leenders, J.; Descamps, B.; De Wever, O. Radiotherapy-activated cancer-associated fibroblasts promote tumor progression through paracrine IGF1R activation. Cancer Res. 2018, 78, 659–670. [Google Scholar] [CrossRef] [Green Version]
- Siddle, K. Signalling by insulin and IGF receptors: Supporting acts and new players. J. Mol. Endocrinol. 2011, 47, R1–R10. [Google Scholar] [CrossRef] [Green Version]
- Hirakawa, T.; Yashiro, M.; Doi, Y.; Kinoshita, H.; Morisaki, T.; Fukuoka, T.; Hirakawa, K. Pancreatic fibroblasts stimulate the motility of pancreatic cancer cells through IGF1/IGF1R signaling under hypoxia. PLoS ONE 2016, 11, e0159912. [Google Scholar] [CrossRef] [Green Version]
- Manoukian, P.; Bijlsma, M.; van Laarhoven, H. The Cellular Origins of Cancer-Associated Fibroblasts and Their Opposing Contributions to Pancreatic Cancer Growth. Front. Cell. Dev. Biol. 2021, 9, 743907. [Google Scholar] [CrossRef] [PubMed]
- Sternlicht, M.D.; Werb, Z. How Matrix Metalloproteinases Regulate Cell Behavior. Annu. Rev. Cell. Dev. Biol. 2001, 17, 463–516. [Google Scholar] [CrossRef] [Green Version]
- Thomas, D.; Radhakrishnan, P. Role of Tumor and Stroma-Derived IGF/IGFBPs in Pancreatic Cancer. Cancers 2020, 12, 1228. [Google Scholar] [CrossRef] [PubMed]
- Tape, C.J.; Ling, S.; Dimitriadi, M.; McMahon, K.M.; Worboys, J.D.; Leong, H.S.; Jørgensen, C. Oncogenic KRAS regulates tumor cell signaling via stromal reciprocation. Cell 2016, 165, 910–920. [Google Scholar] [CrossRef] [PubMed] [Green Version]
- Mutgan, A.C.; Besikcioglu, H.E.; Wang, S.; Friess, H.; Ceyhan, G.O.; Demir, I.E. Insulin/IGF-driven cancer cell-stroma crosstalk as a novel therapeutic target in pancreatic cancer. Mol. Cancer 2018, 17, 66. [Google Scholar] [CrossRef] [Green Version]
- Cai, Q.; Dozmorov, M.; Oh, Y. IGFBP-3/IGFBP-3 Receptor System as an Anti-Tumor and Anti-Metastatic Signaling in Cancer. Cells 2020, 9, 1261. [Google Scholar] [CrossRef] [PubMed]
- Jiang, Q.; Lou, K.; Hou, L.; Lu, Y.; Sun, L.; Tan, S.C.; Low, T.Y.; Kord-Varkaneh, H.; Pang, S. The effect of resistance training on serum insulin-like growth factor 1(IGF-1): A systematic review and meta-analysis. Complement. Ther. Med. 2020, 50, 102360. [Google Scholar] [CrossRef]
- Wlodarczyk, B.; Gasiorowska, A.; Borkowska, A.; Malecka-Panas, E. Evaluation of insulin-like growth factor (IGF-1) and retinol binding protein (RBP-4) levels in patients with newly diagnosed pancreatic adenocarcinoma (PDAC). Pancreatology 2017, 17, 623–628. [Google Scholar] [CrossRef] [PubMed]
- Wlodarczyk, B.; Borkowska, A.; Włodarczyk, P.; Malecka-Panas, E.; Gasiorowska, A. Serum Levels of Insulin-like Growth Factor 1 and Insulin-like Growth Factor–binding Protein 2 as a Novel Biomarker in the Detection of Pancreatic Adenocarcinoma. J. Clin. Gastroenterol. 2019, 54, e83–e88. [Google Scholar] [CrossRef]
- Włodarczyk, B.; Borkowska, A.; Włodarczyk, P.; Małecka-Panas, E.; Gąsiorowska, A. Insulin-like growth factor 1 and insulin-like growth factor binding protein 2 serum levels as potential biomarkers in differential diagnosis between chronic pancreatitis and pancreatic adenocarcinoma in reference to pancreatic diabetes. Gastroenterol. Rev. 2021, 16, 36–42. [Google Scholar] [CrossRef] [PubMed]
- Rhim, A.D.; Oberstein, P.E.; Thomas, D.H.; Mirek, E.T.; Palermo, C.F.; Sastra, S.A.; Stanger, B.Z. Stromal elements act to restrain, rather than support, pancreatic ductal adenocarcinoma. Cancer Cell 2014, 25, 735–747. [Google Scholar] [CrossRef] [PubMed] [Green Version]
- Ceyhan, G.O.; Schäfer, K.-H.; Kerscher, A.G.; Rauch, U.; Demir, I.E.; Kadihasanoglu, M.; Böhm, C.; Müller, M.W.; Büchler, M.W.; Giese, N.A.; et al. Nerve Growth Factor and Artemin Are Paracrine Mediators of Pancreatic Neuropathy in Pancreatic Adenocarcinoma. Ann. Surg. 2010, 251, 923–931. [Google Scholar] [CrossRef] [PubMed]
- Kikuta, K.; Masamune, A.; Hamada, S.; Takikawa, T.; Nakano, E.; Shimosegawa, T. Pancreatic stellate cells reduce insulin expression and induce apoptosis in pancreatic β-cells. Biochem. Biophys. Res. Commun. 2013, 433, 292–297. [Google Scholar] [CrossRef] [PubMed]
- Azzarelli, R.; Hurley, C.; Sznurkowska, M.; Rulands, S.; Hardwick, L.; Gamper, I.; Ali, F.T.; McCracken, L.; Hindley, C.; McDuff, F.; et al. Multi-site Neurogenin3 Phosphorylation Controls Pancreatic Endocrine Differentiation. Dev. Cell. 2017, 41, 274–286. [Google Scholar] [CrossRef]
- Ianza, A.; Sirico, M.; Bernocchi, O.; Generali, D. Role of the IGF-1 Axis in Overcoming Resistance in Breast Cancer. Front. Cell Dev. Biol. 2021, 9, 641449. [Google Scholar] [CrossRef]
- Firth, S.M.; Baxter, R. Cellular Actions of the Insulin-Like Growth Factor Binding Proteins. Endocr. Rev. 2002, 23, 824–854. [Google Scholar] [CrossRef]
- Kendrick, Z.W.; Firpo, M.A.; Repko, R.C.; Scaife, C.L.; Adler, D.G.; Boucher, K.M.; Mulvihill, S.J. Serum IGFBP2 and MSLN as diagnostic and prognostic biomarkers for pancreatic cancer. HPB Oxford 2014, 16, 670–676. [Google Scholar] [CrossRef] [Green Version]
- Ballehaninna, U.K.; Chamberlain, R.S. The clinical utility of serum CA 19-9 in the diagnosis, prognosis and management of pancreatic adenocarcinoma: An evidence based appraisal. J. Gastrointest. Oncol. 2012, 3, 105–119. [Google Scholar] [CrossRef]
- Mann, D.V.; Edwards, R.; Ho, S.; Lau, W.Y.; Glazer, G. Elevated tumour marker CA19-9: Clinical interpretation and influence of obstructive jaundice. Eur. J. Surg. Oncol. 2000, 26, 474–479. [Google Scholar] [CrossRef] [PubMed]
- Azizian, A.; Rühlmann, F.; Krause, T.; Bernhardt, M.; Jo, P.; König, A.; Kleiß, M.; Leha, A.; Ghadimi, M.; Gaedcke, J. CA19-9 for detecting recurrence of pancreatic cancer. Sci. Rep. 2020, 10, 1332. [Google Scholar] [CrossRef] [PubMed] [Green Version]
- Fahrmann, J.F.; Schmidt, C.M.; Mao, X.; Irajizad, E.; Loftus, M.; Zhang, J.; Patel, N.; Vykoukal, J.; Dennison, J.B.; Long, J.P.; et al. Lead-Time Trajectory of CA19-9 as an Anchor Marker for Pancreatic Cancer Early Detection. Gastroenterology 2021, 160, 1373–1383.e6. [Google Scholar] [CrossRef]
- Kim, B.J.; Lee, K.T.; Moon, T.G.; Kang, P.; Lee, J.K.; Kim, J.J.; Rhee, J.C. How do we interpret an elevated carbohydrate antigen 19-9 level in asymptomatic subjects? Dig. Liver Dis. 2009, 41, 364–369. [Google Scholar] [CrossRef] [PubMed]
- Tong, Y.; Song, Z.; Zhu, W. Study of an elevated carbohydrate antigen 19-9 concentration in a large health check-up cohort in China. Clin. Chem. Lab. Med. 2013, 51, 1459–1466. [Google Scholar] [CrossRef] [PubMed]
- Chang, C.Y.; Huang, S.P.; Chiu, H.M.; Lee, Y.C.; Chen, M.F.; Lin, J.T. Low efficacy of serum levels of CA 19-9 in prediction of malignant diseases in asymptomatic population in Taiwan. Hepato-Gastroenterol. 2006, 53, 1–4. [Google Scholar]
- Kim, J.-E.; Lee, K.T.; Lee, J.K.; Paik, S.W.; Rhee, J.C.; Choi, K.W. Clinical usefulness of carbohydrate antigen 19-9 as a screening test for pancreatic cancer in an asymptomatic population. J. Gastroenterol. Hepatol. 2004, 19, 182–186. [Google Scholar] [CrossRef]
- Hong, S.; Song, K.B.; Hwang, D.W.; Lee, J.H.; Lee, W.; Jun, E.; Kwon, J.; Park, Y.; Park, S.Y.; Kim, N.; et al. Preoperative serum carbohydrate antigen 19-9 levels predict early recurrence after the resection of early-stage pancreatic ductal adenocarcinoma. World J. Gastrointest. Surg. 2021, 13, 1423–1435. [Google Scholar] [CrossRef]
- Goonetilleke, K.; Siriwardena, A. Systematic review of carbohydrate antigen (CA 19-9) as a biochemical marker in the diagnosis of pancreatic cancer. Eur. J. Surg. Oncol. 2007, 33, 266–270. [Google Scholar] [CrossRef]
- Ballehaninna, U.K.; Chamberlain, R.S. Serum CA 19-9 as a Biomarker for Pancreatic Cancer—A Comprehensive Review. Indian J. Surg. Oncol. 2011, 2, 88–100. [Google Scholar] [CrossRef] [Green Version]
- Winter, K.; Talar-Wojnarowska, R.; Dąbrowski, A.; Degowska, M.; Durlik, M.; Gąsiorowska, A.; Głuszek, S.; Jurkowska, G.; Kaczka, A.; Lampe, P.; et al. Diagnostic and therapeutic recommendations in pancreatic ductal adenocarcinoma. Recommendations of the Working Group of the Polish Pancreatic Club. Prz. Gastroenterol. 2019, 14, 1–18. [Google Scholar] [CrossRef] [PubMed]
- Steinberg, W.M.; Gelfand, R.; Anderson, K.K.; Glenn, J.; Kurtzman, S.H.; Sindelar, W.F.; Toskes, P.P. Comparison of the sensitivity and specificity of the CA19-9 and carcinoembryonic antigen assays in detecting cancer of the pancreas. Gastroenterology 1986, 90, 343. [Google Scholar] [CrossRef]
- Liu, C.; Deng, S.; Jin, K.; Gong, Y.; Cheng, H.; Fan, Z.; Qian, Y.; Huang, Q.; Ni, Q.; Luo, G.; et al. Lewis antigen-negative pancreatic cancer: An aggressive subgroup. Int. J. Oncol. 2020, 56, 900–908. [Google Scholar] [CrossRef] [PubMed] [Green Version]
- Kim, S.; Park, B.K.; Seo, J.H.; Choi, J.; Choi, J.W.; Lee, C.K.; Chung, J.B.; Park, Y.; Kim, D.W. Carbohydrate antigen 19-9 elevation without evidence of malignant or pancreatobiliary diseases. Sci. Rep. 2020, 10, 8820. [Google Scholar] [CrossRef]
- Ventrucci, M.; Pozzato, P.; Cipolla, A.; Uomo, G. Persistent elevation of serum CA 19-9 with no evidence of malignant disease. Dig. Liver Dis. 2009, 41, 357–363. [Google Scholar] [CrossRef] [PubMed]
- Steinberg, W. The clinical utility of the CA 19-9 tumor-associated antigen. Am. J. Gastroenterol. 1990, 85, 350–355. [Google Scholar] [PubMed]
- Wolske, K.M.; Ponnatapura, J.; Kolokythas, O.; Burke, L.M.B.; Tappouni, R.; Lalwani, N. Chronic Pancreatitis or Pancreatic Tumor? A Problem-solving Approach. RadioGraphics 2019, 39, 1965–1982. [Google Scholar] [CrossRef]
- Singh, V.K.; Yadav, D.; Garg, P.K. Diagnosis and management of chronic pancreatitis: A review. JAMA 2019, 322, 2422–2434. [Google Scholar] [CrossRef]
- Braganza, J.M.; Lee, S.H.; McCloy, R.F.; McMahon, M.J. Chronic pancreatitis. Lancet 2011, 377, 1184–1197. [Google Scholar] [CrossRef]
- Lowenfels, A.B.; Maisonneuve, P.; Cavallini, G.; Ammann, R.W.; Lankisch, P.G.; Andersen, J.R.; DiMagno, E.P.; Andren-Sandberg, A.; Domellof, L. Pancreatitis and the Risk of Pancreatic Cancer. N. Engl. J. Med. 1993, 328, 1433–1437. [Google Scholar] [CrossRef]
- Schima, W.; Böhm, G.; Rösch, C.S.; Klaus, A.; Függer, R.; Kopf, H. Mass-forming pancreatitis versus pancreatic ductal adenocarcinoma: CT and MR imaging for differentiation. Cancer Imaging 2020, 20, 52. [Google Scholar] [CrossRef] [PubMed]
- Basso, D.; Plebani, M.; Fogar, P.; Panozzo, M.P.; Meggiato, T.; De Paoli, M.; Del Favero, G. Insulin-like growth factor-I, interleukin-1 alpha and beta in pancreatic cancer: Role in tumor invasiveness and associated diabetes. Int. J. Clin. Lab. Res. 1995, 25, 40–43. [Google Scholar] [CrossRef]
- Meggiato, T.; Plebani, M.; Basso, D.; Panozzo, M.; Del Favero, G. Serum growth factors in patients with pancreatic cancer. Tumor Biol. 1999, 20, 65–71. [Google Scholar] [CrossRef]
- Dahlem, C.; Barghash, A.; Puchas, P.; Haybaeck, J.; Kessler, S.M. The insulin-like growth factor 2 mRNA binding protein IMP2/IGF2BP2 is overexpressed and correlates with poor survival in pancreatic cancer. Int. J. Mol. Sci. 2019, 20, 3204. [Google Scholar] [CrossRef] [Green Version]
- Gong, Y.; Zhang, B.; Liao, Y.; Tang, Y.; Mai, C.; Chen, T.; Tang, H. Serum Insulin-Like Growth Factor Axis and the Risk of Pancreatic Cancer: Systematic Review and Meta-Analysis. Nutrients 2017, 9, 394. [Google Scholar] [CrossRef] [Green Version]
- Cousin, S.P.; Hügl, S.R.; Wrede, C.E.; Kajio, H.; Myers Jr, M.G.; Rhodes, C.J. Free fatty acid-induced inhibition of glucose and insulin-like growth factor I-induced deoxyribonucleic acid synthesis in the pancreatic β-cell line INS-1. Endocrinology 2001, 142, 229–240. [Google Scholar] [CrossRef]
- Williams, T.; Berelowitz, M.; Joffe, S.N.; Thorner, M.O.; Rivier, J.; Vale, W.; Frohman, L.A. Impaired Growth Hormone Responses to Growth Hormone–Releasing Factor in Obesity. A pituitary defect reversed with weight reduction. N. Engl. J. Med. 1984, 311, 1403–1407. [Google Scholar] [CrossRef] [PubMed]
- Gao, S.; Sun, Y.; Zhang, X.; Hu, L.; Liu, Y.; Chua, C.Y.; Phillips, L.M.; Ren, H.; Fleming, J.B.; Wang, H.; et al. IGFBP2 Activates the NF-κB Pathway to Drive Epithelial–Mesenchymal Transition and Invasive Character in Pancreatic Ductal Adenocarcinoma. Cancer Res. 2016, 76, 6543–6554. [Google Scholar] [CrossRef] [PubMed] [Green Version]
- Dong, J.; Yu, J.; Li, Z.; Gao, S.; Wang, H.; Yang, S.; Wu, L.; Lan, C.; Zhao, T.; Gao, C.; et al. Serum insulin-like growth factor binding protein 2 levels as biomarker for pancreatic ductal adenocarcinoma-associated malnutrition and muscle wasting. J. Cachex. Sarcopenia Muscle 2021, 12, 704–716. [Google Scholar] [CrossRef]
- Ge, L.; Pan, B.; Song, F.; Ma, J.; Zeraatkar, D.; Zhou, J.; Tian, J. Comparing the diagnostic accuracy of five common tumour biomarkers and CA19-9 for pancreatic cancer: A protocol for a network meta-analysis of diagnostic test accuracy. BMJ Open 2017, 7, e018175. [Google Scholar] [CrossRef] [PubMed] [Green Version]
- Van Manen, L.; Groen, J.V.; Putter, H.; Vahrmeijer, A.L.; Swijnenburg, R.-J.; Bonsing, B.A.; Mieog, J.S.D. Elevated CEA and CA19-9 serum levels independently predict advanced pancreatic cancer at diagnosis. Biomarkers 2020, 25, 186–193. [Google Scholar] [CrossRef] [PubMed] [Green Version]
- Mehta, S.; Bhimani, N.; Gill, A.J.; Samra, J.S.; Sahni, S.; Mittal, A. Serum biomarker panel for diagnosis and prognosis of pancreatic ductal adenocarcinomas. Front. Oncol. 2021, 11, 708963. [Google Scholar] [CrossRef] [PubMed]
- Hrabák, P.; Šoupal, J.; Kalousová, M.; Krechler, T.; Vočka, M.; Hanuš, T.; Petruželka, L.; Svačina, S.; Žák, A.; Zima, T. Novel biochemical markers for non-invasive detection of pancreatic cancer. Neoplasma 2022, 69, 474–483. [Google Scholar] [CrossRef] [PubMed]

| 89 PDAC | 48 CP | |
|---|---|---|
| Sex | 42 women and 47 men | 12 women and 36 men |
| Age | 65.43 (±10.11) | 54.88 (±12.87) |
| BMI kg/m2 | 23.8 ± 5.0 | 23.8 ± 0.6 |
| DM | 29 | 18 |
| Bilirubin level (norm: 0.8–1.2 mg/dL) | 6.13 ± 8.98 | 1.15 ± 1.39 |
| Indicator | Obs | AUROC | Std. Err. | 95% Conf. Interval | |
|---|---|---|---|---|---|
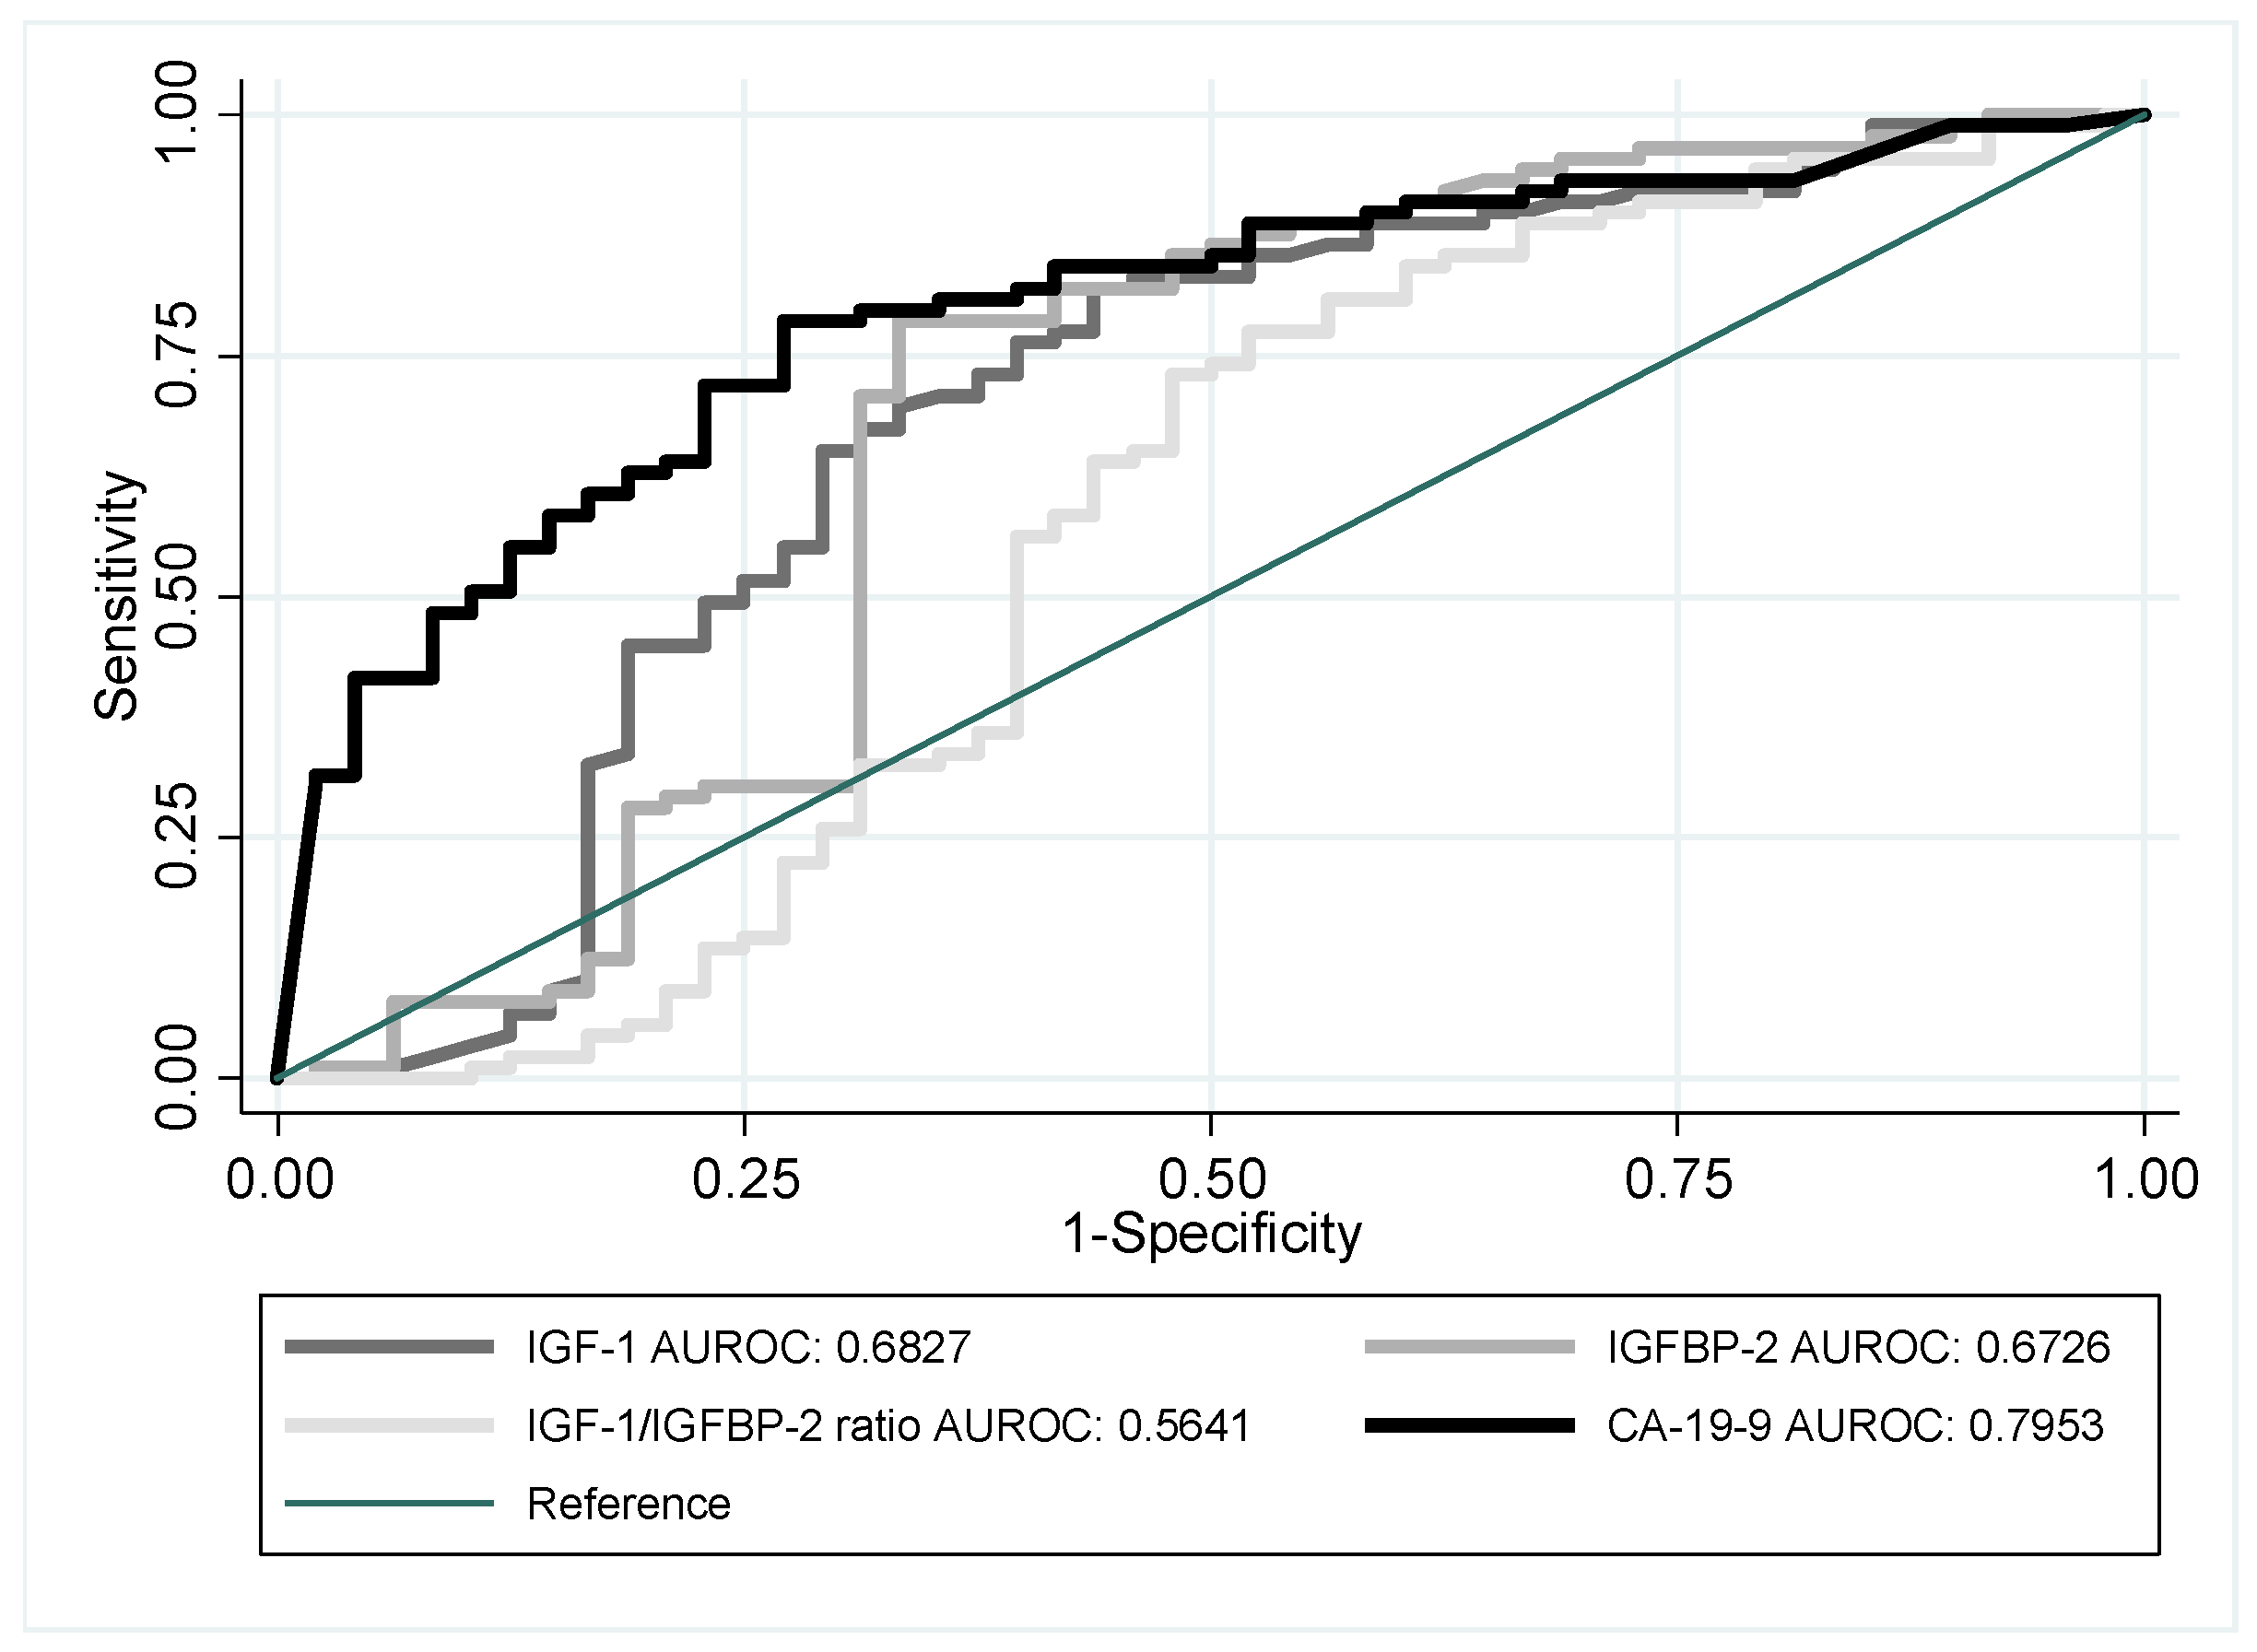
| IGF-1 | 137 | 0.6827 | 0.0532 | 0.57834 | 0.78707 |
| IGFBP-2 | 137 | 0.6726 | 0.0559 | 0.56298 | 0.78229 |
| IGF-1/IGFBP-2 ratio | 137 | 0.5641 | 0.0587 | 0.44904 | 0.67924 |
| DM + IGF-1 | 137 | 0.6963 | 0.0511 | 0.59615 | 0.7964 |
| DM + IGFBP-2 | 137 | 0.6723 | 0.056 | 0.56258 | 0.78199 |
| DM + IGF-1/IGFBP-2 ratio | 137 | 0.4649 | 0.0573 | 0.35267 | 0.5771 |
| DM + CA-19-9 | 137 | 0.7958 | 0.0385 | 0.72022 | 0.8713 |
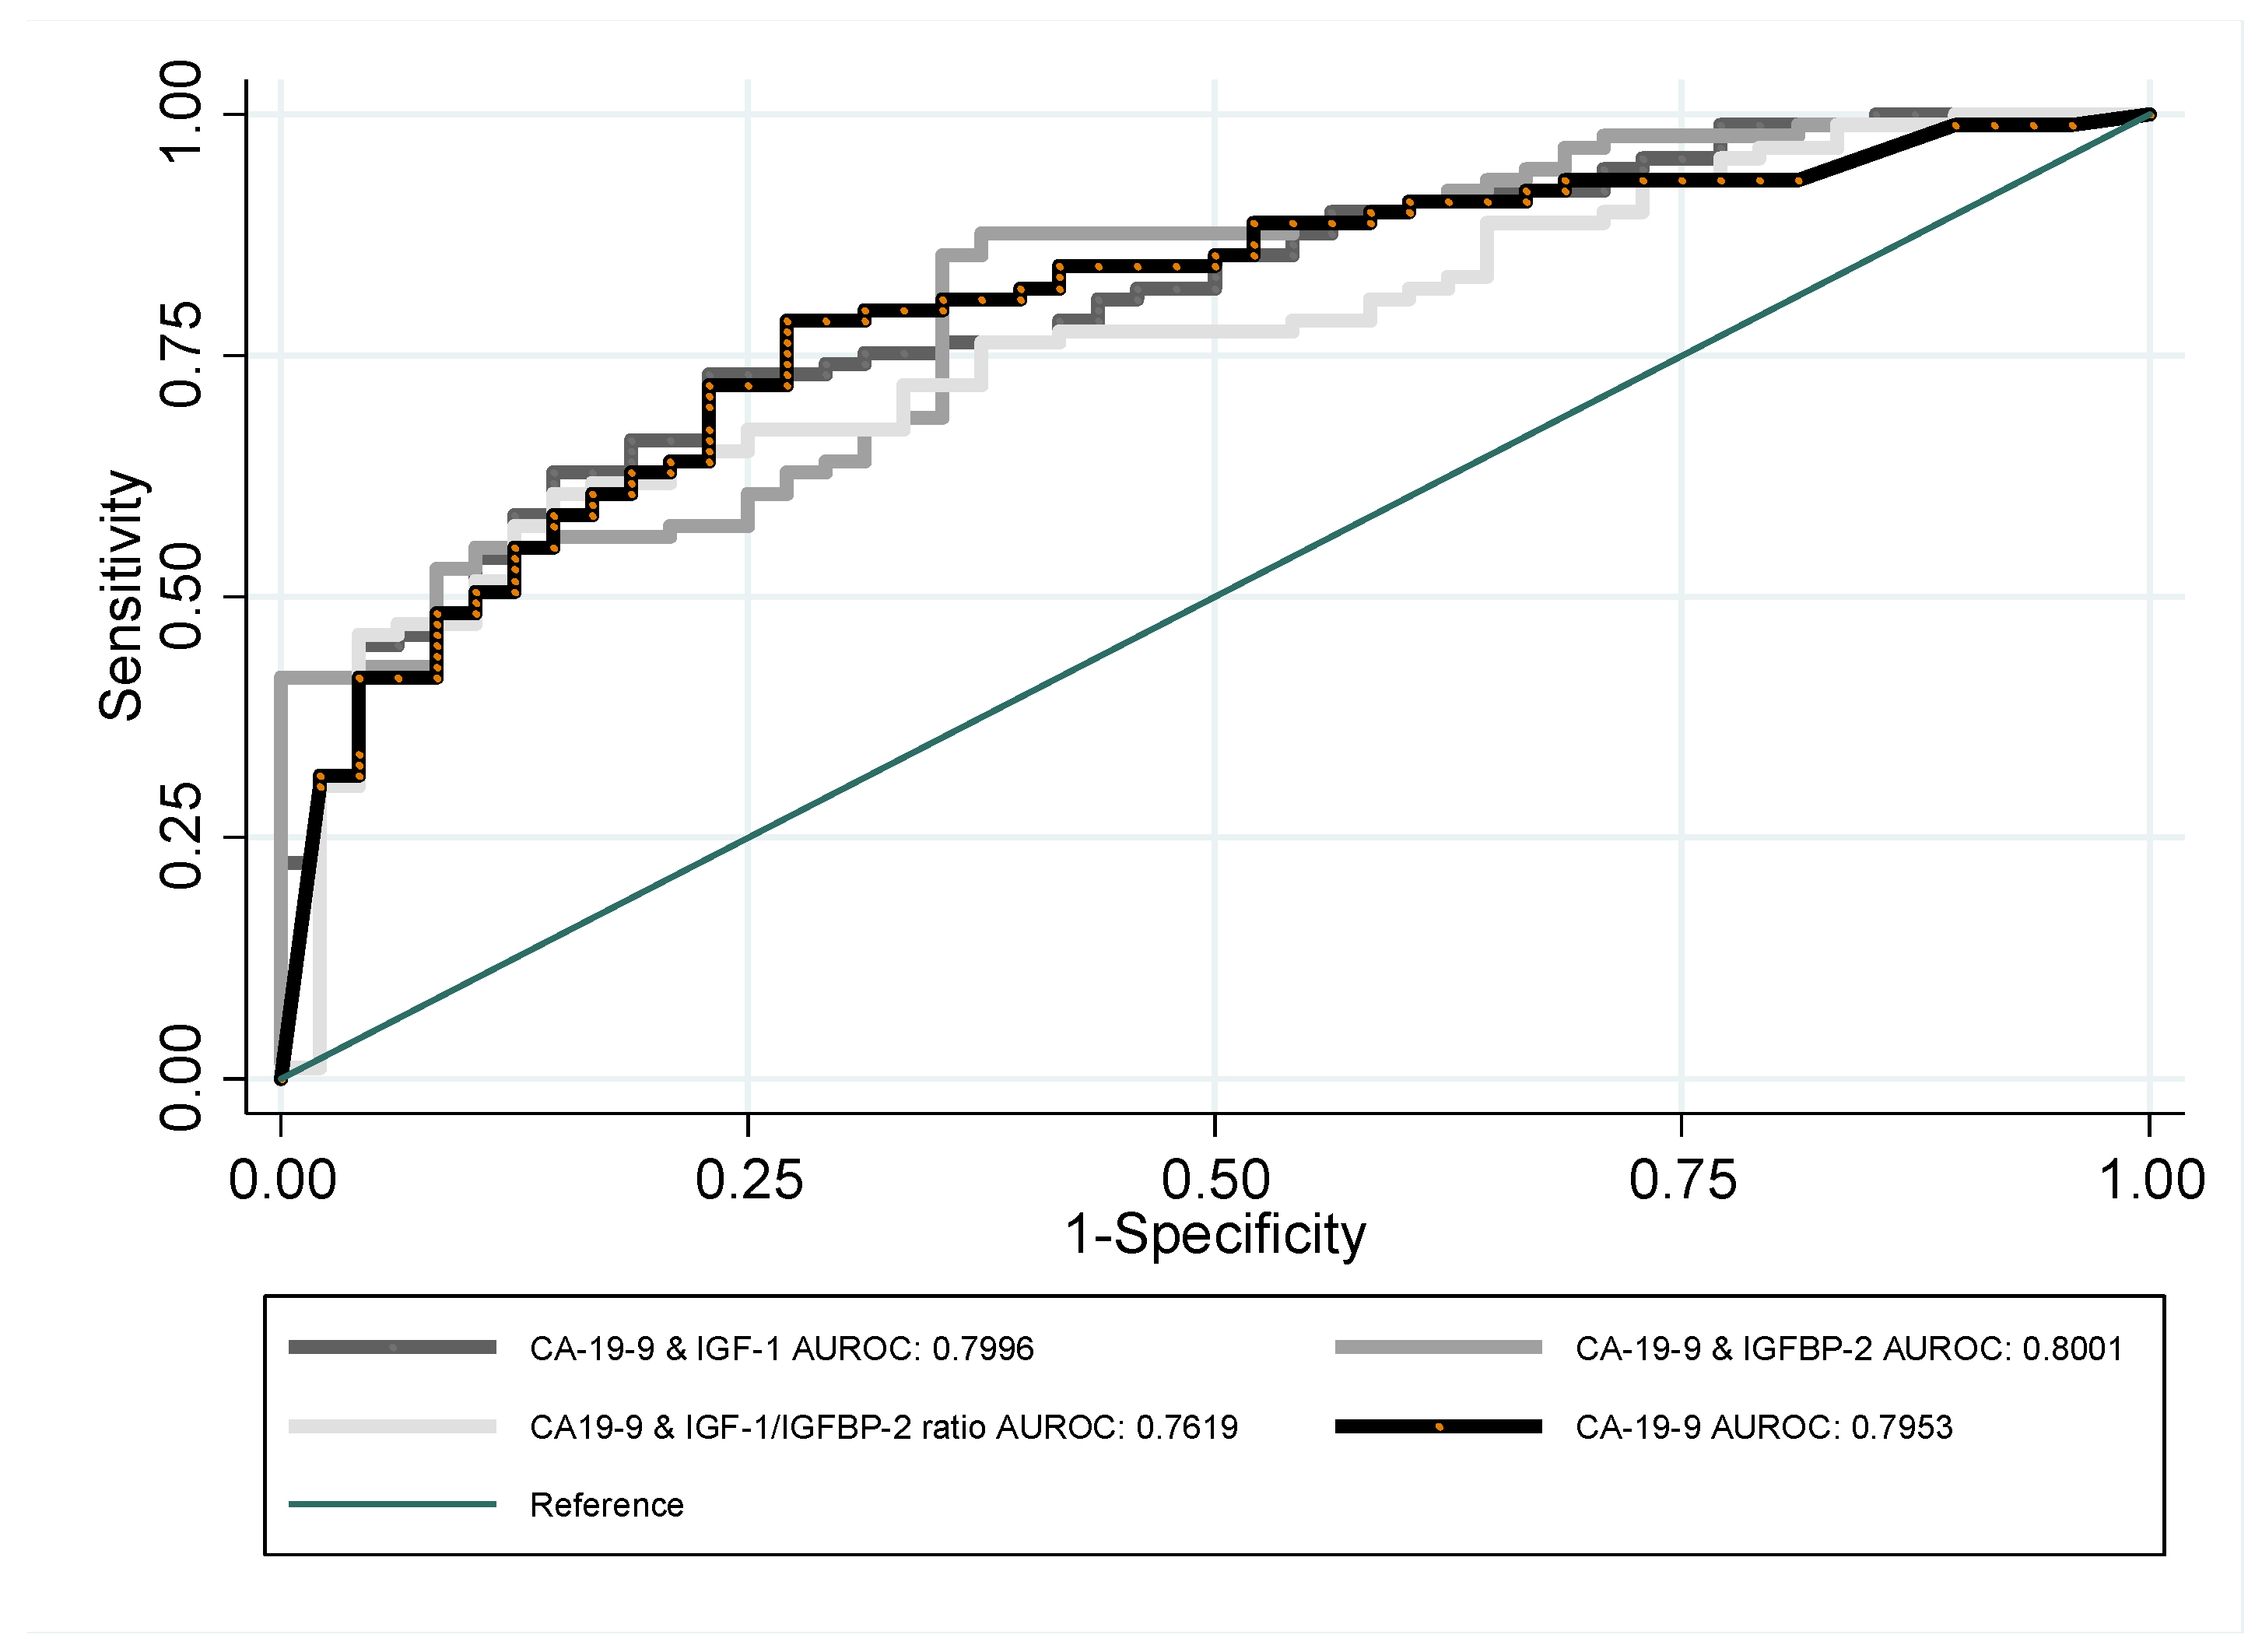
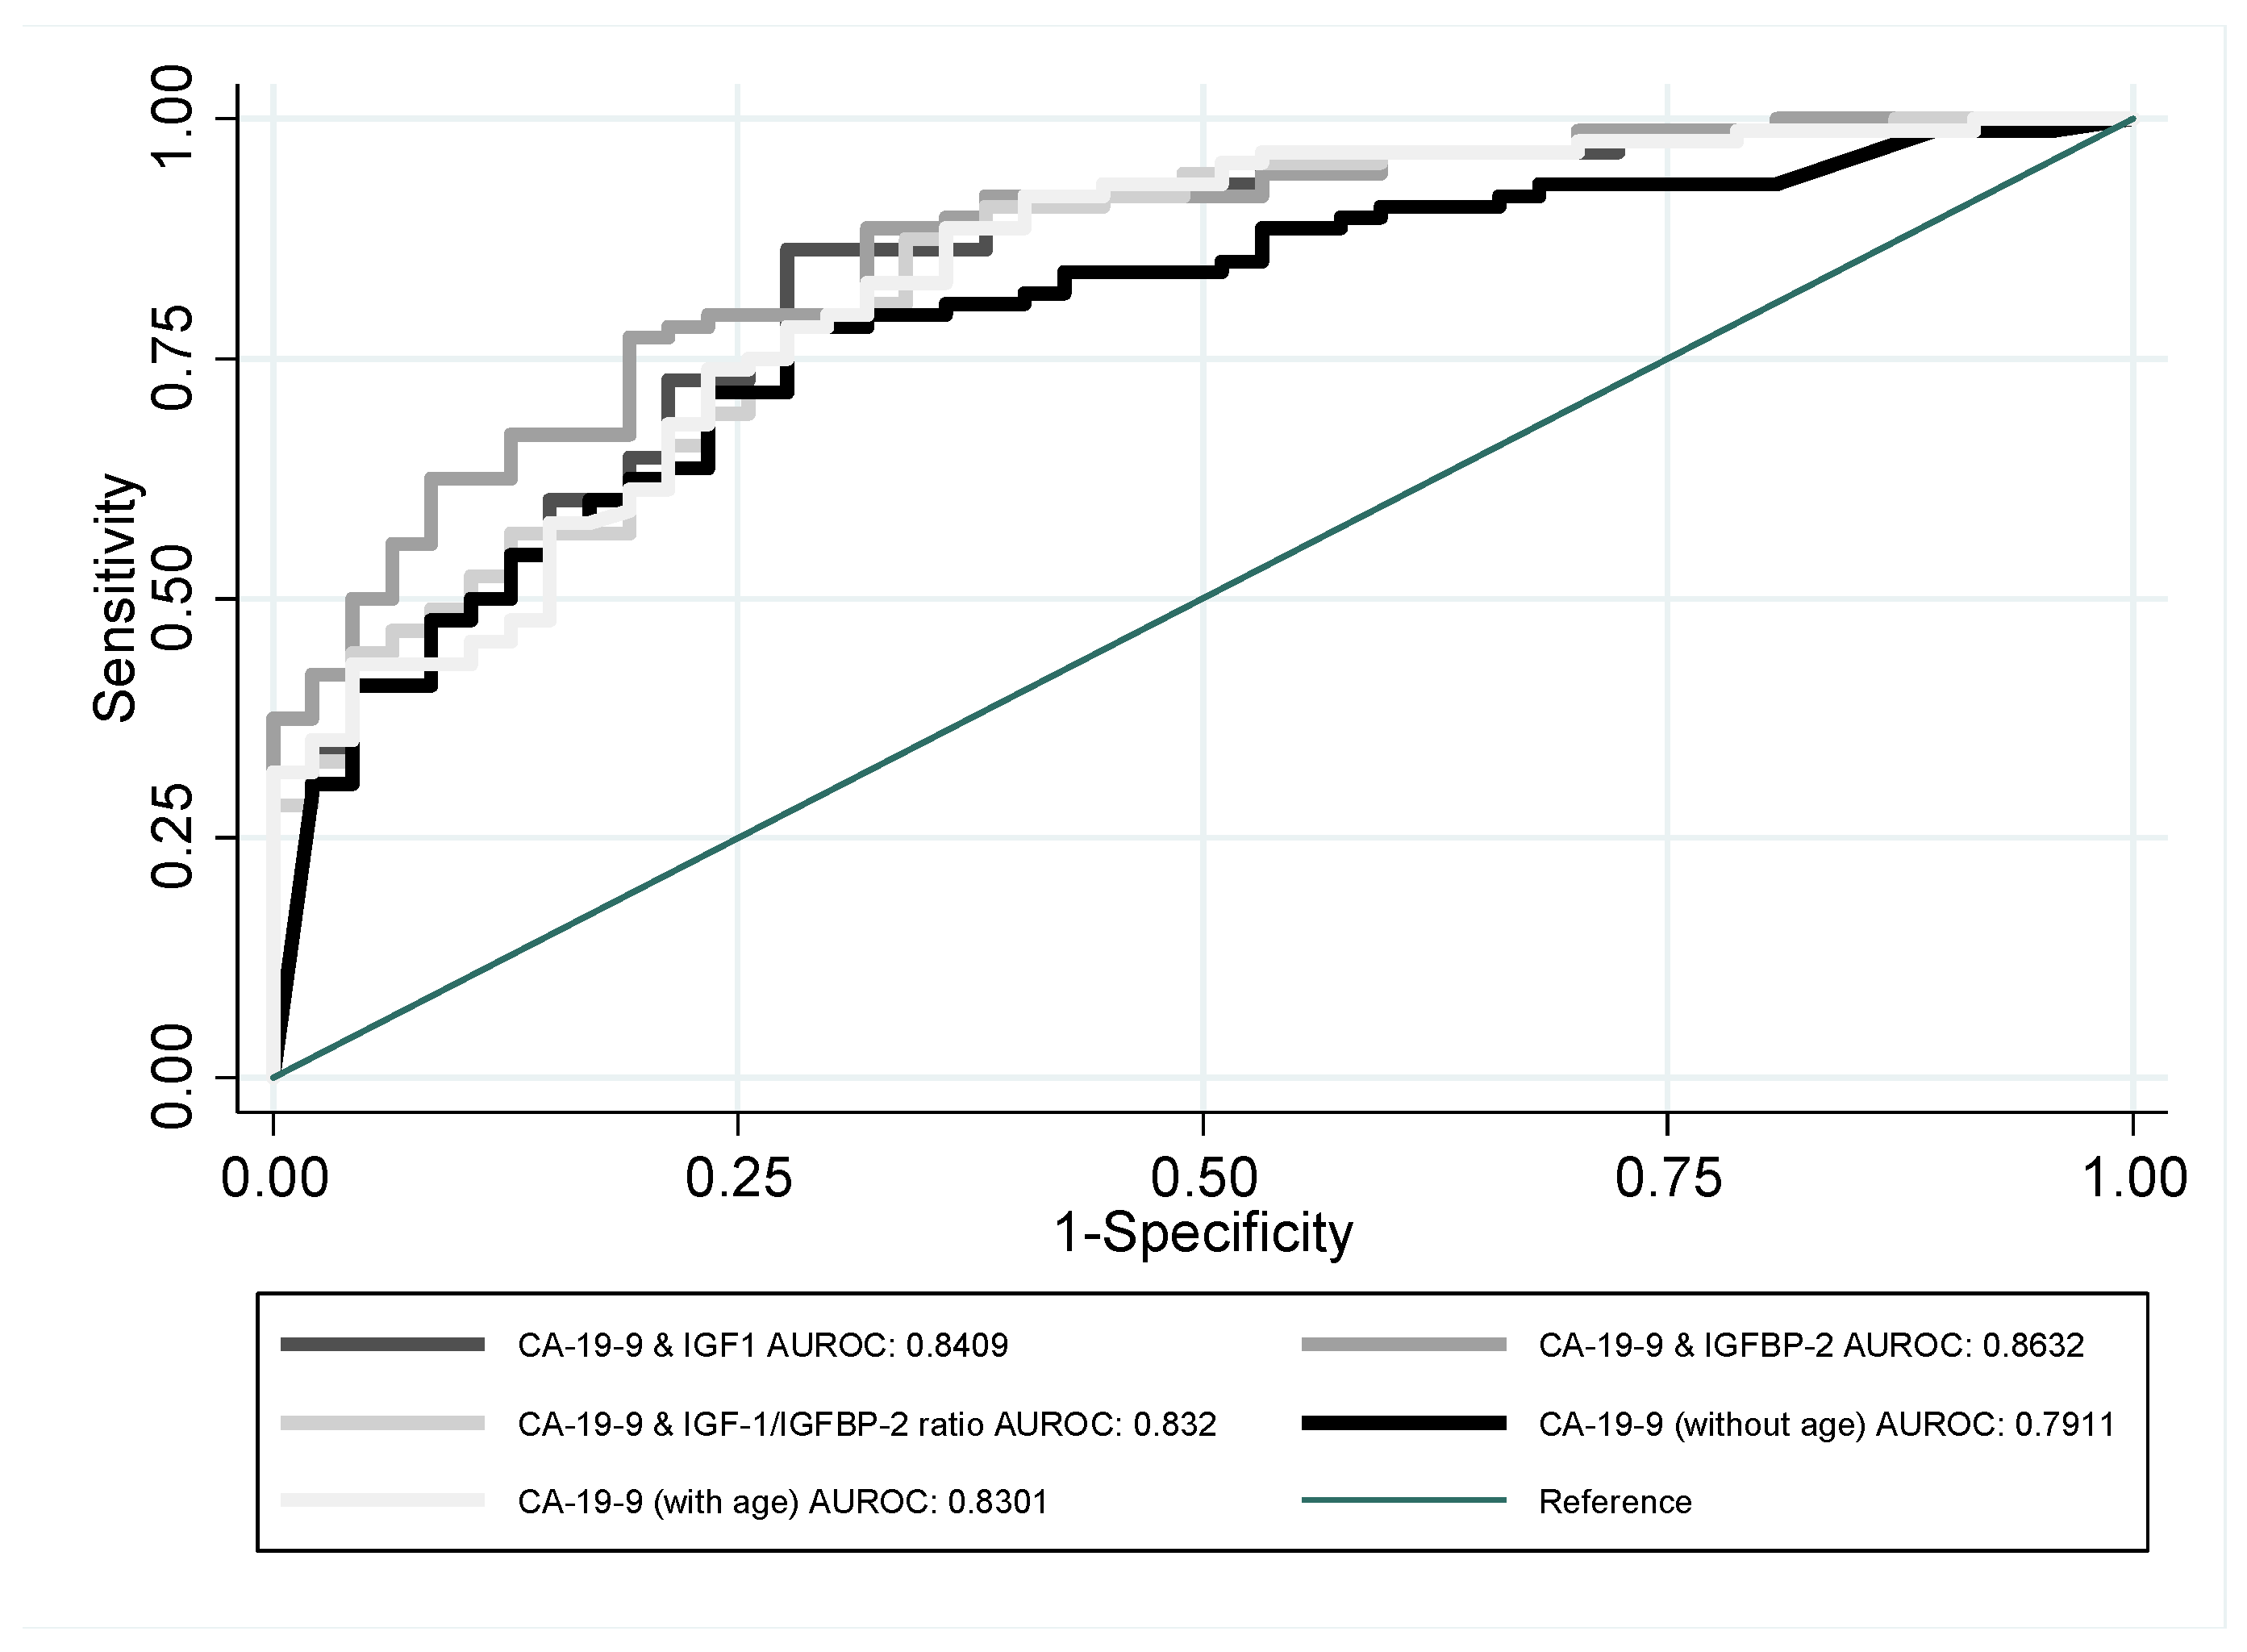
| CA-19-9 | 137 | 0.7953 | 0.0389 | 0.71904 | 0.87155 |
| CA-19-9 + IGF-1 | 137 | 0.7996 | 0.0377 | 0.72565 | 0.8736 |
| CA-19-9 + IGFBP-2 | 137 | 0.8001 | 0.0378 | 0.72605 | 0.87414 |
| CA-19-9 + IGF-1/IGFBP-2 ratio | 137 | 0.7619 | 0.0413 | 0.68103 | 0.84284 |
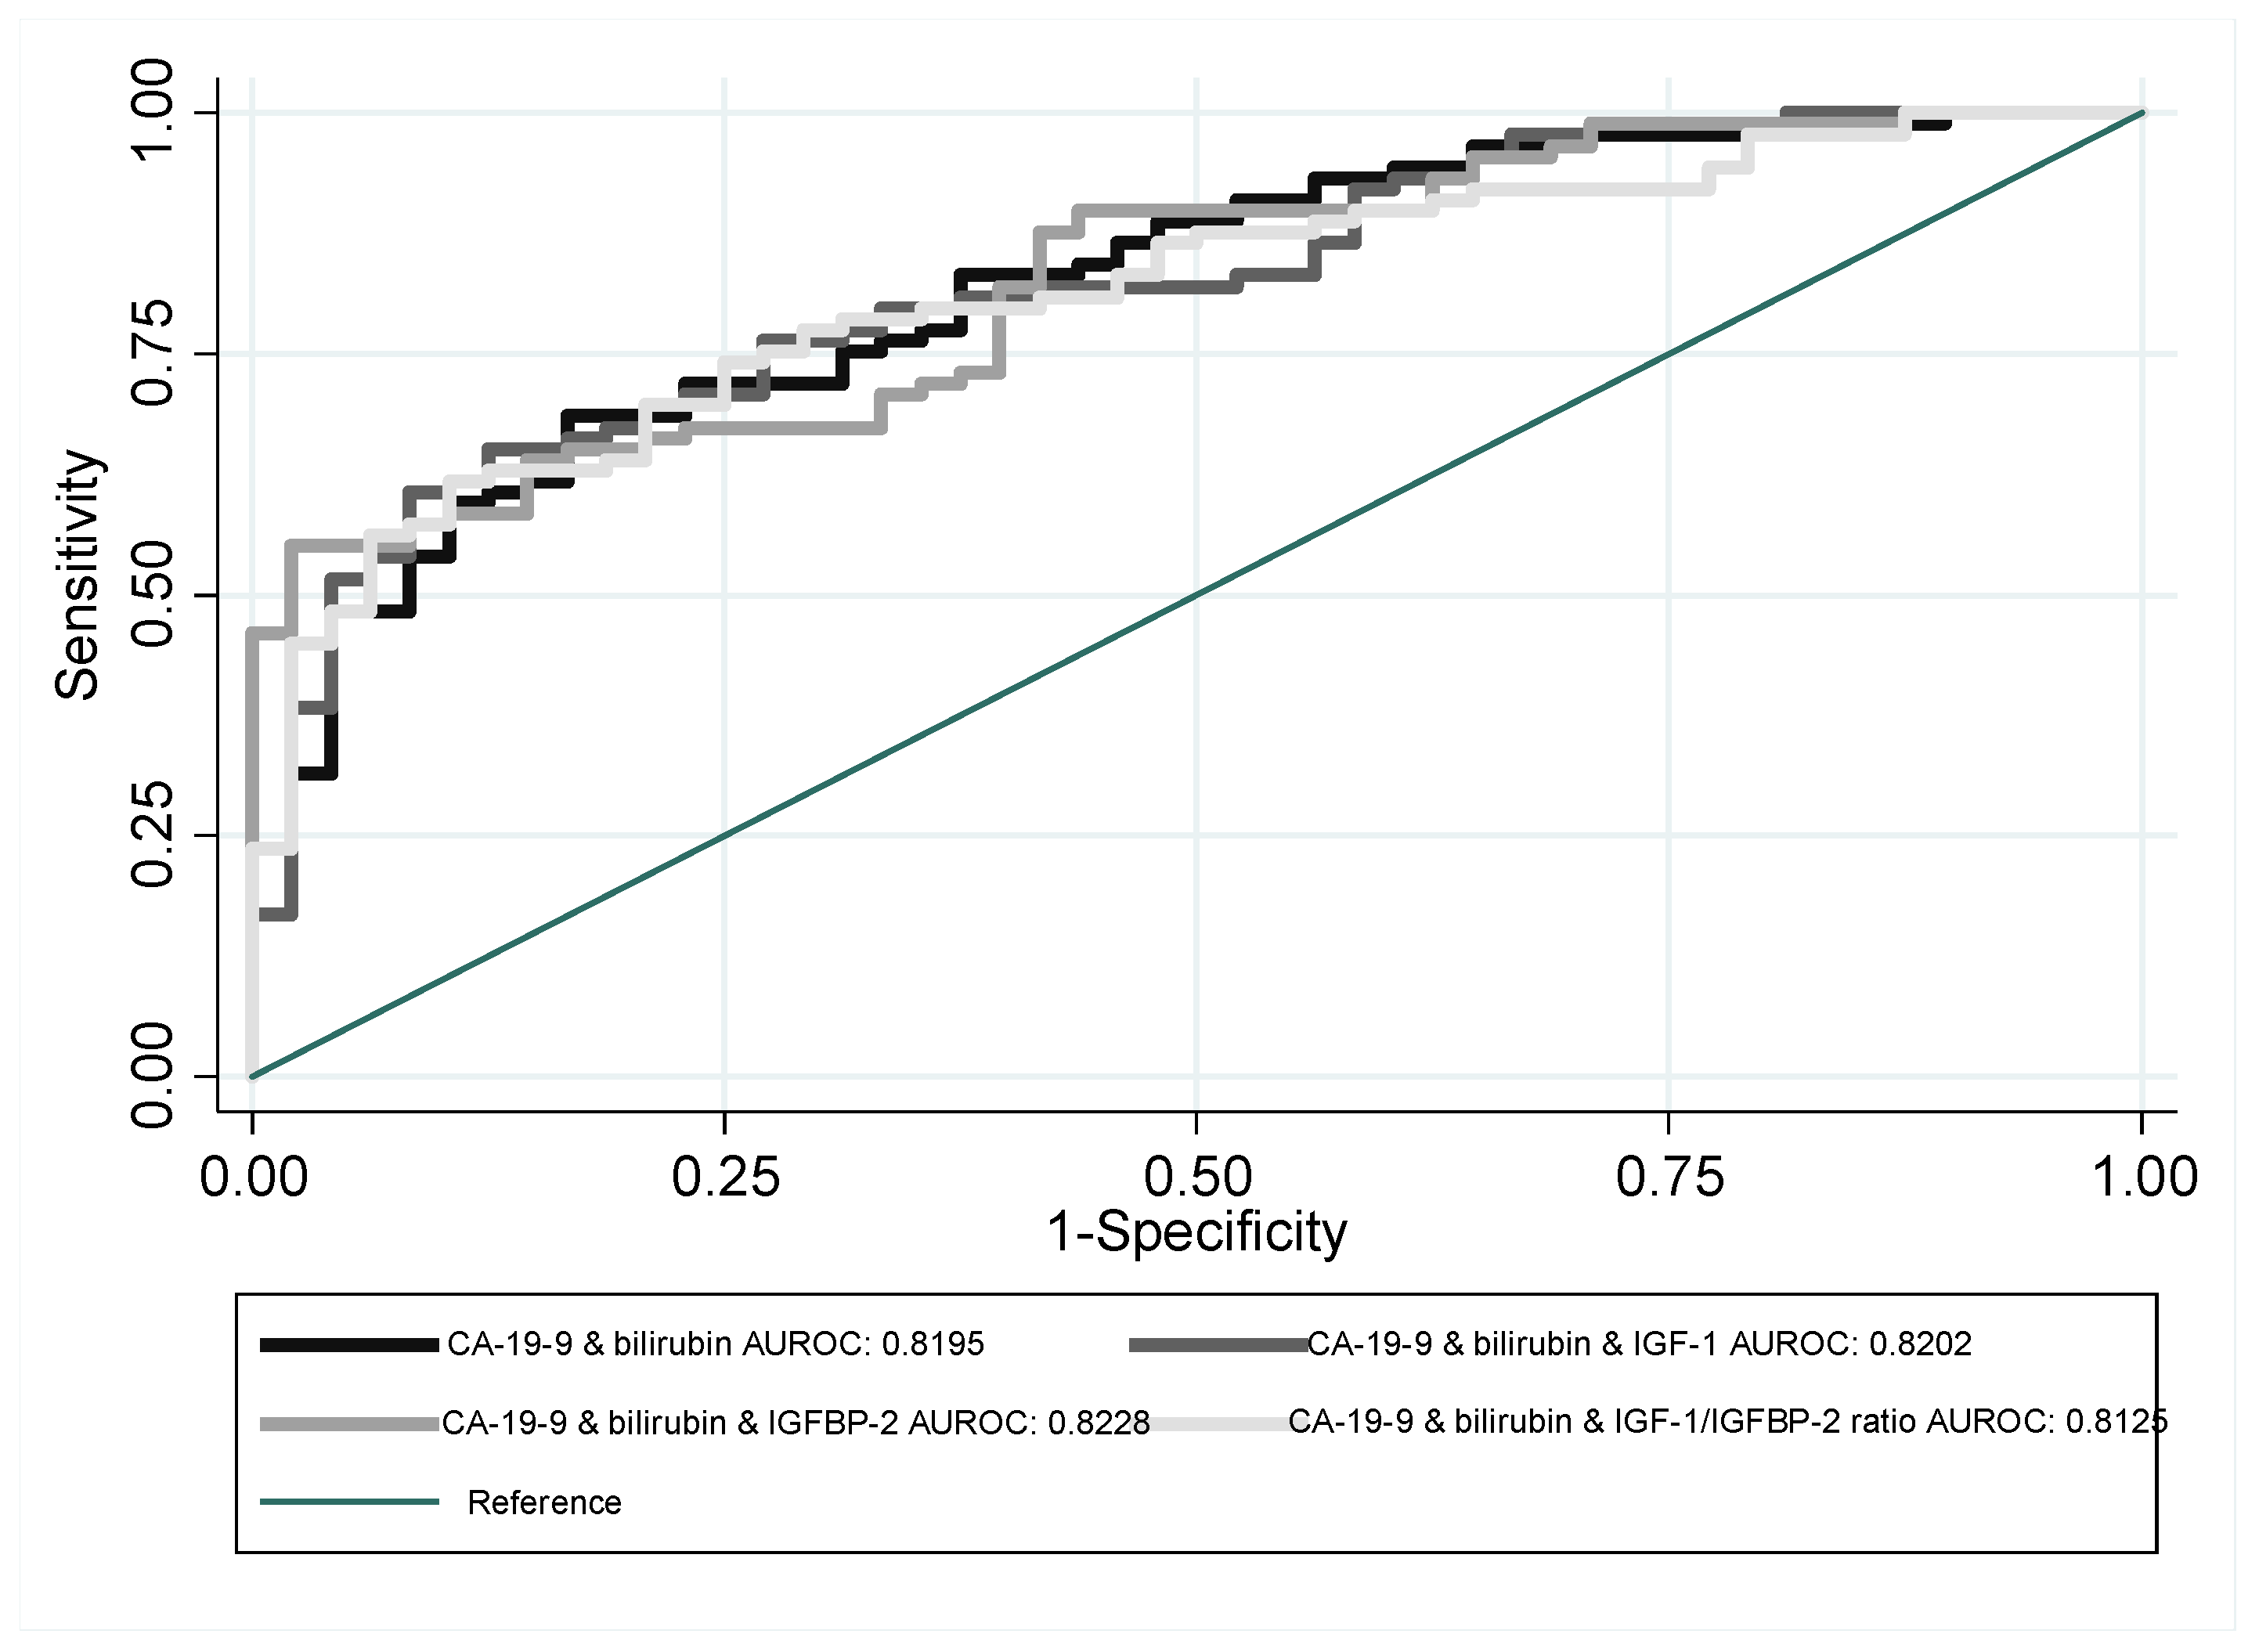
| CA-19-9 + bilirubin | 137 | 0.8195 | 0.0364 | 0.74821 | 0.89084 |
| CA-19-9 + bilirubin + IGF-1 | 137 | 0.8202 | 0.0359 | 0.74995 | 0.8905 |
| CA-19-9 + bilirubin + IGFBP-2 | 137 | 0.8228 | 0.0346 | 0.75489 | 0.89071 |
| CA-19-9 + bilirubin + IGF-1/IGFBP-2 ratio | 137 | 0.8125 | 0.0362 | 0.74162 | 0.88338 |
| Age + IGF-1 | 135 | 0.7747 | 0.0432 | 0.68998 | 0.85935 |
| Age + IGFBP-2 | 135 | 0.817 | 0.0394 | 0.73965 | 0.89429 |
| Age + IGF-1/IGFBP-2 ratio | 135 | 0.7672 | 0.0449 | 0.67924 | 0.85509 |
| Age + CA-19-9 | 135 | 0.8301 | 0.0367 | 0.75829 | 0.90201 |
| Age + CA-19-9 + IGF-1 | 135 | 0.8409 | 0.0352 | 0.77189 | 0.90993 |
| Age + CA-19-9 + IGFBP-2 | 135 | 0.8632 | 0.0314 | 0.80161 | 0.9247 |
| Age + CA-19-9 + IGF-1/IGFBP-2 ratio | 135 | 0.832 | 0.0362 | 0.76108 | 0.90285 |
| Age + sex + IGF-1 | 135 | 0.7923 | 0.0428 | 0.70845 | 0.87617 |
| Age + sex + IGFBP-2 | 135 | 0.8332 | 0.0381 | 0.75845 | 0.90789 |
| Age + sex + IGF-1/IGFBP-2 ratio | 135 | 0.7841 | 0.0447 | 0.69646 | 0.87172 |
| Age + sex + CA-19-9 | 135 | 0.8347 | 0.0361 | 0.76399 | 0.9055 |
| Age + sex + CA-19-9 + IGF-1 | 135 | 0.8467 | 0.0345 | 0.77912 | 0.91431 |
| Age + sex + CA-19-9 + IGFBP-2 | 135 | 0.8711 | 0.0309 | 0.81052 | 0.93174 |
| Age + sex + CA-19-9 + IGF-1/IGFBP-2 ratio | 135 | 0.8433 | 0.0349 | 0.77489 | 0.91176 |
| Age + sex + bilirubin + CA-19-9 | 135 | 0.8501 | 0.034 | 0.78347 | 0.91672 |
| Age + sex + bilirubin + CA-19-9 + IGF-1 | 135 | 0.8622 | 0.0319 | 0.79973 | 0.92464 |
| Age + sex + bilirubin + CA-19-9 + IGFBP-2 | 135 | 0.8832 | 0.0281 | 0.82808 | 0.93836 |
| Age + sex + bilirubin + CA-19-9 + IGF-1/IGFBP-2 ratio | 135 | 0.8648 | 0.0309 | 0.8042 | 0.92549 |
| Indicator | CP vs. PDAC (TNM = I & II) | CP vs. PDAC (TNM = III & IV) | ||||||||
|---|---|---|---|---|---|---|---|---|---|---|
| Obs | AUROC | Std. Err. | 95% CI | Obs | AUROC | Std. Err. | 95% CI | |||
| IGF-1 | 93 | 0.6704 | 0.0581 | 0.55649 | 0.78425 | 92 | 0.6953 | 0.0576 | 0.58243 | 0.80819 |
| IGFBP-2 | 93 | 0.6822 | 0.0588 | 0.56695 | 0.7974 | 92 | 0.6629 | 0.0596 | 0.54601 | 0.77974 |
| IGF-1/IGFBP-2 ratio | 93 | 0.5801 | 0.0627 | 0.45722 | 0.70296 | 92 | 0.5478 | 0.0619 | 0.42658 | 0.66907 |
| DM + IGF-1 | 93 | 0.6894 | 0.0559 | 0.57975 | 0.79895 | 92 | 0.6986 | 0.0575 | 0.58598 | 0.81127 |
| DM + IGFBP-2 | 93 | 0.7056 | 0.055 | 0.59783 | 0.81328 | 92 | 0.6615 | 0.0602 | 0.5434 | 0.77952 |
| DM + IGF-1/IGFBP-2 ratio | 93 | 0.4917 | 0.0617 | 0.37068 | 0.61265 | 92 | 0.4607 | 0.062 | 0.33926 | 0.58215 |
| DM + CA-19-9 | 93 | 0.735 | 0.0538 | 0.62952 | 0.84038 | 92 | 0.866 | 0.0396 | 0.78845 | 0.94356 |
| CA-19-9 | 93 | 0.7294 | 0.0523 | 0.62697 | 0.83183 | 92 | 0.8627 | 0.0405 | 0.78325 | 0.94213 |
| CA-19-9 + IGF-1 | 93 | 0.7315 | 0.052 | 0.62965 | 0.83331 | 92 | 0.866 | 0.0388 | 0.78987 | 0.94214 |
| CA-19-9 + IGFBP-2 | 93 | 0.7546 | 0.0499 | 0.6568 | 0.85246 | 92 | 0.8532 | 0.0389 | 0.77692 | 0.92952 |
| CA-19-9 + IGF-1/IGFBP-2 ratio | 93 | 0.6685 | 0.0564 | 0.55791 | 0.77913 | 92 | 0.8627 | 0.0403 | 0.78371 | 0.94167 |
| CA-19-9 + bilirubin | 93 | 0.725 | 0.0522 | 0.62261 | 0.82739 | 92 | 0.9138 | 0.0279 | 0.85912 | 0.96853 |
| CA-19-9 + bilirubin + IGF-1 | 93 | 0.7505 | 0.0504 | 0.6516 | 0.84933 | 92 | 0.9029 | 0.0319 | 0.84038 | 0.96549 |
| CA-19-9 + bilirubin + IGFBP-2 | 93 | 0.7648 | 0.0487 | 0.66937 | 0.86026 | 92 | 0.91 | 0.029 | 0.85317 | 0.9669 |
| CA-19-9 + bilirubin + IGF-1/IGFBP-2 ratio | 93 | 0.7255 | 0.0522 | 0.6231 | 0.82782 | 92 | 0.9063 | 0.0316 | 0.84436 | 0.96814 |
| Age + IGF-1 | 91 | 0.7814 | 0.048 | 0.6873 | 0.87556 | 91 | 0.912 | 0.0288 | 0.85564 | 0.96834 |
| Age + IGFBP-2 | 91 | 0.8071 | 0.0453 | 0.71824 | 0.89588 | 91 | 0.9159 | 0.0274 | 0.86208 | 0.96965 |
| Age + IGF-1/IGFBP-2 ratio | 91 | 0.7505 | 0.0512 | 0.65019 | 0.85078 | 91 | 0.9038 | 0.0298 | 0.84532 | 0.96223 |
| Age + CA-19-9 | 91 | 0.7621 | 0.0496 | 0.66483 | 0.85935 | 91 | 0.903 | 0.0302 | 0.84391 | 0.96218 |
| Age + CA-19-9 + IGF-1 | 91 | 0.7853 | 0.0475 | 0.69216 | 0.87844 | 91 | 0.8138 | 0.0444 | 0.72674 | 0.90092 |
| Age + CA-19-9 + IGFBP-2 | 91 | 0.8201 | 0.0437 | 0.73441 | 0.90582 | 91 | 0.8288 | 0.0428 | 0.745 | 0.91264 |
| Age + CA-19-9 + IGF-1/IGFBP-2 ratio | 91 | 0.7592 | 0.0497 | 0.66173 | 0.85664 | 91 | 0.7834 | 0.0488 | 0.68767 | 0.87906 |
| Age + sex + IGF-1 | 91 | 0.7877 | 0.0473 | 0.69496 | 0.88048 | 91 | 0.8308 | 0.0421 | 0.74822 | 0.91329 |
| Age + sex + IGFBP-2 | 91 | 0.8269 | 0.0438 | 0.74113 | 0.91264 | 91 | 0.8482 | 0.04 | 0.76982 | 0.9265 |
| Age + sex + IGF-1/IGFBP-2 ratio | 91 | 0.7722 | 0.0495 | 0.67528 | 0.8692 | 91 | 0.8061 | 0.0466 | 0.71478 | 0.89741 |
| Age + sex + CA-19-9 | 91 | 0.779 | 0.0484 | 0.68423 | 0.8738 | 91 | 0.9021 | 0.0302 | 0.84296 | 0.9612 |
| Age + sex + CA-19-9 + IGF-1 | 91 | 0.7993 | 0.0457 | 0.7097 | 0.88894 | 91 | 0.9125 | 0.0286 | 0.85651 | 0.96844 |
| Age + sex + CA-19-9 + IGFBP-2 | 91 | 0.837 | 0.0424 | 0.75396 | 0.92012 | 91 | 0.9202 | 0.0264 | 0.86848 | 0.97194 |
| Age + sex + CA-19-9 + IGF-1/IGFBP-2 ratio | 91 | 0.7838 | 0.0476 | 0.69065 | 0.87705 | 91 | 0.9062 | 0.0294 | 0.8486 | 0.96378 |
| Age + sex + bilirubin + CA-19-9 | 91 | 0.7969 | 0.046 | 0.7068 | 0.88701 | 91 | 0.927 | 0.0249 | 0.87824 | 0.97573 |
| Age + sex + bilirubin + CA-19-9 + IGF-1 | 91 | 0.8133 | 0.0441 | 0.72697 | 0.89972 | 91 | 0.9318 | 0.0237 | 0.88531 | 0.97833 |
| Age + sex + bilirubin + CA-19-9 + IGFBP-2 | 91 | 0.8433 | 0.0408 | 0.76344 | 0.92321 | 91 | 0.9338 | 0.0236 | 0.88757 | 0.97994 |
| Age + sex + bilirubin + CA-19-9 + IGF-1/IGFBP-2 ratio | 91 | 0.7998 | 0.0456 | 0.71035 | 0.88927 | 91 | 0.9275 | 0.0248 | 0.87888 | 0.97605 |
Disclaimer/Publisher’s Note: The statements, opinions and data contained in all publications are solely those of the individual author(s) and contributor(s) and not of MDPI and/or the editor(s). MDPI and/or the editor(s) disclaim responsibility for any injury to people or property resulting from any ideas, methods, instructions or products referred to in the content. |
© 2023 by the authors. Licensee MDPI, Basel, Switzerland. This article is an open access article distributed under the terms and conditions of the Creative Commons Attribution (CC BY) license (https://creativecommons.org/licenses/by/4.0/).
Share and Cite
Wlodarczyk, B.; Durko, L.; Wlodarczyk, P.; Talar-Wojnarowska, R.; Malecka-Wojciesko, E. CA 19-9 but Not IGF-1/IGFBP-2 Is a Useful Biomarker for Pancreatic Ductal Adenocarcinoma (PDAC) and Chronic Pancreatitis (CP) Differentiation. J. Clin. Med. 2023, 12, 4050. https://doi.org/10.3390/jcm12124050
Wlodarczyk B, Durko L, Wlodarczyk P, Talar-Wojnarowska R, Malecka-Wojciesko E. CA 19-9 but Not IGF-1/IGFBP-2 Is a Useful Biomarker for Pancreatic Ductal Adenocarcinoma (PDAC) and Chronic Pancreatitis (CP) Differentiation. Journal of Clinical Medicine. 2023; 12(12):4050. https://doi.org/10.3390/jcm12124050
Chicago/Turabian StyleWlodarczyk, Barbara, Lukasz Durko, Przemyslaw Wlodarczyk, Renata Talar-Wojnarowska, and Ewa Malecka-Wojciesko. 2023. "CA 19-9 but Not IGF-1/IGFBP-2 Is a Useful Biomarker for Pancreatic Ductal Adenocarcinoma (PDAC) and Chronic Pancreatitis (CP) Differentiation" Journal of Clinical Medicine 12, no. 12: 4050. https://doi.org/10.3390/jcm12124050
APA StyleWlodarczyk, B., Durko, L., Wlodarczyk, P., Talar-Wojnarowska, R., & Malecka-Wojciesko, E. (2023). CA 19-9 but Not IGF-1/IGFBP-2 Is a Useful Biomarker for Pancreatic Ductal Adenocarcinoma (PDAC) and Chronic Pancreatitis (CP) Differentiation. Journal of Clinical Medicine, 12(12), 4050. https://doi.org/10.3390/jcm12124050