
Differences in Heart Rate Variability and Baroreflex Sensitivity between Male and Female Athletes

 , and
, and
Abstract
: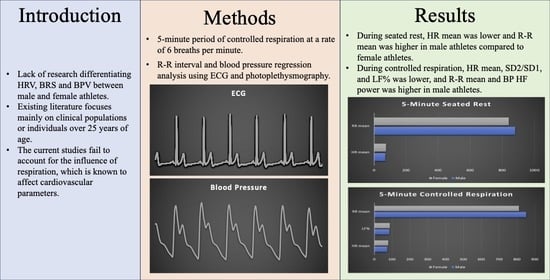
1. Introduction
2. Materials and Methods
2.1. Participants
2.2. Data Collection
2.3. Data Analysis
2.4. Statistical Analysis
3. Results
3.1. Five Min Seated Rest
3.2. Five Min Controlled Respiration
3.3. Multiple Regression Analysis
4. Discussion
5. Conclusions
Author Contributions
Funding
Institutional Review Board Statement
Informed Consent Statement
Data Availability Statement
Conflicts of Interest
References
- Ellingson, C.J.; Singh, J.; Ellingson, C.A.; Dech, R.; Piskorski, J.; Neary, J.P. The Influence of External Stressors on Physiological Testing: Implication for Return-to-Play Protocols. Curr. Res. Physiol. 2022, 5, 240–245. [Google Scholar] [CrossRef]
- Heart Rate Variability: Standards of Measurement, Physiological Interpretation and Clinical Use. Task Force of the European Society of Cardiology and the North American Society of Pacing and Electrophysiology. Circulation 1996, 93, 1043–1065. [CrossRef] [Green Version]
- Parati, G.; Saul, J.P.; di Rienzo, M.; Mancia, G. Spectral Analysis of Blood Pressure and Heart Rate Variability in Evaluating Cardiovascular Regulation. Hypertension 1995, 25, 1276–1286. [Google Scholar] [CrossRef]
- Pinna, G.D.; Maestri, R.; la Rovere, M.T. Assessment of Baroreflex Sensitivity from Spontaneous Oscillations of Blood Pressure and Heart Rate: Proven Clinical Value? Physiol. Meas 2015, 36, 741–753. [Google Scholar] [CrossRef]
- Shaffer, F.; Ginsberg, J.P. An Overview of Heart Rate Variability Metrics and Norms. Front. Public Health 2017, 5, 258. [Google Scholar] [CrossRef] [Green Version]
- Kim, H.-G.; Cheon, E.-J.; Bai, D.-S.; Lee, Y.H.; Koo, B.-H. Stress and Heart Rate Variability: A Meta-Analysis and Review of the Literature. Psychiatry Investig. 2018, 15, 235–245. [Google Scholar] [CrossRef] [Green Version]
- McCraty, R.; Shaffer, F. Heart Rate Variability: New Perspectives on Physiological Mechanisms, Assessment of Self-Regulatory Capacity, and Health Risk. Glob. Adv. Health Med. 2015, 4, 46–61. [Google Scholar] [CrossRef] [Green Version]
- Cooper, T.M.; McKinley, P.S.; Seeman, T.E.; Choo, T.-H.; Lee, S.; Sloan, R.P. Heart Rate Variability Predicts Levels of Inflammatory Markers: Evidence for the Vagal Anti-Inflammatory Pathway. Brain Behav. Immun. 2015, 49, 94–100. [Google Scholar] [CrossRef] [Green Version]
- Taylor, C.E.; Willie, C.K.; Ainslie, P.N.; Tzeng, Y.-C. Assessment of Human Baroreflex Function Using Carotid Ultrasonography: What Have We Learnt? Acta Physiol. 2014, 211, 297–313. [Google Scholar] [CrossRef]
- Heusser, K.; Tank, J.; Luft, F.C.; Jordan, J. Baroreflex Failure. Hypertension 2005, 45, 834–839. [Google Scholar] [CrossRef] [Green Version]
- Ellingson, C.J.; Singh, J.; Ellingson, C.A.; Sirant, L.W.; Krätzig, G.P.; Dorsch, K.D.; Piskorski, J.; Neary, J.P. Alterations in Baroreflex Sensitivity and Blood Pressure Variability Following Sport-Related Concussion. Life 2022, 12, 1400. [Google Scholar] [CrossRef] [PubMed]
- Filgueiras-Rama, D. Sympathetic Innervation and Cardiac Arrhythmias. In Cardiac Electrophysiology: From Cell to Bedside; Elsevier: Amsterdam, The Netherlands, 2018; pp. 387–395. [Google Scholar]
- Parati, G.; Ochoa, J.E.; Lombardi, C.; Bilo, G. Assessment and Management of Blood-Pressure Variability. Nat. Rev. Cardiol. 2013, 10, 143–155. [Google Scholar] [CrossRef] [PubMed]
- Russo, M.A.; Santarelli, D.M.; O’Rourke, D. The Physiological Effects of Slow Breathing in the Healthy Human. Breathe 2017, 13, 298–309. [Google Scholar] [CrossRef] [PubMed] [Green Version]
- Guzik, P.; Piskorski, J.; Krauze, T.; Schneider, R.; Wesseling, K.H.; Wykretowicz, A.; Wysocki, H. Correlations between the Poincaré Plot and Conventional Heart Rate Variability Parameters Assessed during Paced Breathing. J. Physiol. Sci. 2007, 57, 63–71. [Google Scholar] [CrossRef] [Green Version]
- Singh, J.; Ellingson, C.J.; Ellingson, C.A.; Scott, P.; Neary, J.P. Cardiac Cycle Timing Intervals in University Varsity Athletes. Eur. J. Sport Sci. 2023, 1–6. [Google Scholar] [CrossRef]
- Neary, J.; Singh, J.; Bishop, S.; Dech, R.; Butz, M.; Len, T. An Evidence-Based Objective Study Protocol for Evaluating Cardiovascular and Cerebrovascular Indices Following Concussion: The Neary Protocol. Methods Protoc. 2019, 2, 23. [Google Scholar] [CrossRef] [Green Version]
- Parati, G.; Bilo, G.; Kollias, A.; Pengo, M.; Ochoa, J.E.; Castiglioni, P.; Stergiou, G.S.; Mancia, G.; Asayama, K.; Asmar, R.; et al. Blood Pressure Variability: Methodological Aspects, Clinical Relevance and Practical Indications for Management—A European Society of Hypertension Position Paper ∗. J. Hypertens 2023, 41, 527–544. [Google Scholar] [CrossRef]
- Parati, G.; Di Rienzo, M.; Bertinieri, G.; Pomidossi, G.; Casadei, R.; Groppelli, A.; Pedotti, A.; Zanchetti, A.; Mancia, G. Evaluation of the Baroreceptor-Heart Rate Reflex by 24-Hour Intra-Arterial Blood Pressure Monitoring in Humans. Hypertension 1988, 12, 214–222. [Google Scholar] [CrossRef] [Green Version]
- McMillan, N.J.; Soares, R.N.; Harper, J.L.; Shariffi, B.; Moreno-Cabañas, A.; Curry, T.B.; Manrique-Acevedo, C.; Padilla, J.; Limberg, J.K. Role of the Arterial Baroreflex in the Sympathetic Response to Hyperinsulinemia in Adult Humans. Am. J. Physiol.-Endocrinol. Metab. 2022, 322, E355–E365. [Google Scholar] [CrossRef]
- Tzeng, Y.C.; Sin, P.Y.W.; Lucas, S.J.E.; Ainslie, P.N. Respiratory Modulation of Cardiovagal Baroreflex Sensitivity. J. Appl. Physiol. 2009, 107, 718–724. [Google Scholar] [CrossRef]
- Bishop, S.A.; Dech, R.T.; Guzik, P.; Neary, J.P. Heart Rate Variability and Implication for Sport Concussion. Clin. Physiol. Funct. Imaging 2018, 38, 733–742. [Google Scholar] [CrossRef] [PubMed]
- LoMauro, A.; Aliverti, A. Sex and Gender in Respiratory Physiology. Eur. Respir. Rev. 2021, 30, 210038. [Google Scholar] [CrossRef] [PubMed]
- Voss, A.; Schroeder, R.; Heitmann, A.; Peters, A.; Perz, S. Short-Term Heart Rate Variability—Influence of Gender and Age in Healthy Subjects. PLoS ONE 2015, 10, e0118308. [Google Scholar] [CrossRef] [PubMed] [Green Version]
- Thayer, J.F.; Sollers, J.J.; Friedman, B.H.; Koenig, J. Gender Differences in the Relationship between Resting Heart Rate Variability and 24-Hour Blood Pressure Variability. Blood Press 2016, 25, 58–62. [Google Scholar] [CrossRef]
- Koenig, J.; Thayer, J.F. Sex Differences in Healthy Human Heart Rate Variability: A Meta-Analysis. Neurosci. Biobehav. Rev. 2016, 64, 288–310. [Google Scholar] [CrossRef]
- Laitinen, T.; Hartikainen, J.; Vanninen, E.; Niskanen, L.; Geelen, G.; Länsimies, E. Age and Gender Dependency of Baroreflex Sensitivity in Healthy Subjects. J. Appl. Physiol. 1998, 84, 576–583. [Google Scholar] [CrossRef] [Green Version]
- Fu, Q.; Ogoh, S. Sex Differences in Baroreflex Function in Health and Disease. J. Physiol. Sci. 2019, 69, 851–859. [Google Scholar] [CrossRef]
- Kappus, R.M.; Ranadive, S.M.; Yan, H.; Lane-Cordova, A.D.; Cook, M.D.; Sun, P.; Harvey, I.S.; Wilund, K.R.; Woods, J.A.; Fernhall, B. Sex Differences in Autonomic Function Following Maximal Exercise. Biol. Sex Differ 2015, 6, 28. [Google Scholar] [CrossRef] [Green Version]
- Theodorakopoulou, M.; Karagiannidis, A.; Alexandrou, M.-E.; Pella, E.; Karpetas, A.; Baksiova, A.; Tsouchnikas, I.; Papagianni, A.; Sarafidis, P. Sex Differences in Ambulatory Blood Pressure Trajectories and Blood Pressure Variability in Hemodialysis Patients. J. Hypertens. 2022, 40, e110. [Google Scholar] [CrossRef]
- del Pinto, R.; Pietropaoli, D.; Dobre, M.; Ferri, C. Prognostic Importance of Long-Term SBP Variability in High-Risk Hypertension. J. Hypertens. 2020, 38, 2237–2244. [Google Scholar] [CrossRef]
- Williams, D.P.; Joseph, N.; Gerardo, G.M.; Hill, L.K.; Koenig, J.; Thayer, J.F. Gender Differences in Cardiac Chronotropic Control: Implications for Heart Rate Variability Research. Appl. Psychophysiol. Biofeedback 2022, 47, 65–75. [Google Scholar] [CrossRef] [PubMed]
- Lan, Y.; Liu, H.; Liu, J.; Zhao, H.; Wang, H. Gender Difference of the Relationship between Arterial Stiffness and Blood Pressure Variability in Participants in Prehypertension. Int. J. Hypertens. 2019, 2019, 7457385. [Google Scholar] [CrossRef] [PubMed] [Green Version]
- Laitinen, T.; Hartikainen, J.; Niskanen, L.; Geelen, G.; Länsimies, E. Sympathovagal Balance Is Major Determinant of Short-Term Blood Pressure Variability in Healthy Subjects. Am. J. Physiol.-Heart Circ. Physiol. 1999, 276, H1245–H1252. [Google Scholar] [CrossRef]
- Speer, K.E.; Koenig, J.; Telford, R.M.; Olive, L.S.; Mara, J.K.; Semple, S.; Naumovski, N.; Telford, R.D.; McKune, A.J. Relationship between Heart Rate Variability and Body Mass Index: A Cross-Sectional Study of Preschool Children. Prev. Med. Rep. 2021, 24, 101638. [Google Scholar] [CrossRef] [PubMed]
- Konstantinidou, S.; Argyrakopoulou, G.; Tentolouris, N.; Karalis, V.; Kokkinos, A. Interplay between Baroreflex Sensitivity, Obesity and Related Cardiometabolic Risk Factors (Review). Exp. Ther. Med. 2021, 23, 67. [Google Scholar] [CrossRef]
- Chen, H.; Zhang, R.; Zheng, Q.; Yan, X.; Wu, S.; Chen, Y. Impact of Body Mass Index on Long-Term Blood Pressure Variability: A Cross-Sectional Study in a Cohort of Chinese Adults. BMC Public Health 2018, 18, 1193. [Google Scholar] [CrossRef] [Green Version]

| Parameters | Males (n = 100) Mean ± SD | Females (n = 65) Mean ± SD | p-Value |
|---|---|---|---|
| Age (y) * | 21.2 ± 2.1 | 19.7 ± 1.6 | <0.001 |
| Height (m) * | 1.84 ± 0.07 | 1.70 ± 0.07 | <0.001 |
| Body Mass (kg) * | 93.3 ± 16.8 | 66.3 ± 9.2 | <0.001 |
| BMI (kg/m2) * | 27.4 ± 4.5 | 22.7 ± 2.2 | <0.001 |
| Parameters | Males (n = 100) Mean ± SD | Females (n = 65) Mean ± SD | p-Value |
|---|---|---|---|
| HRV During Seated Rest | |||
| HR Mean (bpm) * | 70.1 ± 9.2 | 74.4 ± 12.2 | 0.018 |
| RR Mean (ms) * | 880 ± 120 | 840 ± 140 | 0.044 |
| SDNN (ms) | 66 ± 25 | 66 ± 30 | 0.98 |
| LF% | 53.91 ± 17.26 | 52.94 ± 18.48 | 0.74 |
| HF% | 28.67 ± 16.29 | 31.77 ± 18.26 | 0.27 |
| LF/HF | 2.99 ± 2.50 | 3.10 ± 3.69 | 0.83 |
| SD1 (ms) | 36.0 ± 21.6 | 34.7 ± 22.6 | 0.72 |
| SD2 (ms) | 85.8 ± 30.1 | 86.0 ± 37.7 | 0.97 |
| SD2/SD1 | 2.73 ± 0.79 | 2.89 ± 0.95 | 0.28 |
| HRV During Controlled Respiration | |||
| HR Mean (bpm) * | 73.4 ± 8.5 | 77.4 ± 10.1 | 0.014 |
| RR Mean (ms) * | 850 ± 100 | 810 ± 120 | 0.044 |
| SDNN (ms) | 0.12 ± 0.03 | 0.11 ± 0.03 | 0.22 |
| LF% * | 84.0 ± 7.08 | 86.8 ± 5.4 | 0.004 |
| HF% | 10.08 ± 5.79 | 8.69 ± 5.04 | 0.106 |
| LF/HF | 12.5 ± 10.4 | 13.6 ± 8.0 | 0.055 |
| SD1 (ms) | 54.4 ± 26.6 | 47.43 ± 22.81 | 0.074 |
| SD2 (ms) | 155.1 ± 45.7 | 143.39 ± 44.84 | 0.28 |
| SD2/SD1 * | 3.1 ± 0.64 | 3.4 ± 0.66 | 0.013 |
| BPV During Seated Rest | |||
| SBP | 114.53 ± 10.71 | 114.50 ± 13.65 | 0.99 |
| BP HF Power (mmHg2) | 7.64 ± 6.5 | 6.99 ± 3.93 | 0.43 |
| BP LF Power (mmHg2) | 22.77 ± 15.7 | 23.38 ± 20.7 | 0.84 |
| BP Total Power (mmHg2) | 60.5 ± 35.6 | 55.2 ± 32.7 | 0.33 |
| BPV During Controlled Respiration | |||
| SBP | 112.85 ± 11.95 | 112.32 ± 14.13 | 0.84 |
| BP HF Power (mmHg2) * | 5.6 ± 3.6 | 4.5 ± 2.9 | 0.043 |
| BP LF Power (mmHg2) | 76.69 ± 45.2 | 73.37 ± 39.5 | 0.62 |
| BP Total Power (mmHg2) | 109.0 ± 51.2 | 100.4 ± 44.2 | 0.25 |
| BRS During Seated Rest | |||
| BRS Pooled (ms/mmHg) | 16.9 ±10.3 | 16.7 ± 9.1 | 0.88 |
| BRS–up (ms/mmHg) | 17.8 ± 12.1 | 17.0 ± 11.6 | 0.68 |
| BRS–down (ms/mmHg) | 16.0 ± 8.9 | 16.5 ± 9.1 | 0.75 |
| BRS During Controlled Respiration | |||
| BRS Pooled (ms/mmHg) | 19.2 ± 9.5 | 18.9 ± 9.0 | 0.85 |
| BRS–up (ms/mmHg) | 24.1 ± 12.85 | 23.4 ± 12.7 | 0.70 |
| BRS–down (ms/mmHg) | 15.41 ± 8.1 | 15.5 ± 7.8 | 0.92 |
Disclaimer/Publisher’s Note: The statements, opinions and data contained in all publications are solely those of the individual author(s) and contributor(s) and not of MDPI and/or the editor(s). MDPI and/or the editor(s) disclaim responsibility for any injury to people or property resulting from any ideas, methods, instructions or products referred to in the content. |
© 2023 by the authors. Licensee MDPI, Basel, Switzerland. This article is an open access article distributed under the terms and conditions of the Creative Commons Attribution (CC BY) license (https://creativecommons.org/licenses/by/4.0/).
Share and Cite
Shafiq, M.A.; Ellingson, C.A.; Krätzig, G.P.; Dorsch, K.D.; Neary, J.P.; Singh, J. Differences in Heart Rate Variability and Baroreflex Sensitivity between Male and Female Athletes. J. Clin. Med. 2023, 12, 3916. https://doi.org/10.3390/jcm12123916
Shafiq MA, Ellingson CA, Krätzig GP, Dorsch KD, Neary JP, Singh J. Differences in Heart Rate Variability and Baroreflex Sensitivity between Male and Female Athletes. Journal of Clinical Medicine. 2023; 12(12):3916. https://doi.org/10.3390/jcm12123916
Chicago/Turabian StyleShafiq, M. Abdullah, Cody A. Ellingson, Gregory P. Krätzig, Kim D. Dorsch, J. Patrick Neary, and Jyotpal Singh. 2023. "Differences in Heart Rate Variability and Baroreflex Sensitivity between Male and Female Athletes" Journal of Clinical Medicine 12, no. 12: 3916. https://doi.org/10.3390/jcm12123916
APA StyleShafiq, M. A., Ellingson, C. A., Krätzig, G. P., Dorsch, K. D., Neary, J. P., & Singh, J. (2023). Differences in Heart Rate Variability and Baroreflex Sensitivity between Male and Female Athletes. Journal of Clinical Medicine, 12(12), 3916. https://doi.org/10.3390/jcm12123916